


In a previous blog post, I countered the idea that enrollment issues were the reason behind Sweet Briar’s closing, but just because enrollment is increasing doesn’t mean that there isn’t an enrollment problem. For example, those students who enroll might pay less to attend college than did previous students. The actual amount students are paying is a topic of the next blog post. This post addresses the topic indirectly, through the lens of demographics.
A central explanation being given for Sweet Briar’s closure by leadership and also by media outlets is that there is a demographic shift in those who attend women’s colleges; that, increasingly, women’s colleges are selectively attracting minority students, who, on average, come from poorer families (a fact about modern American society, regardless of the reasons or how people feel about it); and that although this may lead to a desirable increase in campus diversity, it makes it difficult for colleges that rely on tuition revenue to survive.
There are two problems with this line of reasoning. The first, to be discussed in the next blog post, is that students are paying more and more to attend college, countering the idea that a decrease in tuition is the heart of the problem. The second, to be discussed here, is that the increase in diversity at women’s colleges has been vastly overstated. Instead, Sweet Briar messed up, and the leaders should stop blaming fictitious trends in higher education.
The problematic line of thinking can be seen in a number of places, such as in a March 28, 2015, Chronicle of Higher Education article:
“The big picture was equally discouraging. Ms. Wyatt [Vice Chair of the Sweet Briar Board of Directors] had been particularly struck by a study of women’s colleges by Linda Sax, an education professor at the University of California at Los Angeles. Ms. Sax found that the demographic profile of students who attended women’s colleges had changed drastically since the 1970s, when those students tended to come from relatively wealthy families. “Now students entering women’s colleges hail from families with the lowest incomes,” she wrote.
That paper made an impression on Ms. Wyatt. Those findings mirrored demographic changes at Sweet Briar, where 37 percent of students are the first generation in their families to attend college and 43 percent receive federal financial aid. The college had raised its own financial aid to help this new generation afford Sweet Briar’s expensive tuition. It had been good for diversity but bad for revenue.”
The Sax paper cited by Ms. Wyatt was important for determining Sweet Briar’s future. President Jones has cited it numerous times. It is a key part of his narrative. Before President Jones arrived, the Sweet Briar faculty had all been shown the graphs, and the implications had been discussed. A faculty retreat run by the VP of Academic Affairs in January 2014 was largely spent discussing the Sax paper and its implications. The board of directors will likely try to distance themselves from the paper, but, at Sweet Briar, the Sax et al. conclusion that women’s colleges are attracting poorer minority students from less educated families was treated as gospel; if that were the new demographic, Sweet Briar would have to adapt. There was a belief that an incredibly rapid demographic shift at Sweet Briar was a reflection of the world. It was not. It reflected a situation unique to Sweet Briar that was created by a well-intentioned but poorly executed strategic plan to increase diversity.
The unfortunate line of reasoning can also be seen in a March 23, 2015, Business Insider article.
“…[B]oth Sweet Briar president Jones and Paul Rice, the Sweet Briar board chairman, told The New York Times that “Sweet Briar’s rich-girl days were long gone.” Similarly, one professor said today’s Sweet Briar is no longer the “horsy school on the hill,” according to the New York Times.
Jones told The New York Times that for students who entered Sweet Briar in fall 2014, 37% are first-generation college students, 32% are minorities, and 43% received Pell grants – federal financial aid grants for low-income undergraduates.
Sweet Briar determined in 2011 that the alumnae’s changing demographics made it impossible to effectively conduct a large-scale fundraiser. Sweet Briar’s vice president for finance Scott Shank told The News & Advance.”
Although this line of discussion may be distasteful, I am grateful that people are clearly and openly speaking about topics that are too often ignored. For progress to be made, these sorts of uncomfortable conversations are needed. If the board of directors’ decision and reasoning help toward this end, they will have done society and higher education at least a little bit of service.
Unfortunately, in this particular instance, their conclusions relied on faulty data and so did not follow from the reality of the situation. I realized this when I broke down the numbers for students by race/ethnicity using the IPEDS government database of higher education statistics, the gold standard for this sort of data. I found that at the same time Sax et al. showed a striking increase in the proportion of black students at women’s colleges, the IPEDS data showed no increase. There was an increase at Sweet Briar, but it was due to targeted recruiting of minority students as part of President Jo Ellen Parker’s strategic initiative and was not a result of a larger national trend.
So, what gives, and why is this relevant? Regarding the latter, this has to do with the unfortunate truth that black families are substantially poorer, on average, than the national average. It’s not by a small amount, either. Yes, I hate to bring this up, but is it better to ignore it? If so, who is it better for? Regarding the former, I went to the source, the Sax et al. paper so often cited by Sweet Briar leadership.
What I found may be one of the more consequential cases of sample bias in the history of higher education. Because there is no recent demographic shift toward black students choosing women’s colleges. The proportion of black students attending women’s colleges has not changed for at least 10 years. It’s also not true that students going to women’s colleges come from “families with the lowest income.” That, too, is a result of the same sample bias. Because American black families make substantially less money on average than do white families, oversampling of black students will necessarily correspond to underestimating parental income.
Unlike what is stated in the Sax et al. article, young black women are not flocking to women’s colleges. Of those who do go to a women’s college, around half go to one of four colleges in which white students make up less than 5% of the undergraduate population. Women’s colleges, as a sector, are over-represented in terms of the number of colleges in which mostly minority students attend. But when you remove those four colleges from the equation, what you see is a roughly similar racial breakdown for students attending women’s colleges and those attending other liberal arts colleges.
I have made a big claim regarding sample bias, and now it is time to back it up. I’m going to show you a number of graphs. The first two will be the ones from Sax et al. that the Sweet Briar faculty know well. Then, in a few more graphs, I’ll show you what happened.
First, let’s look at the two most consequential graphs in the Sax paper.
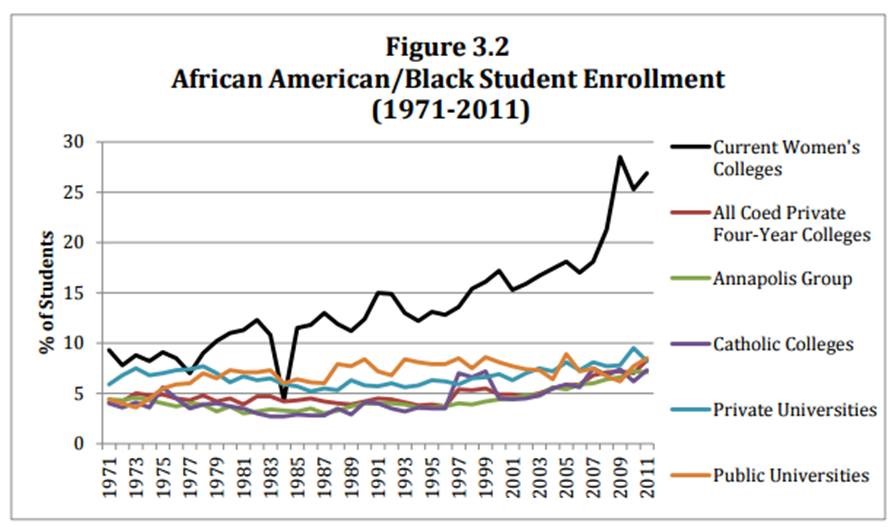
Figure 1. Percentage of African American/Black student enrollment by type of college.
Figure 1 shows two things. First, black students make up a higher proportion of the student body at women’s colleges than at other colleges. Second, there is a tremendous recent increase in the proportion of black students at women’s colleges starting around 2007. If you are used to looking at data, these are suspicious. The ups and downs are too abrupt, and things change too rapidly.
So, why is it relevant to this conversation that students at women’s colleges are disproportionately black? Well, because of this:
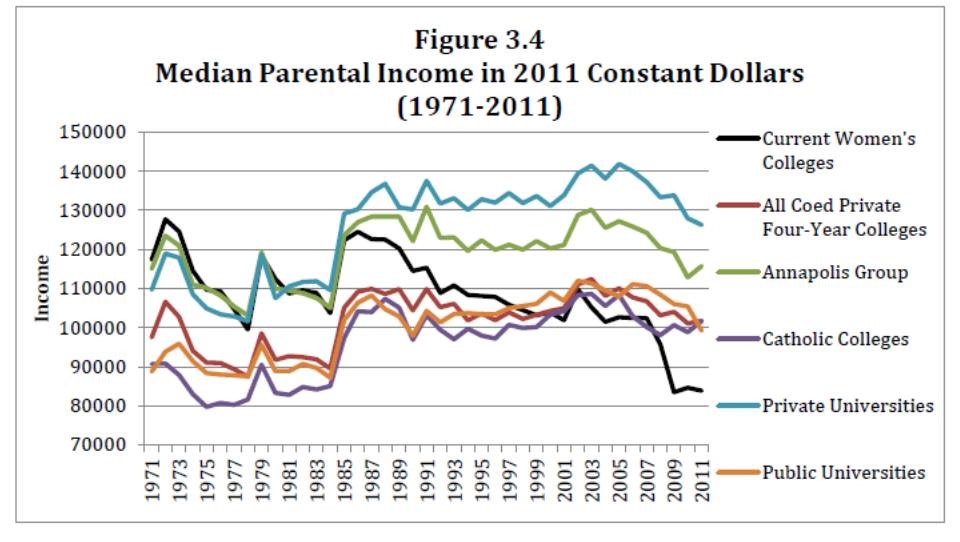
Figure 2. Median parental income by type of college.
Note that starting around 1997, the median family income of students attending women’s colleges was lower than for Annapolis Group colleges but in line with the income of students attending Catholic colleges, coed private four-year colleges, and public universities. Starting around 2007, though, the median family income of students attending women’s colleges dropped sharply, suggesting that students attending women’s colleges were poorer, on average, than students attending any other type of college.
Remember Vice Chair of the Board Elizabeth Wyatt’s statement, “Now students entering women’s colleges hail from families with the lowest incomes?” This is where that statement comes from.
And those students also come from relatively uneducated families that are more likely to be divorced (see other figures from paper). As some have stated or implied, it’s hard to raise money from that sort of alumnae, and they will need extra help to get through college (yes, I am aware of the tastelessness of those comments, but, remarkably, they are being openly made). Despite the offensiveness of that line of thinking, there is a real issue at play here. Sweet Briar is not a particularly cheap school, and its expenses per student are high. It would have to change to be able to accommodate a population that could not afford to pay as much. The board decided it would be better to close.
Unfortunately, there is a problem with all of this from the data validity side. They forgot to be skeptical of data with clear warning signs. The landscape doesn’t change overnight, but it certainly seems to in those graphs. Let’s now look more carefully at Sax et al.’s data:

Figure 3. Replot of Sax et al. data showing increase in percentage of students attending women’s colleges who are black.
Here are Sax et al.’s data again, replotted. There are fewer data points on this graph, because we will be comparing it to IPEDS data, which are only available starting in 1980. There are also gaps early on, as IPEDS data don’t exist for 1981-1983, 1985, 1987, and 1989. I should have left them as gaps instead of connecting the dots, but, well, I messed up.
Figure 4 shows what happens when you overlay the official IPEDS data.
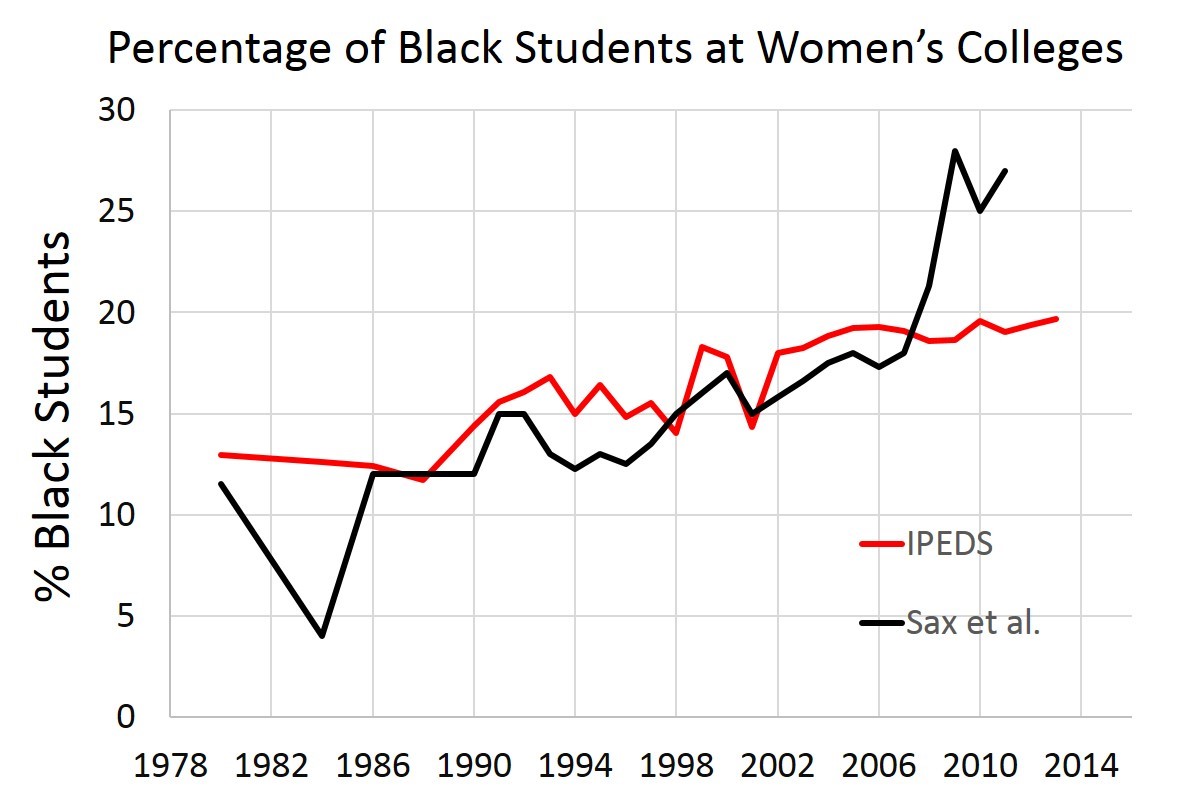
Figure 4. Sax et al. data on black enrollment at women’s colleges overlaid with data from the more complete government IPEDS data set.
The red is the percentage of black students at women’s colleges according to the IPEDS data. There’s a bit of a rise over the last 30 years, but there is no significant upward movement in more than a decade.
Sax et al. did not use the IPEDS database but rather relied on an annual questionnaire that has been sent to all colleges for almost five decades. Different schools fill out and return the questionnaires in different years. Figure 5 overlays in blue the IPEDS data, but only for the schools that Sax et al. included in their analysis for a given year (they can’t include data from questionnaires that are not returned). Note that the overlaid blue line pretty much perfectly aligns with Sax et al.’s data. The only reason it does not align better is that IPEDS does not have data for a handful of the colleges Sax et al. include.
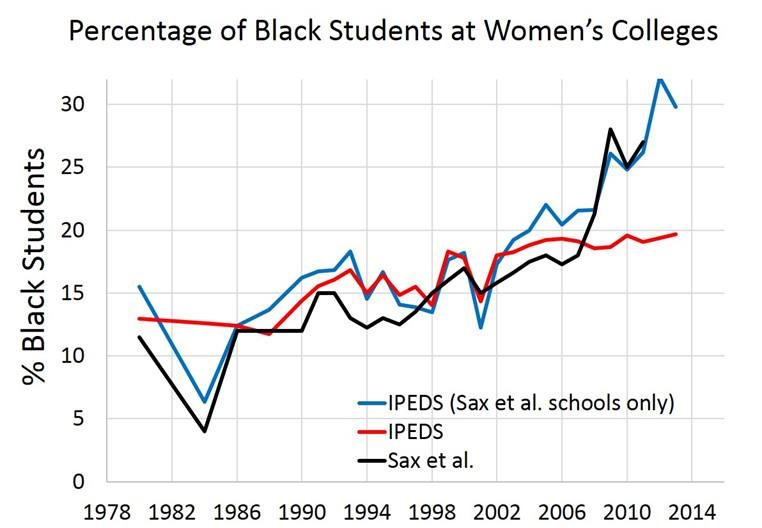
Figure 5. Superimposing IPEDS data from only the schools Sax et al. included in their analyses. The pattern obtained by Sax et al. since 2007, at least, is entirely the result of sample bias.
So why is this happening? Remember the four women’s colleges that are currently almost entirely non-white (<5%) and have large populations of black students (Trinity Washington, The College of New Rochelle, Spelman, and Bennett College for Women)? Today, around half of all black students in women’s colleges are at one of those four. Really, then, there are two demographically distinct groups of women’s colleges, and I suspect that there is not an enormous amount of competition for students between the two groups. Remember, also, that Sax et al. rely on colleges to administer the survey they use, and not all colleges do that every year. In recent years, more and more colleges have stopped sending back surveys. But not the four colleges with small numbers of white students. Mostly, these four schools keep sending back the surveys. When you look at the IPEDS data for only those schools that sent back the surveys, you see a pattern of data that looks just like the one Sax et al. reported. This is known as sample bias, and what it means it that Sax’s data do not reflect the demographic reality of what is happening at women’s colleges.
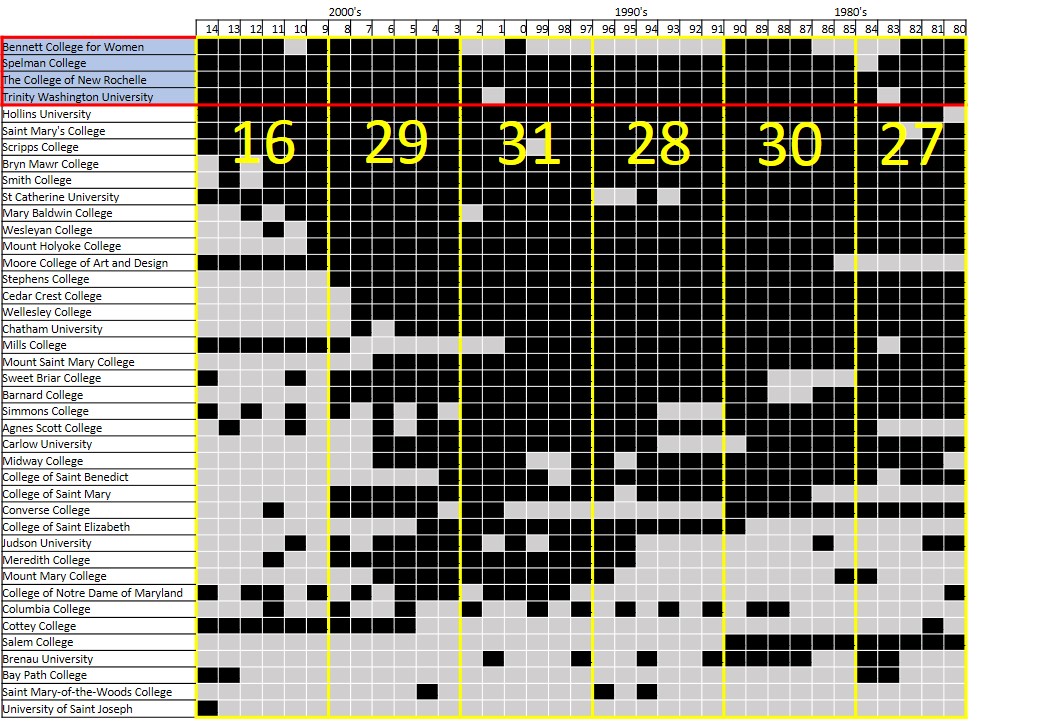
Figure 6. Year by year table showing schools that submitted the questionnaires used by Sax et al. Black squares mean schools returned questionnaires. Grey squares mean they did not return questionnaires. The four colleges in which half of all black students who attend women’s colleges matriculate are highlighted in blue, at the top. Note that those four schools have regularly submitted their questionnaires since 2003. Note also the steep decline in recent years of other colleges returning the surveys. The yellow numbers refer to the average number of the 42 schools that returned the questionnaires in the delineated time periods. This number includes the four colleges with primarily minority student enrollment.
Because Sweet Briar is not likely to be competing with the four predominantly minority women’s colleges for students, it does not make sense to include those schools in analyses relevant to Sweet Briar. Figure 7 shows what happens if you remove the four predominantly minority colleges from the analysis (orange line).
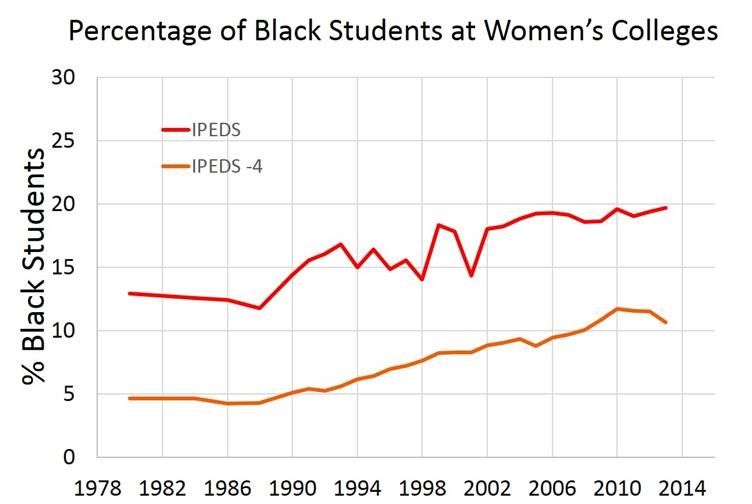
Figure 7. Orange line shows percentage of black students at women’s colleges that are not one of the four colleges with primarily minority enrollment.
Figure 8 shows the orange line from Figure 7 overlaid as best I could on the original Sax et al. figure (it’s now the black dotted line).
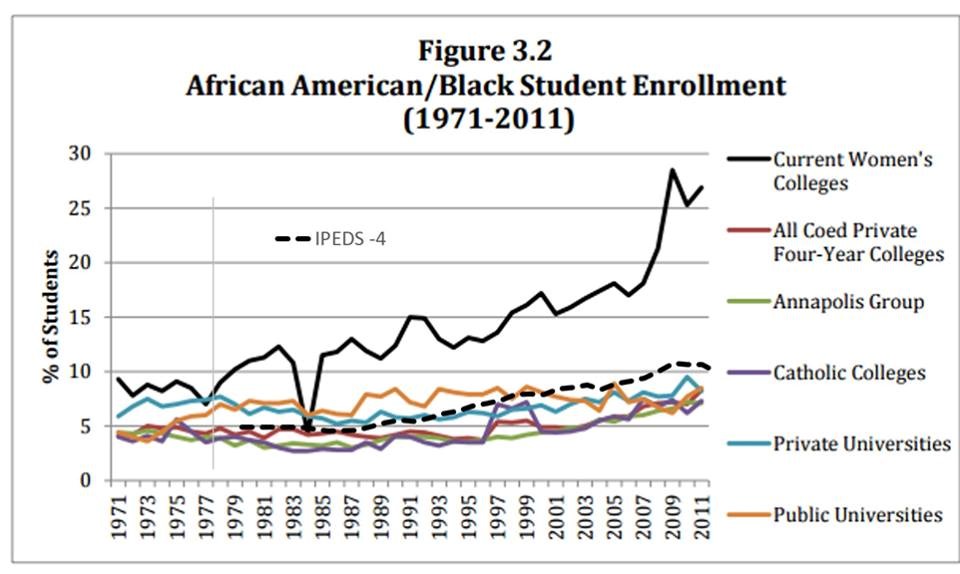
Figure 8. Sax et al. data overlaid with a dotted line depicting the actual proportion of black students at 38 women’s colleges that are not 1 of the 4 that serve primarily minority populations.
The dotted line reflects the proportion of black students at those women’s colleges that do not primarily serve minority students. Although there are demographic shifts across all colleges, it appears that much of what has been said about trends in women’s colleges is due to sample bias.
Why shouldn’t we do the same sort of analysis with the other categories of colleges? Well, someone should, but it wouldn’t be particularly relevant to this story. Women’s colleges are a small subset of colleges, but they happen to have four members with atypically low levels of white enrollment. The disproportionate number of predominantly minority colleges in the women’s college sector is unique and so acknowledging this is disproportionately essential when talking about women’s colleges.
Finally, let’s return to the Sax et al. figure relating to median parental income. The dip in women’s colleges at the end corresponds to the sharp rise in black student enrollment in the previous slide. It is a consequence of the sample bias. It is hard to know what the trends earlier in the graph correspond to, but it probably is at least partially due to sampling bias of some form.

Figure 9. A return to Sax et al’s figure that had such an impact on decision-making relating to Sweet Briar’s closing. With the most egregious sample bias removed, it is almost certain that median parental income for women’s colleges would not show the drop observed starting in 2007. Separating out the four women’s colleges that primarily serve minority populations would almost certainly lead women’s colleges to look more like the Annapolis group in terms of family wealth.
And to spell it out one more time: It is an unfortunate truth that black families tend to make less money and be less educated than white families (the income difference is huge). If you over-sample black students, it will necessarily bias the results of anything that correlates with being from a black family. I can’t correct all of Sax et al.’s graphs because IPEDS does not have all the relevant data, but it is clear from this graph and the last that an appropriate correction would make Sweet Briar look a lot more like the other coed colleges. And if you separated out the four colleges that matriculate primarily minority students, it appears that women’s colleges would end up right back with the Annapolis group again.
I suspect that far from being the home of the least wealthy students, the women’s colleges that are not one of the four predominantly minority women’s colleges are still home to wealthier-than-average students. Do you think the Sweet Briar board of directors would have made the decision to close if they realized that were the case? I don’t. I also do not think Sweet Briar would have embarked on the strategic initiative that it did if the emerging national narrative was not already going in the direction of the Sax report. And the Sax et al. report etched that story in stone. It is the sample bias that changed the world (at least the world of women’s colleges).
I should add that if you believe that women’s colleges are going to selectively attract black/minority students in the future, then it makes sense to selectively recruit from that group (and there are, indeed, reasons to think that a very slow trend in this direction is happening across higher education as a whole). But it does not make sense otherwise if you are as tuition dependent for revenue as Sweet Briar is. There are other ways to act for social justice that are financially feasible. This was a huge mistake by a lot of people, and a lot of people will suffer because of it.
I need to make clear that I very much support colleges exploring initiatives to increase diversity. But implementing a strategy that leads to a revenue shortfall that is then blamed for the closing of a college is about the worst thing that can happen from a diversity perspective, especially if the minorities that are being selectively recruited are being publicly blamed. And even more so if those students are being blamed not only for the demise of one college but for a trend that will likely take down other colleges as well, as President Jones has suggested. Unfortunately, this is exactly the story that has emerged: Sweet Briar is a victim of historical trends involving poor minority students bankrupting women’s colleges.
It is a false story. The real story is that Sweet Briar simultaneously raised tuition and poorly implemented a strategy to selectively recruit minorities; that this backfired because of the unfortunate but real link between the minorities being targeted and family income; that Sweet Briar did not switch course to come up with a more financially viable method of increasing diversity; that Sweet Briar saw in the Sax et al. study a vindication of its past actions, attributing the decrease in revenue to historical and global trends and not to individual strategic decisions; and that Sweet Briar blamed the closing of the college on these trends (and so, indirectly, at least, on the students they specifically targeted). This is damaging to women’s colleges and to liberal arts institutions. It is also damaging to those who value diversity. And it’s sad. There has been an increase in diversity at Sweet Briar College. Enrollment has held steady, and the quality of student remains excellent (The sky isn’t falling – go figure – at least not for that reason).
So many if only’s from all of this.
If only they didn’t mess up the execution of the plan…
If only they didn’t do everything they could to deflect responsibility…
If only their decision making wasn’t based on historical trends that do not exist…
If only they changed course at any one of the many points when it was obvious they needed to…
If only it were easier to talk about this topic without coming across like a racist jerk…
[I have emailed Dr. Sax to make her aware of this. She is a very well-respected researcher, and this kind of thing is what keeps us researchers up worrying about at night. Research is hard, and the best make mistakes. That no one has caught this one is perhaps the bigger story, especially because of the importance placed on it in this situation. Dr. Sax replied letting me know that she received my message]

Marcia Thom Kaley
Again, thank you for your work Dan. Indeed, the BOD created a mess based on data that was inaccurate and was not thoroughly vetted. Very unfortunately, this mess has convinced a number of students that the only option they have is to drop out of college. Surely, there is nothing “ethical nor moral” about that fact.
Dorothy DUNCAN Hodges class of ' 57
In 1957 we needed diversity from within the USA. Students from Korea, India, etc. were on campus with us. That said, I am proud that SBC sued VA to be able to enroll black students, even though it was “late” in the game.
“ethical nor moral” : IF the school should close, why would it not be far better to offer current juniors a senior year, permitting the rising sophomores the chance to determine where they would like to study for their last 2 years; no incoming freshman class would be there. Faculty would have a year to investigate their options. In essence, the school would be on probation, but not closed, thus offering a far better opportunity at reinventing itself, and a far more comfortable situation for all. In my world, THAT is far more ethical and moral than sudden death without cause.