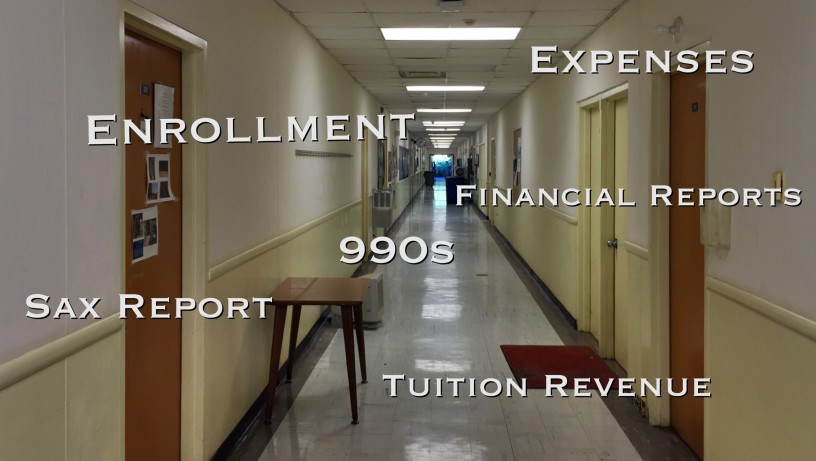


I have tried to provide an alternative read of the numbers surrounding the closure of Sweet Briar College. For those who would like to have a look themselves, this post is for you. A main source of information is a government database accessible to the public, and I’ll explain how I use it and give you a couple of codes that make it easier to compare across peer colleges. I will also post links to other important documents relevant to figuring out the numbers, including audited financials, tax forms (990s), and faculty meeting reports. I plan to update this with additional documents.
The National Center for Education Statistics is the most comprehensive source for statistics about institutes of higher education. For some metrics, their database goes back to 1980. For others, it may only go back a few years. Most people have a hard time figuring out the website at first. I’m pretty sure I don’t use it to its full potential, but I’ll let you know how I use it, anyway.
Our starting point is the main Datacenter page.
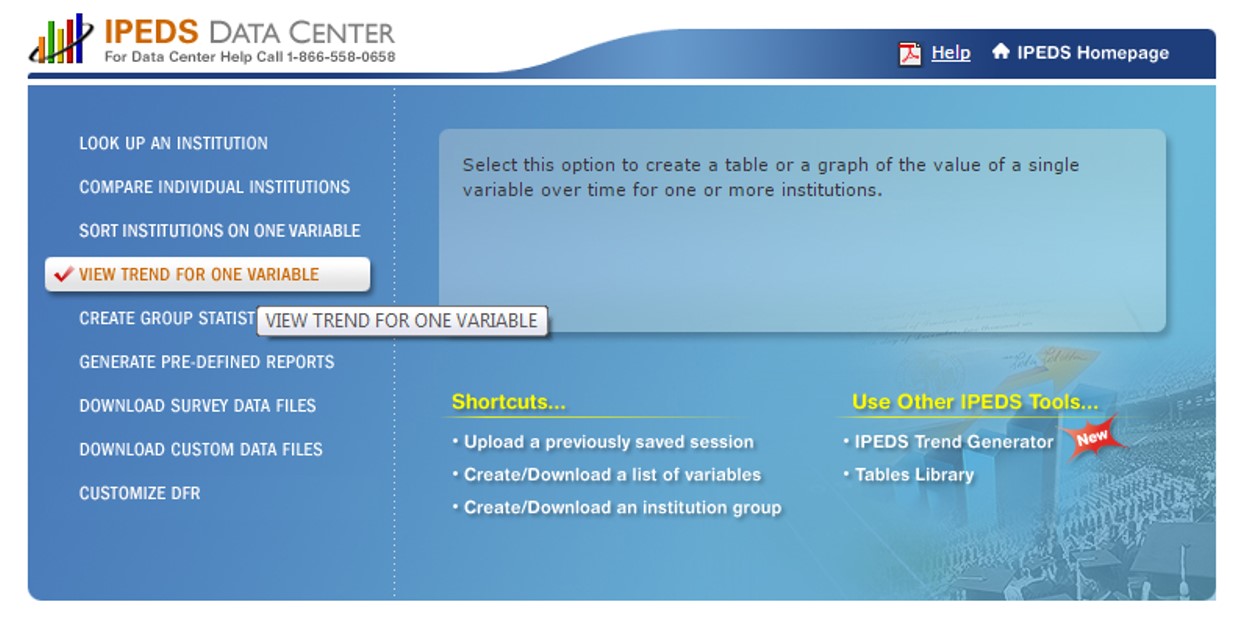 First thing to do is to pick an institution for which you want data. I suggest clicking on ‘VIEW TREND FOR ONE VARIABLE.’ On the next page, I select ‘use provisional release data.’
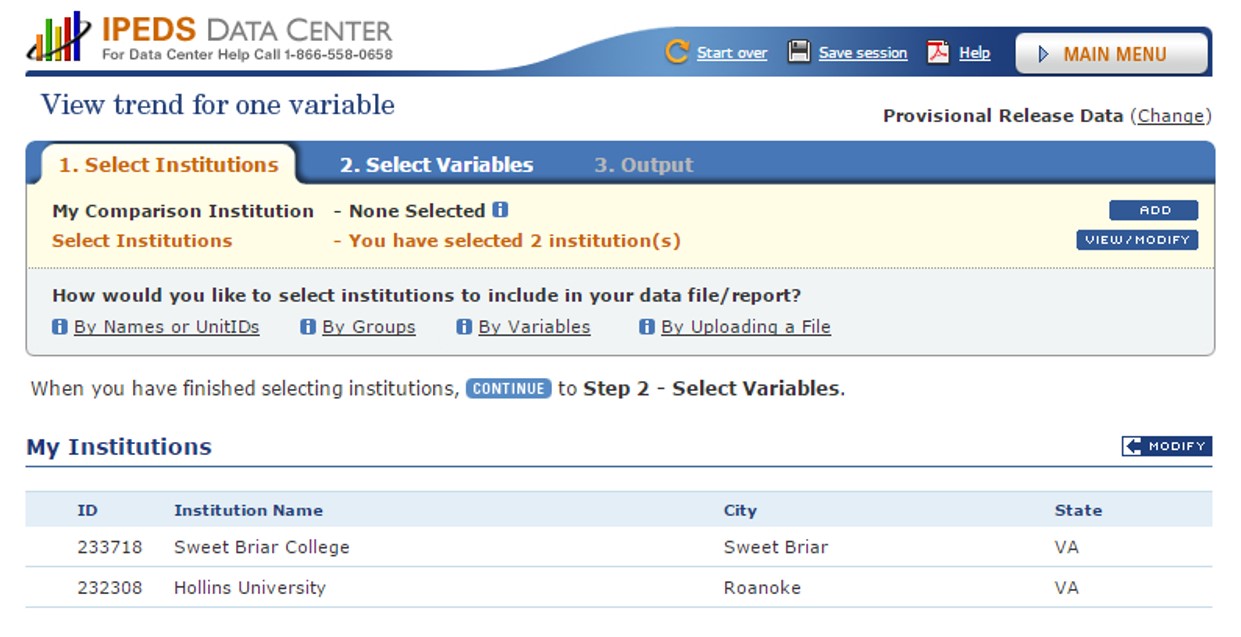
Now it’s time to select your institutions. Type in the college name, and click on it when it comes up in the list.
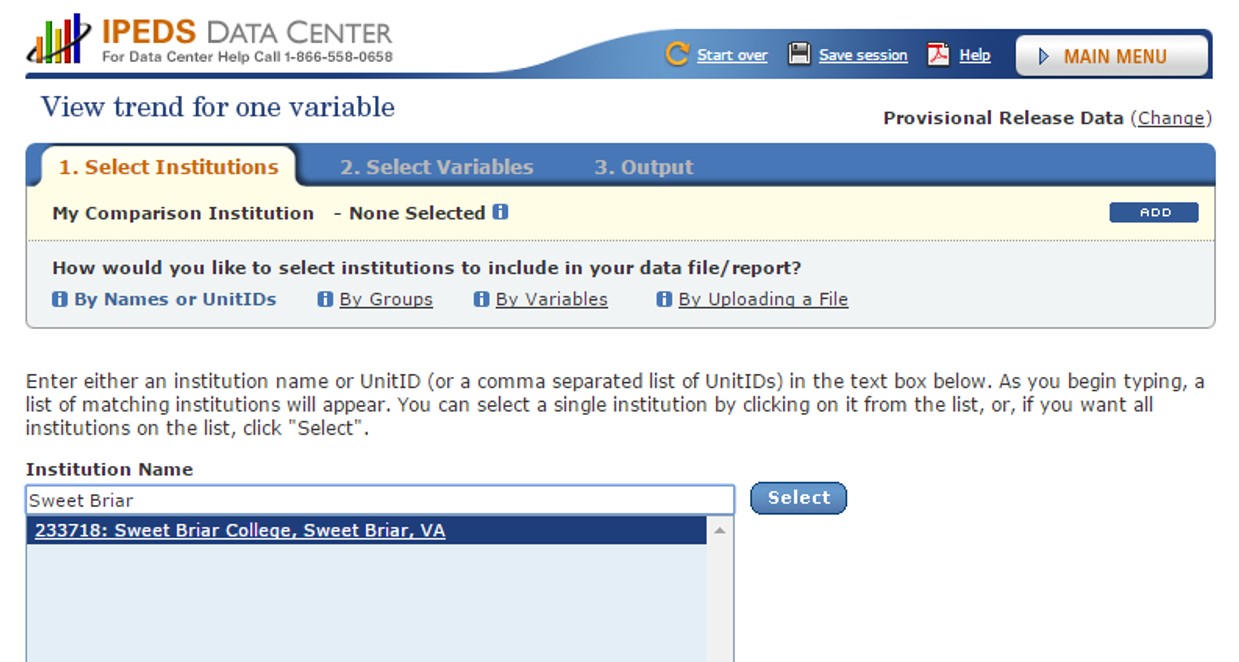
Now, let’s say you are only interested in Sweet Briar. That’s great, but, for whatever reason it is harder to figure out how to extract data for a single college than for multiple colleges. If you don’t believe me, go ahead and try, and I suspect you’ll hit the same strange roadblock a number of us hit. I’m going to go with what I know and pick another college by clicking on ‘By Names or UnitIDs’ and doing the same thing I did with Sweet Briar but with Hollins. That should bring you here:
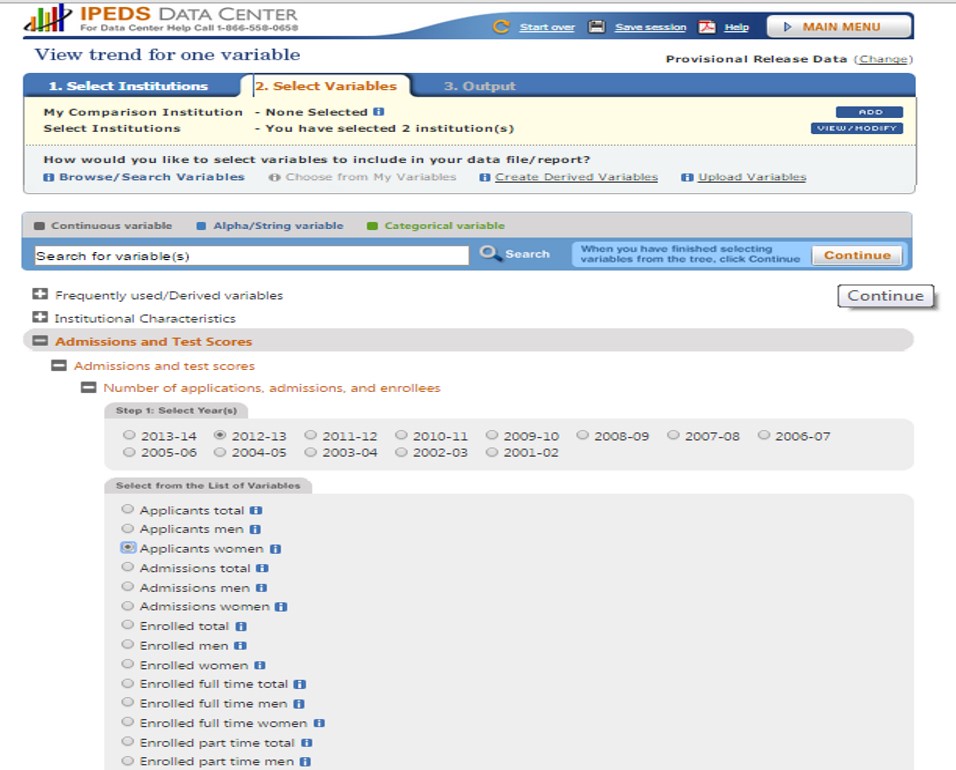
Now it’s time to look up some information. First, click on the ‘2. Select Variables’ tab. You will be given a list of categories. I have expanded the ‘Admissions and Test Scores’ category along with the ‘Number of applications, admissions, and enrollees’ subcategory. Now you must choose a year and the specific category you want data for. As for the year, what I generally want is data for as many years as possible, but at this point in the process, just select any year. You will select them all on a subsequent page. For specific category, let’s go with ‘applicants women.’ Click continue after checking your two boxes (year and category).
Now is where you get to select the years to be included. I always check ‘select all’ to get as many as they have available. This should bring you to the data:
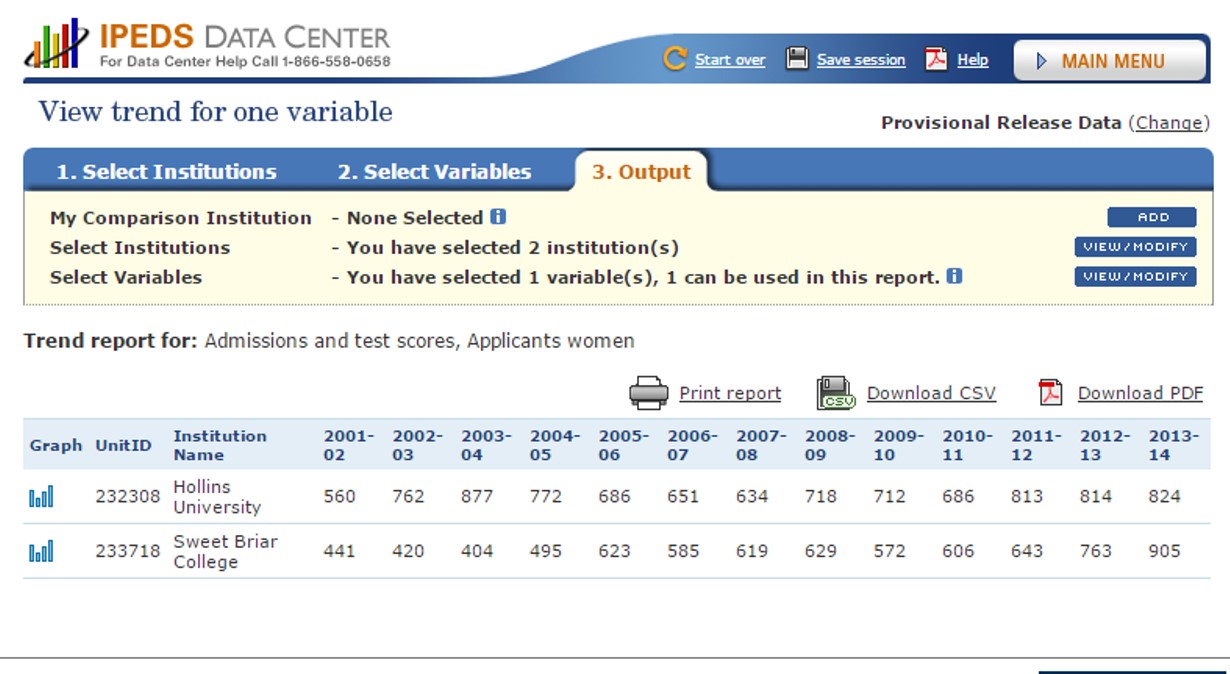
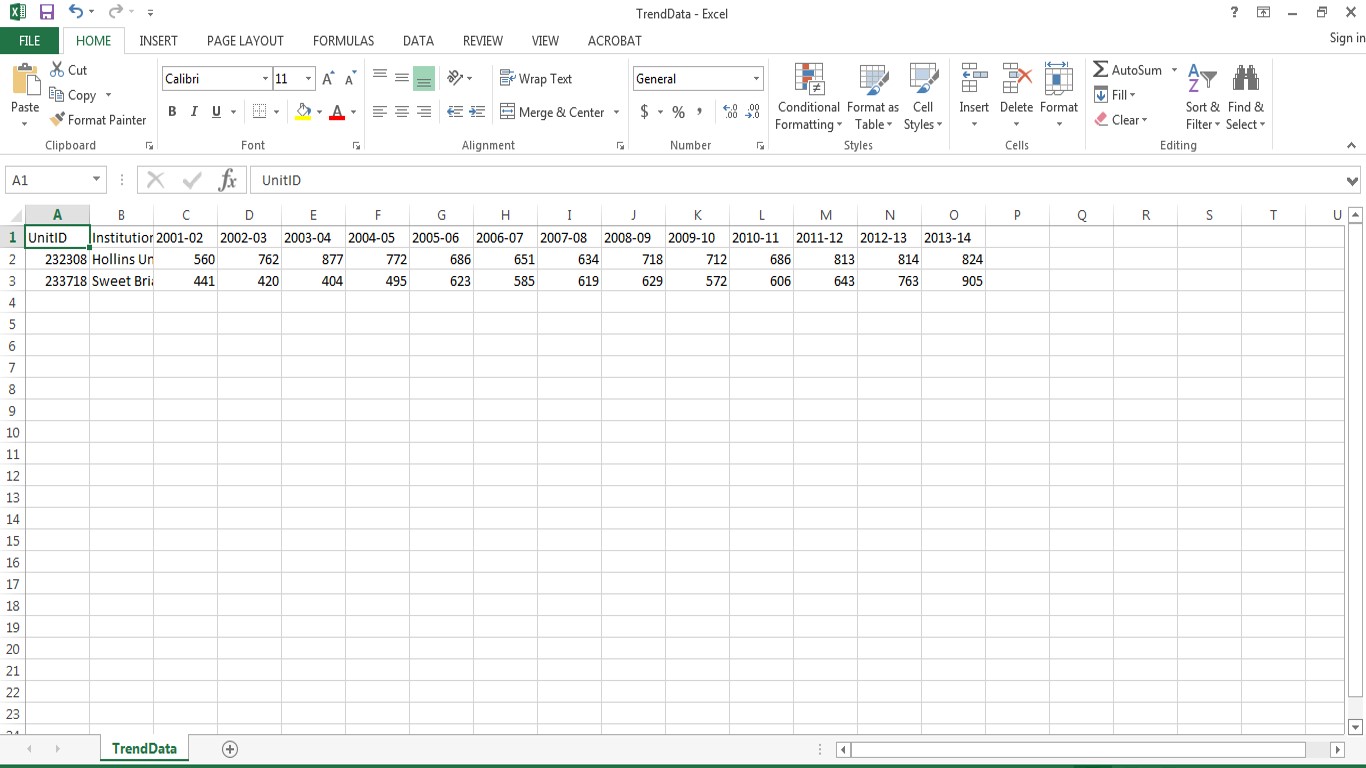
If you just want to see what things look like, that’s enough, but to put the data in a spreadsheet, click on ‘Download CSV,’ then click on the downloaded file. If your computer is set up like mine, this will open the file in Microsoft Excel.
You can save your session at any point. This generates a passcode good for one month that will bring you back to wherever you were in terms of the institutions and variables you selected.
To enter a passcode, click on ‘Upload a previously saved session’ on the Datacenter homepage or click here.
Here is a passcode that will give you the group of 42 women’s colleges I use in my analyses: Guest_469673756675 (or click here to get a text file of the college IDs that you can copy and paste into the institution search bar)
Here is a passcode that will give you the group of 125 Annapolis Group colleges I use in my analyses: Guest_8512293147 (or click here to get a text file of the college IDs that you can copy and paste into the institution search bar)
1. There is a lot of data to work through, and the same idea (enrollment) might have a number of different measures (Total, FYE, First year, Full Time Degree Seeking, etc.). Sometimes these measures are distributed across different categories. Sometimes the same measure is found in two categories, and sometimes you can access more past years in one of those categories than the other. All this is to say that its important to understand the differences among the measures of whatever it is your interested in and to have gone through the categories well enough to have found most of the relevant ones.
2. For Sweet Briar, the most relevant enrollment metric to revenue is Full Time Degree Seeking. Don’t use FYE, and definitely don’t use Total. Oh, and for whatever reason, Fall enrollment and not 12 month enrollment is what is typically reported in other venues.)
3. Both net tuition revenue per student and discount rate are applied to incoming classes only. Net tuition revenue per student is the average real cost of college for a student. It includes tuition, room and board, fees, and supplies. But there’s a caveat: It only applies to those students receiving some form of institutional aid. At Sweet Briar, this is most students, but it wasn’t always that way and isn’t at other schools. If you want to know the average real cost of college for all first year degree seeking students, you need to derive that. I do it by multiplying net revenue per student by the proportion of students receiving institutional aid and add that to the product of the undiscounted cost of college and the proportion of students not receiving institutional aid. So…yeah…this is why this kind of thing takes so long.
4. There are occasional mistakes, so it’s good to check for them. For example, Sweet Briar’s tuition for 2009-2010 was listed incorrectly in one place and correctly in another. This made a difference. With the incorrect number, there was a large tuition rise for 2010-2011 under the leadership of Paul Rice and Jo Ellen Parker. With the correct number, the large tuition rise happened for 2009-2010 under the leadership of Ginger Collier and Betsy Muhlenfeld.
5. If you are looking up demographic information relating to race/ethnicity, keep in mind that around 2010, schools began offering people a ‘2 or more’ option that draws a few percent. Also, at some schools a high percentage of students put ‘unknown,’ which sometimes needs to be corrected for.
Audited Financials:
2013-2014 & 2012-2013 | 2012-2013 & 2011-2012 | 2011-2012 & 2010- 2011 | 2010-2011 & 2009-2010 | 2009-2010 & 2008-2009 | 2008-2009 & 2007-2008
Tax Forms (990s):
2012-2013 | 2011-2012 | 2010-2011 | 2009-2010 | 2008-2009 | 2007-2008 | 2006-2007 | 2005-2006 | 2004-2005 | 2003-2004 | 2002-2003 | 2001-2002 | 2000-2001 | 1998-1999
Faculty Meeting Reports:
Financial | Development | Admissions | Institutional Research | President | Chief of Staff | Dean | Faculty Executive Committee Reports/Minutes | Board: Buildings & Grounds | Board: Development | Board: Educational Programs | Board: External Affairs | Minutes of the Faculty Meeting
Transcript of Scott Shank’s 3/20 presentation to the faculty of the talk to the board the shut down the college. Talk | Q & A
(This was not supposed to be recorded. When Scott found out, he refused to further meetings with faculty leadership. I’m glad someone recorded it, though, and that a transcript was made.)
Bond Documents:
- 2014 renegotiation of 2011 bonds adding liquidity ratio
Other Documents:
- 2014-2015 SBC Fact Sheet (Information about Fall 2014 class)
- 3/28/2015 Chronicle of Higher Education Article on closing with quotes by Wyatt
- 5/2/2015 Brown/Shapiro Richmond Times Op-Ed
- 5/3/2015 Wyatt/Taylor Lynchburg News Advance Op-Ed
- Board Bylaws as of 2009
- Amendments to the Board Bylaws made just before meeting to close college
- Moody’s Report
- Sax Report
- Sweet Briar/Hollins Merger Document
My Own Writings:
- Story of Sweet Briar Blog Posts 1-4 (Enrollment, Sax Report, Tuition Revenue, etc.)
- Roanoke Times Op-Ed, 5/3/2015, Sweet Briar Doesn’t Have to Close; Here’s Why
- Presentation to North Carolina Alumnae at Bronto Software in Durham, NC, 4/26/2015 PDF | PPT
- Presentation to Executive Board of Directors, 4/9/2015 PDF | PPT
- Roanoke Times Letter to the Editor, 3/30/2015, Keep the Story and Sweet Briar Alive.
- A bunch of charts relevant to SBC and women’s colleges PDF | PPT
- Early Facebook posts (Why Sweet Briar is NOT closing series – some of it is a bit dated, but it mostly still holds) PDF | PPT

Leave a Reply
You must be logged in to post a comment.