


This is the last in a trilogy of posts about enrollment and its role in the Sweet Briar story. The first of the series showed that there were no enrollment trends, at Sweet Briar or nationally, that pointed toward the need for Sweet Briar to close. The second of the series showed that the demographic changes in the student population that have been used to justify its closing were not a necessary result of historical trends. The revenue problems were brought about by poor administrative decision-making and an inexplicable refusal to change course. This final post will continue along similar lines but will focus on the mysterious links among enrollment, discounting, and revenue. If the last post was uncomfortable because of issues relating to race, this post is uncomfortable in that people are treated as commodities. But it’s clear that revenue matters, and in this regard all categories of students are not equal.
So, How Many Students Go to Sweet Briar?
For those who are confused about all the different enrollment numbers being thrown around, you are not alone. It is a mess brought about by the different categories of students who may or may not be included in different metrics.
For example, the Washington Post wrote: In 2010, the college had 760 students. Last fall, it reported 700.
Moody’s claims, in one of the more misleading statements among many, that from 2008-2014, enrollment dropped 15%, to 681. For them, 2010 enrollment was 743.
Inside Higher Ed reported 2010 enrollment at 605.
Then there is the Roanoke Times reporting first year enrollment for 2014 at 154, whereas Sweet Briar sometimes lists the incoming class at 169.
In another article, the Roanoke Times quote SBC lawyer Woody Fowler as saying that Sweet Briar needs 800 students but as of spring 2015 has 532.
One of the reasons we are seeing all these different numbers is that certain ones fit people’s specific agendas better than others. Moody’s, for example, seems intent on painting the worst possible picture of Sweet Briar’s situation, and they cherry pick numbers and present graphs in a way that seems designed to mislead ( an interesting coincidence is that a current SBC director is also a current and former Moody’s executive).
Another reason for all of the different numbers that have been reported is more innocent: Most people have no idea why there are multiple metrics, let alone what the differences among them are. That was the position I was in until recently. So, I have done my best to figure it out and, for the purposes of the post, to figure out what it all means for revenue.
A Case Study of 2010-2011
I have more detailed financial information for 2010-2011 than for other years. That year also happens to be key in understanding what happened at Sweet Briar. So, to understand the more general revenue issues, I will first focus on the enrollment and revenue numbers from 2010-2011.
Total Enrollment
Let’s start with the Washington Post enrollment number for fall 2010: 760. This is the highest enrollment number you will see for that year unless someone presents 12 month enrollment numbers. As far as I know, no one has done this, so we’ll stick to the fall enrollment numbers.
The 760 refers to fall total enrollment. This is the metric used by US News and World Report in their rankings. It includes: Full time degree seeking undergraduates, part time undergraduates, full time graduate students, part time graduate students, and students enrolled in Sweet Briar’s Junior Year in France or Junior Year in Spain programs. A faculty spouse who takes one class, a junior from Reed College who spends a semester in Paris in a Sweet Briar study abroad program, and a full-time on-campus psychology major all contribute equally to this metric.
As can be seen in Figure 1, of the 760 enrolled students in fall 2010, 599 were full time on-campus degree-seeking undergraduates, 24 were part time on-campus undergraduates, 9 were full time graduate students, and 4 were part time graduate students. In addition, 81 were in the Junior Year in France program, and 43 were in the Junior Year in Spain program. Add all those up and you get 760.

Figure 1. UG = undergraduate. GS = graduate student. JYF = Junior Year in France. JYS = Junior Year in Spain. Most JYF/JYS students are students from other institutions participating in Sweet Briar’s study abroad program. Part time UG, full time GS, and part time GS total 37 students (5%)
From FTE (Full Time Equivalent) enrollment to Headcount: the need to further separate out apples and oranges
From a revenue perspective, total enrollment is not a useful metric because the different categories of students generate vastly different amounts of money. For example, a part time student does not generate as much revenue as a full time student.
The 743 number that Moody’s uses is FTE (Full Time Equivalent) enrollment. This number is total enrollment with a correction for the part time students. For Sweet Briar, the correction is to count each part time student as 40% of a full time student. This means that the 28 part time students reduce the enrollment number from 760 to 743 FTE, as 40% of 28 rounds to 11. FTE is the number that is multiplied by tuition/fees to determine the gross tuition revenue number reported in financial documents.
FTE might be a good number to use at other institutions, but it’s not at Sweet Briar. Not only does it consider undergraduates and graduate students to be equivalent, but it also considers on-campus and JYF/JYS students to be equivalent. This is problematic because JYF and JYS have very different revenue/expense structures than do on-campus programs. Furthermore, the majority of JYF/JYS students are students from other institutions taking advantage of Sweet Briar’s program. Adding on-campus and JYF/JYS students together combines apples and oranges.
So, let’s break our FTE number into its component categories and look at the differences in revenue obtained from the different types of students. If we separate out the full time and part time undergraduate on-campus students from the FTE number of 743, we get 609. (the 24 part time undergraduates correspond to 10 full time undergraduates). Tuition for each of those 609 FTE students was $29,245. In addition, each of the 599 full time students paid another $475 in fees.
For the 13 graduate students, the situation is different. All tuition is generated on a per credit hour basis, and it differs for the two graduate programs Sweet Briar offers, one leading to a Masters of Education (MEd) and one to a Masters of Teaching (MAT). For the MAT program, the 2010 tuition was $475/credit hour. For the Med, it was $310/hour. In fall 2010, there were 5 full time MAT students, 1 full time MEd student, and 3 part time MEd students (those students were apparently counted as full time students in the IPEDS database, but Sweet Briar internal documents have them listed as part time students). Total net revenue was a year equivalent of $73,200, or, using the part time = 0.4*full time conversion, approximately $10,000 per FTE student. In addition, there were 4 part time non-degree seeking students who brought in a year equivalent total of $7560, less than $2,000/student. In total, then, the 13 graduate students brought in a total of a year equivalent $80,760. In 2010, it appears that the average part time graduate student was only worth about 0.2 full time students, leading to a graduate student FTE of 7.4. This corresponds to about $10,913 per student.
So, the best guess is that each FTE graduate student is worth a little more than a third of a FTE undergraduate, that each part time graduate student is worth a fifth of a full time graduate student, and that each part time undergraduate is worth two fifths of a full time undergraduate. The small sample size means that these are rough estimates, but they are close enough for current purposes.
This has probably already gotten confusing, and I’ll summarize soon, but first, there is one more large group to address – the Junior Year in France and Junior Year in Spain students. In fall 2010, there were 81 JYF and 43 JYS students. Based on Sweet Briar budget documents, if those numbers were the same in the spring, revenue from the programs would have been $3,145,430 and $1,393,050, respectively. This means that each additional JYF student brought in $38,832/year-in-program, and each additional JYS student brought in $32,397/year-in-program.
Here’s a summary of where we are. In 2010, in terms of gross revenue from tuition and fees, each of the following types of students contributed roughly the following amount:
- Full time on-campus undergraduate: $29,720
- Part time on-campus undergraduate: $11,698
- Full time graduate student: $10,913
- Part time graduate student: $2183
- JYF/JYS student: $35,500
One problem with knowing what to make of these numbers is that room and board is included in the JYF/JYS revenue (there is no separation of tuition from room & board), and expenses for junior year programs are different and separate from other Sweet Briar expenses. For JYF/JYS, it is a bit difficult to know exactly how to determine the proper amount of net revenue generated per additional student, as it varies year to year and does not fully scale with changes in enrollment, but a reasonable estimate is that each additional student in one of these programs nets Sweet Briar approximately $3500/year ($1750 for each semester they are abroad).
Other corrections are needed, as well. Full time on-campus students pay room and board, but part time students probably do not. How much net revenue (revenue after expenses) is obtained from room and board? This, too, is difficult to ascertain with precision, but one can get an idea by looking at the revenue and expenses involved in auxiliary services. Besides room and board, auxiliary services also includes the conference center, faculty and staff housing, summer programs, and a number of other components to running a college.
Figure 2 shows a breakdown of auxiliary services expenses for 2009-2010 and what was budgeted for 2010-2011 (from an internal Sweet Briar document). Looking at that, it seems reasonable to assume net revenue from room and board to be around 45% of the actual cost. That is about $5000 for 2010-2011. So I’ll assume that Sweet Briar received around $5000 in additional profit from each full time on-campus student that it likely did not get from part time students and that it definitely did not get from JYF/JYS students. Although not all full time students live on campus, most do, so I won’t try and adjust further for that.
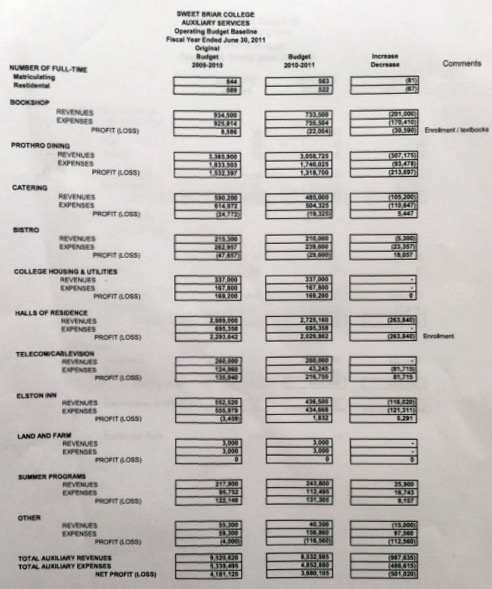
Figure 2. Auxiliary services revenue/Expenses from 2009-2010 and budgeted for 2010-2011
So, can we just add this $5000 to the tuition for each full time student? Yes, but first we need to know more about tuition because most students don’t pay the full tuition sticker price. For example, in 2010-2011, the average full time undergraduate paid tuition of around $15,500. It’s hard to know what part time undergraduates paid. It’s probably not the full 40% of $29,245 ($11,688) each, but is it as low as 40% of the $15,500 ($6200)? Because part time students include faculty, staff, and relatives of faculty/staff who get free tuition, we’ll go with the low-end number of $6200.
Although we do not know the exact numbers for each category of student, we’re getting closer to understanding things from a revenue perspective. Net revenue per student, which includes estimated net (not gross) revenue from room and board, when applicable, was close to the following in fall 2010:
- Full time on-campus undergraduate: $20,500
- Part time on-campus undergraduate: $6200
- Full time graduate student: $15,913 (assuming they live on campus)
- Part time graduate student: $2183
- JYS/JYF student: $3500 (year long equivalent)
(Note that that Net Tuition Revenue and Fees number reported in IPEDS and elsewhere is a bit different than what we are computing here. Those numbers are based on what the total cost to an average student receiving financial aid is and so they include the full room and board amount. Here, we are interested in the revenue to the college, so we are attempting to remove the cost of rooming and boarding from our estimates. We are also computing a number for all students, regardless of whether or not they receive some form of institutional financial aid.)
The greatest uncertainty is in revenue from graduate students and part time students, but they contribute a relatively small amount to the total revenue, so if I’m off by a bit, it won’t change the overall story. Perhaps here it’s best to step back from the details a little. In general, between graduate students, part time students, and JYF/JYS, Sweet Briar seems to net about $600,000 – $1,000,000 in revenue. The rest is from the full time degree seeking undergraduates, and it’s clear that a disproportionate amount of revenue comes from this group. For this reason, the most important metric for understanding Sweet Briar’s finances is the number of Full time degree seeking undergraduates. This measure, or something very close to it, is referred to as headcount. It is the measure that corresponds to the 605 value reported in Inside Higher Ed (small variations in this number are to be expected, as it varies depending on when, exactly, enrollment is measured). It is also the measure that VP of Finance Scott Shank used in revenue and enrollment projections that convinced the board to close. I’m not surprised he used the most appropriate metric. Shank knows numbers and how to use them effectively.
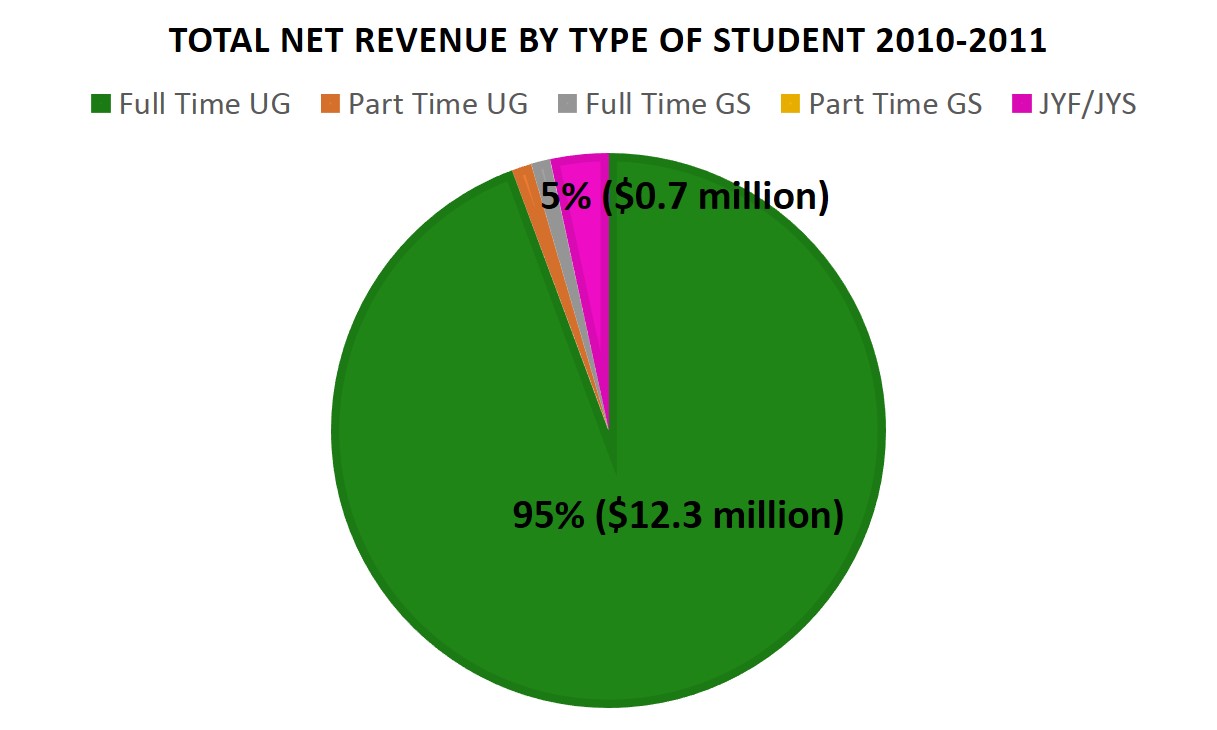
Figure 3. Total net revenue includes tuition after institutional aid and estimated revenue after expenses for room and board. It does not include revenue from federal or state grant aid. JYF/JYS students influence enrollment number much more than they influence net revenue (see Figure 1). Because of this, both total enrollment and FTE enrollment are not good metrics for understanding enrollment based revenue at Sweet Briar.
I hope it’s now clear why total enrollment and FTE enrollment are not useful metrics for understanding the revenue situation at Sweet Briar. Each additional full time undergraduate generates around 6 times the revenue per year of an additional JYF/JYS student. And each full time undergraduate may stay for four years, whereas most JYF/JYS students are part of Sweet Briar for only a semester.
Moving forward from 2010-2011
Discount rate and tuition revenue
Ok, now we are ready to tackle the issue of discount rate and what it means. We won’t have to worry about JYF/JYS and graduate students because we will be tallying the discount rate for incoming undergraduates, and incoming freshman do not participate in junior year abroad programs.
Discount rate is most commonly computed as total institutional aid divided by gross tuition/fee revenue. Institutional aid is any sort of scholarship an institution grants, whether merit-based, need-based, or other, but does not include federal and state grants. In effect, institutional aid is just a way to charge different people different amounts of tuition. Almost everyone gets some form of institutional aid and so a discount.
To figure out gross tuition revenue for an incoming class, all one has to do is multiply the number of students in the incoming class (number of freshman) by the tuition/fee sticker price. In the IPEDS database, the incoming class size relevant to discount rate is known as the Fall Cohort. For 2010-2011, this number was 180, and tuition/fees was $29,720, so total gross tuition revenue was $5,349,600. IPEDS provides numbers for total institutional aid (for incoming class) but only from 2008 on; however, we can figure out total institutional aid dating back to 2001 by multiplying the average institutional aid by the number receiving aid. Keep in mind that average institutional aid is only calculated for those students who receive aid and not for all students. This is why we can’t simply divide average institutional aid by tuition to determine the discount rate.
Figure 4 shows the discount rate since 2001 at Sweet Briar and two comparison groups of colleges. The Annapolis Group is a group of roughly 125 liberal arts colleges of which Sweet Briar is a part. It is generally considered Sweet Briar’s peer group. The other comparison is with the 42 women’s colleges for which I could find data on the IPEDS government site.
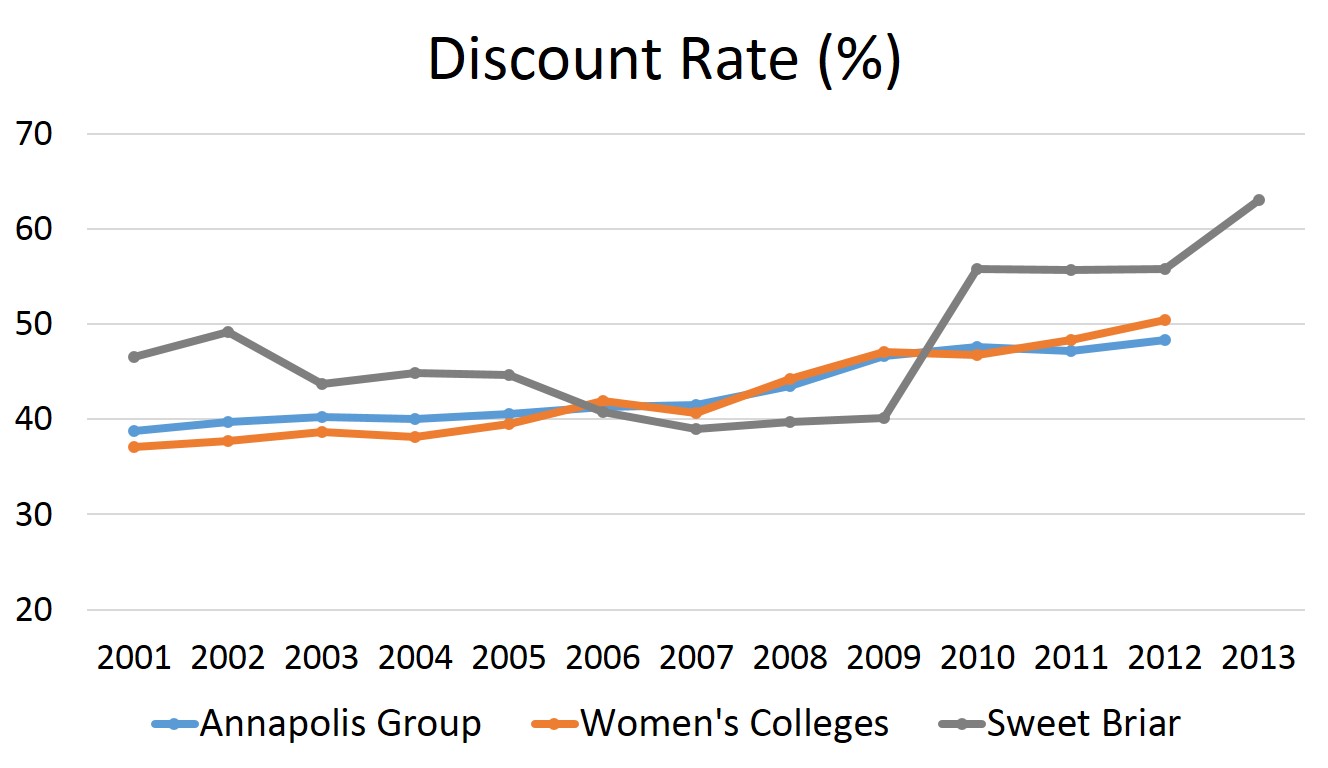
Figure 4. Discount rate for an entering class is simply total institutional aid divided by gross tuition/fees revenue. It does not include room & board or federal and state grant aid.
Note that although discount rate is increasing at Annapolis Group schools and at women’s colleges, the trend is smooth and gradual. That is not the case at Sweet Briar, where there was a sudden jump between 2009-2010 and 2010-2011. This corresponds to implementation of President Parker’s recruiting/financial aid strategy.
At this point, we can figure out the average tuition revenue per incoming student by multiplying the discount rate by tuition. Figure 5 shows the inflation adjusted average tuition revenue per student. Keep in mind that room and board are not included in this graph!
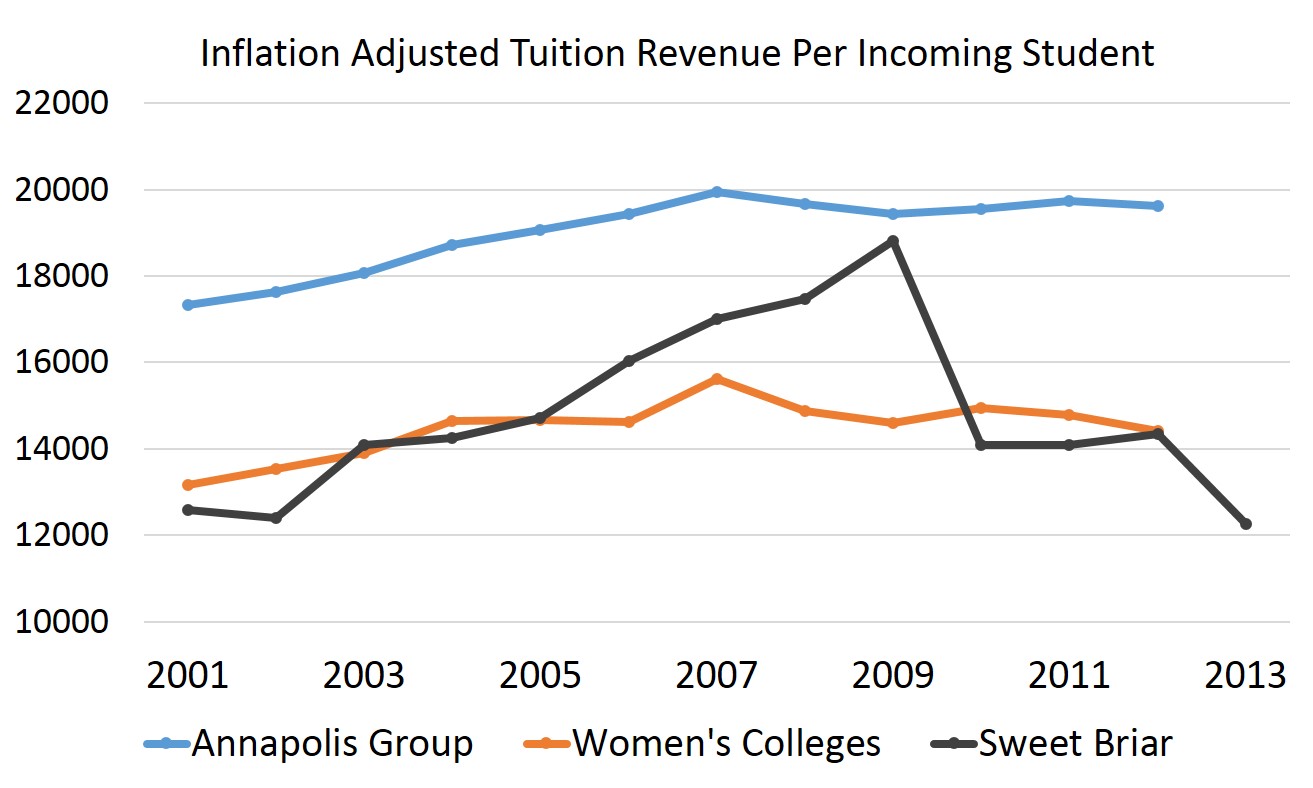
Figure 5. Tuition revenue per student is simply tuition multiplied by discount rate. It does not include room and board.
Two things jump out. First, net tuition revenue per student has been mostly flat across the sector for a number of years, even though the discount rate has been increasing. This is the result of the game colleges play in which they simultaneously raise both tuition (see Figure 6) and discount rate. They are saying, in effect, “Look, I’m a really expensive college, but I’m going to give you a great deal!” I think this is a bad approach because people may be put off by a high sticker price before they know about the amount of discount, but it’s not an unusual strategy.
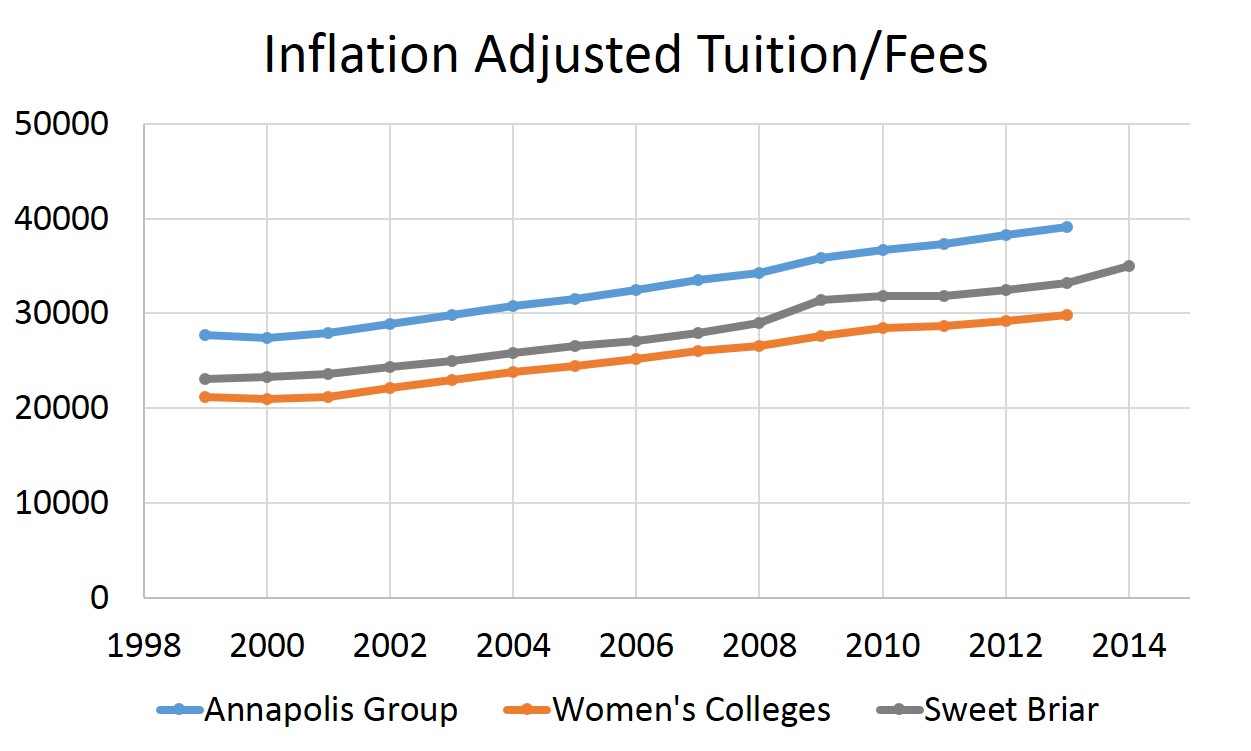
Figure 6. Tuition has been on the rise for at least two decades, but tuition revenue has flattened out because of an increase in the discount rate. Note that in 2009-2010, Sweet Briar boosted it’s tuition to be significantly above the average for women’s colleges and kept it there. I originally thought this occurred in the following year, per IPEDS data, but it appears that in some places, IPEDS has the wrong tuition listed for 2009-2010. I checked the SBC course catalogs and found that, indeed, the big rise in tuition happened in 2009-2010 and not 2010-2011.
I hope, though, it’s clear that students are not paying less and less to attend college at Sweet Briar’s peer institutions. But they are at Sweet Briar. Note the sharp decrease in revenue per student that coincided with Sweet Briar’s increase in discount rate (Figures 4 and 5). An inflation adjusted drop of $4750 in a single year is enormous, and for 2013-2014, there was another drop of about $2000.
When headcount is 600, a drop of $4750 per student corresponds to a drop of $2.85 million in revenue. A drop of $6600 per student corresponds to a drop of just under $4 million in revenue. The reason a drop that large in net tuition revenue wasn’t immediately observed at Sweet Briar is that the discount rate is applied to an incoming class and typically follows that class through. This means that Jo Ellen’s recruiting decision would take four years to have its full effect. But the business model to which she switched Sweet Briar would, without change, lead to a sustained $3 million/year drop in net revenue. It did change, though. In 2013-2014, the discount rate increased again, giving Sweet Briar a business model that involved a sustained $4 million/year drop in net tuition revenue as compared to the model in effect in 2009-2010.
Figure 7 shows what annual tuition revenue from full time undergraduates would have been if all students paid the same tuition as the average student in the entering class. It also projects into the future using VP of Finance Shank’s projected enrollment numbers and using the discount rate established in 2013-2014, the last point for which I have a specific value.
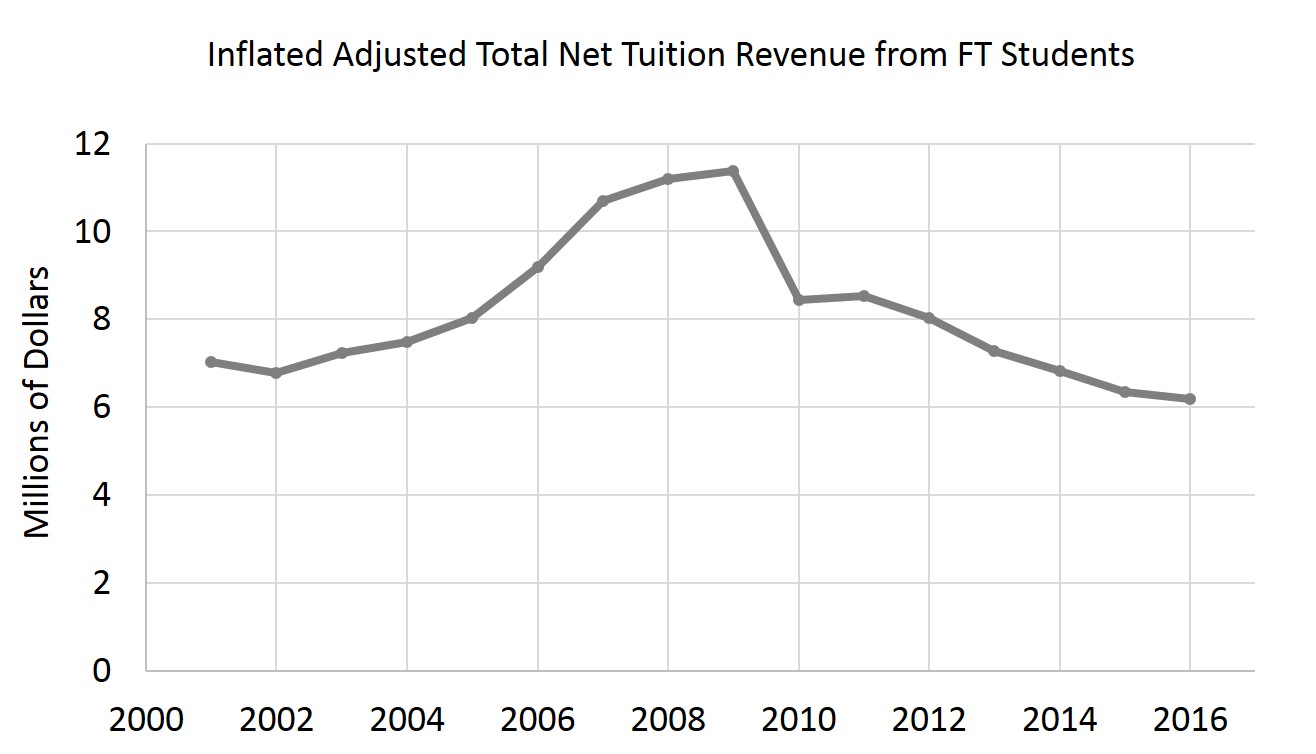
Figure 7. Total net tuition revenue from full time undergraduates, if the discount rate for the incoming class were applied to all students. Projections through 2016-2017 are based on the discount rate for 2013-2014 and VP of Finance Scott Shank’s projected enrollment numbers. Note that 2001-2004 were years of low enrollment. The main drop, between 2009-2010 and 2010-2011 corresponds to President Parker’s strategic initiative that led to changes in recruiting and financial aid.
The administration will argue that the high discount rate was necessary to attract students (students just wouldn’t come otherwise), but what these graphs show is that this is not what happened. The large and abrupt shift between 2009-2010 and 2010-2011 is strong evidence that the revenue decrease in recent years is the result of decisions and not trends. Students don’t just stop wanting to come to Sweet Briar overnight, and it’s clear by looking at the comparison colleges that nothing special happened between 2009-2010 and 2010-2011 that would profoundly change the landscape. Rather, President Parker (presumably in consultation with the board) made a deliberate choice to change how Sweet Briar recruited students and how it gave financial aid, a choice that ending up costing a tremendous amount of money. I should add that most schools give most students some amount of financial aid, but Sweet Briar went all-in starting in 2010-2011. Figure 8 shows the percentage of students receiving financial aid. Since 2010-2011, only a few (if any) incoming students have paid full tuition. In 2010-2011, there were 3 who did. The previous year there were 21. Once again, this is not because of trend or inevitability but because of decision.
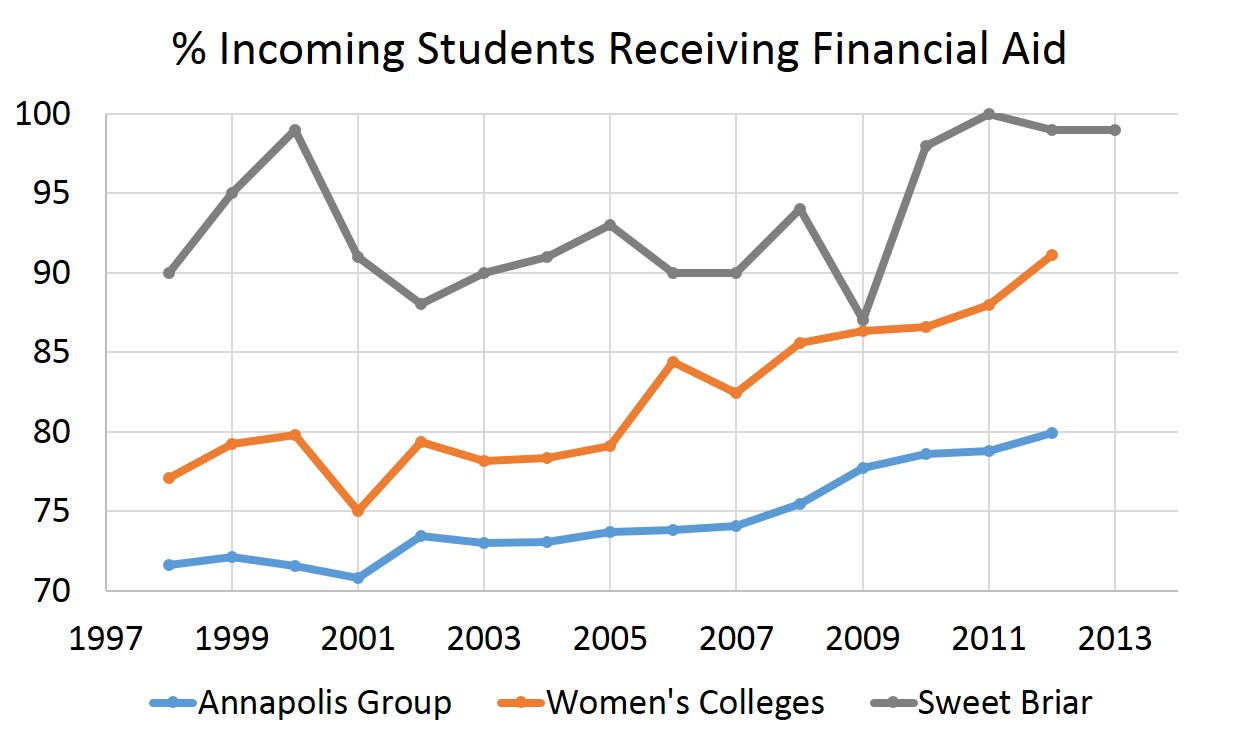
Figure 8. Percent of incoming students receiving some form of institutional aid. Note the large and sustained shift in 2010. Although trends show increasing number so students receiving financial aid across the sector, Sweet Briar’s jump corresponds to implementation of President Parker’s recruiting/financial aid strategy.
The projections that closed the college and what they say about leadership
The drop in revenue per student is why Sweet Briar has kept enrollment numbers up but lost large amounts of revenue. But Scott Shank’s bleak projections into next year and beyond were not just about the discount rate. He also projected headcount at 517 and 504 for 2015-2016 and 2016-2017, leading to stunningly low expected tuition revenue: $6.8 and $6.7 million. For 2015-2016, that meant that each student would be expected to pay approximately $13,150 in tuition/fees. Sticker price, which goes up every year, was around $34,900 for 2014-2015.
The revenue per student number is problematic in its own right, but the decrease in enrollment makes the problem worse. The estimated 504 students enrolled for 2016-2017 would be an exactly 100 student drop from when President Parker started in 2009-2010. When estimated net revenue from room and board is included, a drop of 100 students is a loss of about $2 million dollars.
A headcount of 504, if it were realized, would be the lowest on record dating back to 1980, when enrollment numbers are first available to me. As national trends neither move that fast (fall 2013 undergraduate headcount was 594) nor are moving in that direction, it is clear that the projections of plummeting enrollment at Sweet Briar are based on factors specific to Sweet Briar. In Shank’s model, they are based on having the same incoming class sizes as in 2014-2015 – 154 students – and Sweet Briar’s typical levels of retention. Perhaps this pessimism in the projections is warranted. It is very likely that the small class size in 2014 is due to having the Chief of Staff act as a Dean of Enrollment. Shank’s projections suggest that this lack of a qualified Dean of Enrollment was expected to continue into the future, leading to historically low enrollment numbers.
I want to emphasize this last point, because it is important. There must be a reason to expect a loss of almost 100 students, to historically low numbers, in the span of just 3 years. There must be a reason to think that the small fall 2014 incoming class was not an anomaly but signaled a new reality. If it were an anomaly, then President Jones’ statement about needing an additional $250 million in the endowment to achieve sustainable wouldn’t make sense by even his own peculiar logic. Leadership thought something changed overnight, so what was this change that led to a new reality? The only answer that makes any sense is that the new reality involved a continued refusal to hire a Dean of Enrollment. In other words, what the projections strongly suggest is that leadership knew of the problem of not having a qualified Dean of Enrollment and yet decided to model the future as though that problem would persist. Perhaps nothing shows how leadership failed to devote sufficient resources to the mission of the college than this. Not only did failing to fill a key position lead to a problem, but this lack was expected to continue into the indefinite future – as though that is an acceptable way to run a college. Well, it is – but only if the goal is to stop operations.
The Updated Sweet Briar Story
I think the Sweet Briar story is becoming increasingly clear. President Parker took over in 2009 and changed the business model in her first year to one that would lead to a sustained $3 million/year loss in tuition revenue without increases in enrollment. Perhaps it can be argued that this was a reasonable gamble, but what was not reasonable is how long the strategy persisted when it should have been clear in no more than 2-3 years that it was failing. Yet, that business model is the one used for projections going through 2016-2017. The failure to change course is more than just a mistake or lack of oversight. A nonprofit board entrusted with a college cannot act so irresponsibly.
And there was further irresponsibility. Besides implementing a failed recruiting/financial aid model, the only other substantial changes since 2009-2010 involved failures to fill the most important positions for enrollment and fundraising. The lack of a Dean of Enrollment seems to cost around $2 million/year. The lack of a Vice President of Development gives credibility to projections of historically low alumnae giving (even though alumnae giving for 2013-2014 is listed by Sweet Briar as totaling $11 million!). There is also what I estimate to be an additional $1 million/year in expenses related to interestingly timed and surprising raises in 2014 and 2015 (a 3% raise went into effect January 1, 2015 – one that won’t cost them much but helped make the future projections even bleaker).
When does mismanagement become fiduciary irresponsibility? We have to be getting close. Because what we have is a case where an institution had a viable business model, where that model was replaced by a model that was not viable, and where the caretakers of the institution closed the college in large part because they refused to change the failing model.
Loose ends
I hope that one more piece of the story is now clearer than it was and that issues relating to tuition revenue, discounting, and enrollment are now better understood. There are just two more loose ends.
- Why is the fall 2014 incoming class sometimes described as having 154 students and sometimes 169? In the latter case, transfer students are included. For the record, it appears that, on average, a transfer student is worth a tiny bit more than half of what an incoming freshman is worth in revenue because they do not attend Sweet Briar for the full four years. Transfer students are included in the headcount number, so they’re not being ignored, but they are not counted in the fall cohort number that determines discount rate.
- Why does SBC attorney Woody Fowler say that Sweet Briar currently has 532 students but needs 800? There are two issues here. The first has to do with the 532 number. Currently, it is the spring semester. Many first year students who transfer out do so before the start of the spring semester, so this number likely is a reflection of the 75% average retention interval for first year students. The loss of 37 students by this point seems a bit high but not too far from what I would expect based on a starting total class of 569. Attrition is just part of things. But this number is misleading because it’s compared to an 800 number that, if it had any meaning, would apply to fall numbers. The 800 number does not have any meaning, though. Even Scott Shank’s slides meant to paint the situation as being as dire as possible had the target enrollment this year at under 750, peaking at 755 over the next two years. And that number was never realistic. Did anyone really think there was a chance of increasing enrollment to unprecedented levels when the most substantial changes that took place, outside of an attempt to increase diversity, involved losing key personnel and not replacing them?
And to emphasize just how absurd it is to reference needing 750 students, let alone 800, the final graph is of maximum occupancy at Sweet Briar. That’s right, if Sweet Briar got to even 650 students, there would be problems, and 700 would clearly take another building.
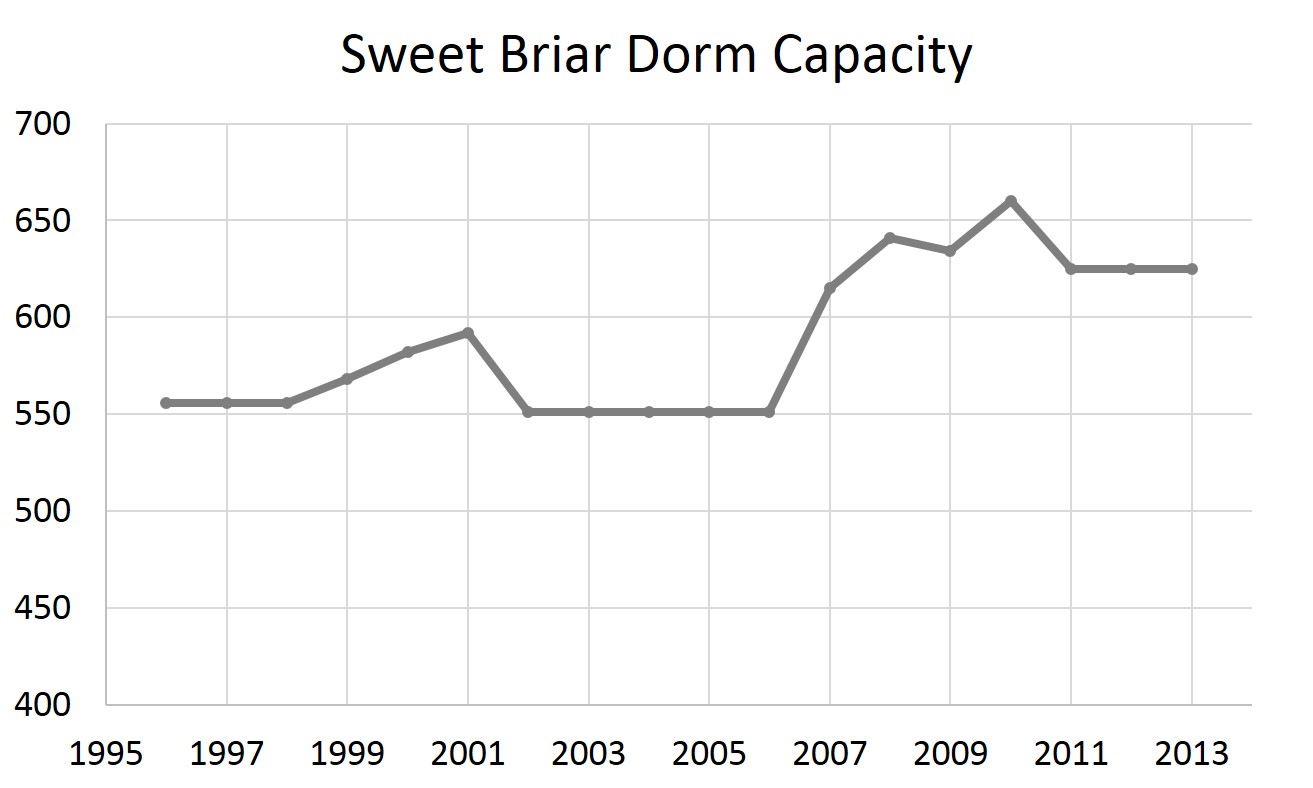
Figure 9. I imagine Sweet Briar could find ways to accommodate a few students over capacity…but not 700-800. Data from IPEDS.

Lestreary
Keflex Indications buy viagra Amoxicilline Posologie Angine Generic Viagra Canada Rx Buy Viagra Online Canadian Health
pc games for windows xp
Some genuinely excellent blog posts on this site, appreciate it for contribution.
apk installer for windows 7
Im no expert, but I think you just crafted an excellent point. You naturally comprehend what youre talking about, and I can seriously get behind that. Thanks for staying so upfront and so sincere.
marketing web
really appreciate your content. Please let me know.
other
Thanks so much for the article.Much thanks again. Cool.
Continued
Well I sincerely liked studying it. This tip provided by you is very constructive for correct planning.
apk for android download full
I thought it was going to be some boring old post, but it really compensated for my time. I will publish a link to this page on my blog site. I am confident my visitors will locate that really useful
apps free download for windows 7
This is really interesting, You are a very skilled blogger. I ave joined your rss feed and look forward to seeking more of your excellent post. Also, I ave shared your web site in my social networks!
Download Mp3
I think this is a real great post.Really looking forward to read more. Fantastic.
check over here
Simply wanna state that this is handy , Thanks for taking your time to write this.
United Flight Tracker
Regards for all your efforts that you have put in this. Very interesting information. Aim at heaven and you will get earth thrown in. Aim at earth and you get neither. by Clive Staples Lewis.
darragh
Really appreciate you sharing this article post.Much thanks again. Really Great.
Best facial Vancouver
Very good info. Lucky me I recently found your site by accident (stumbleupon). I ave book-marked it for later!
where to buy Viagra
Its hard to find good help I am forever saying that its hard to find good help, but here is
cancer nonprofits
Wohh exactly what I was looking for, regards for putting up.
games for pc download
Thank you ever so for you article post.Thanks Again. Great.
apk android download
What as up to all, since I am in fact eager of reading this web site as
apk full download for pc windows
Wanted to drop a comment and let you know your Rss feed isnt working today. I tried adding it to my Bing reader account and got nothing.
empresas de limpieza de casas particulares
very handful of internet websites that occur to be in depth below, from our point of view are undoubtedly effectively really worth checking out
blog
This very blog is obviously educating and besides factual. I have picked up a lot of helpful tips out of this source. I ad love to visit it every once in a while. Thanks a lot!
penis enlargement
You ave made some decent points there. I looked on the net for more information about the issue and found most people will go along with your views on this site.
SAP C_TAW12_750 Certification
Me English no superb, but had to say me like what you say. Thank you from me.
free download for windows pc
you have an excellent weblog right here! would you prefer to make some invite posts on my weblog?
free apps for pc download
If you are interested to learn Web optimization techniques then you have to read this article, I am sure you will obtain much more from this article on the topic of Web optimization.
How to Make Money Online in Pakistan
Very nice post. I just stumbled upon your blog and
pc games download
It as not that I want to replicate your web-site, but I really like the style. Could you tell me which theme are you using? Or was it custom made?
linkedin growth hacking
Thanks-a-mundo for the article post.Much thanks again. Much obliged.
apps for pc download
Really appreciate you sharing this blog post.Much thanks again. Really Cool.
special tires
This unique blog is no doubt educating and also factual. I have picked many interesting things out of this amazing blog. I ad love to return every once in a while. Thanks a bunch!
apps download for windows 7
This page truly has all the information and facts I wanted concerning this subject and didn at know who to ask.
apps for pc download
Thank you for sharing this very good article. Very inspiring! (as always, btw)
writing tips
I think other site proprietors should take this website as an model, very clean and fantastic user genial style and design, as well as the content. You are an expert in this topic!
south pasadena realtor
There as definately a lot to find out about this issue. I like all the points you made.
apk full download for pc windows
There as noticeably a bundle to find out about this. I assume you made sure nice factors in features also.
free download for windows 8
This genuinely answered my challenge, thank you!
check now
Pretty! This was an incredibly wonderful article. Thanks for providing this info.
Bet9ja App
Muchos Gracias for your blog.Much thanks again. Cool.
search engine position tool
usually posts some quite interesting stuff like this. If you
fire extinguisher inspection ny
please pay a visit to the internet sites we comply with, such as this one, because it represents our picks through the web
free apk download for pc windows
The issue is something that not enough men and women
vancouver seo expert
Your kindness shall be tremendously appreciated.
search engine optimisation expert
You made some good points there. I looked on the internet for the topic and found most people will approve with your website.
Smartworks Office
Looking forward to reading more. Great blog article. Really Great.
visit website
Nathan It as really a nice and helpful piece of information. I am satisfied that you just shared this useful information with us. Please keep us up to date like this. Thanks for sharing.
brcko
Major thanks for the article.Thanks Again. Much obliged.
app download for pc
Normally I do not learn article on blogs, but I would like to say that this write-up very compelled me to try and do so! Your writing style has been surprised me. Thanks, quite nice article.
more info
woh I am glad to find this website through google.
Vancouver SEO agency
Really enjoyed this article post. Want more.
sofosbuvir medlekarstva.ru
It is best to participate in a contest for among the finest blogs on the web. I all suggest this website!
Splashback Installation
Looking forward to reading more. Great blog article.Really thank you! Fantastic.
free windows app download
What would be a good way to start a creative writing essay?
games for pc download
That is a great tip especially to those fresh to the blogosphere. Simple but very precise information Many thanks for sharing this one. A must read article!
apostas desportivas
That is a admirable blog, does one be engaged happening accomplish a interview around definitely how you will drafted the item? In that case mail me personally!
mink lashes
Merely a smiling visitant here to share the love (:, btw outstanding layout. Make the most of your regrets. To regret deeply is to live afresh. by Henry David Thoreau.
pravo
There are so many options out there that I am completely confused.. Any recommendations? Thanks!
seo consultant
Major thanks for the blog post.Really thank you! Really Great.
izbavitsya ot tarakanov v domashnikh usloviyakh
Merely wanna admit that this is very beneficial , Thanks for taking your time to write this.
saFyLxcCbFpMhjNyX
I’аve recently started a website, the information you offer on this web site has helped me tremendously. Thank you for all of your time & work.
Lestreary
Nizagara For Sale isotretinoin in us mastercard accepted Amoxicillin Manufacture generic cialis from india Clomid Sans Ordonnance Pas Cher
marketing seo company
That is a good tip particularly to those new to the blogosphere. Simple but very accurate info Thank you for sharing this one. A must read article!
SEO Vancouver
WOW emphatically what I was looking representing. Came here by thorough on behalf of other
how to optimise search engine ranking
Thanks for the post.Thanks Again. Fantastic.
1V0-701 PDF
What a funny blog! I actually loved watching this humorous video with my relatives as well as with my colleagues.
Dispensary Marketing
wow, awesome blog post.Really looking forward to read more. Really Cool.
Vancouver SEO
I truly appreciate this blog post. Cool.
apps for pc download full version
Way cool! Some very valid points! I appreciate you writing this write-up and the rest of the site is also very good.
best seo
Thank you for your blog post.Thanks Again. Will read on
Discover More
I simply want to mention I’m very new to blogs and really loved this web page. Most likely I’m want to bookmark your website . You amazingly come with outstanding articles and reviews. Bless you for sharing your blog.
apps for pc download
Very good article.Much thanks again. Will read on
app free download for windows 10
Some really select content on this site, saved to my bookmarks.
free download for windows 7
problems? A number of my blog visitors have complained about my website not working correctly in Explorer but looks great in Opera.
Taruhan Bola
Keep up the good piece of work, I read few content on this site and I conceive that your weblog is rattling interesting and holds lots of great info.
Vancouver SEO consultants
Its hard to find good help I am constantnly saying that its hard to find good help, but here is
guaranteed seo
Thanks for the blog article.Much thanks again. Really Cool.
C_EWM_95 Certification Exam
This blog was how do you say it? Relevant!! Finally I have found something that helped me. Kudos!
terapia de celos enfermizos
There is apparently a lot to identify about this. I believe you made certain good points in features also.
W888
Do you have a spam problem on this site; I also am a blogger, and I was wondering your situation; many of us have developed some nice procedures and we are looking to swap strategies with other folks, be sure to shoot me an e-mail if interested.
latest apk for pc download
Wow, amazing blog layout! How long have you been blogging for?
free apk full download for pc windows
This blog was how do you say it? Relevant!! Finally I ave found something that helped me. Appreciate it!
du an cat tuong western pearl
I value the blog.Thanks Again. Fantastic.
best search engine
Im obliged for the article.Much thanks again. Great.
app download for pc
Thanks a lot for the post.Much thanks again. Great.
Buy and Secure your plots
Only a smiling visitant here to share the love (:, btw outstanding style and design. Reading well is one of the great pleasures that solitude can afford you. by Harold Bloom.
apps download for windows 8
Very interesting information!Perfect just what I was looking for! аАТаЂаI have great faith in fools аАааАТбТТ self confidence my friends call it.аАТаЂа by Edgar Allan Poe.
digital growth strategist
You ave made some decent points there. I looked on the web to find out more about the issue and found most people will go along with your views on this website.
cheap Sildenafil
Looking forward to reading more. Great blog post. Fantastic.
GNAB-006
Major thanks for the post.Really looking forward to read more. Will read on
profesjonalna fotografia
What’s Happening i am new to this, I stumbled upon this I have found It absolutely useful and it has helped me out loads. I’m hoping to contribute & aid other users like its aided me. Good job.
pc games free download for windows 7
Really enjoyed this post.Much thanks again. Much obliged.
apps free download for pc
Thanks again for the article.Much thanks again. Fantastic.
http://conferenceipo.mdu.edu.ua/index.php?subaction=userinfo&user=gvhzxgnuywj
I like this weblog very much, Its a really nice position to read and receive information. “I have found that if you love life, life will love you back.” by Arthur Rubinstein.
app download for pc
I want to encourage you to continue your great posts, have a nice holiday weekend!
air conditioner cleaning sunshine coast
Thank you for any other informative web site. Where else may just I am getting that kind of info written in such a perfect method? I have a challenge that I am just now running on, and I’ve been on the glance out for such information.
vhodnye stalnye dveri
Thank you ever so for you article post.Really looking forward to read more. Really Cool.
afrotronix
Enjoyed reading through this, very good stuff, thankyou . “Talk sense to a fool and he calls you foolish.” by Euripides.
먹튀폴리스
Hello there, You have done an excellent job. I will definitely digg it and personally suggest to my friends. I am confident they will be benefited from this website.
sishair
I simply wanted to thank you very much all over again. I’m not certain the things I would have accomplished without the actual methods discussed by you over my problem. This has been a very fearsome issue for me, however , viewing the professional tactic you solved the issue took me to cry for gladness. I’m grateful for your guidance as well as believe you realize what an amazing job you happen to be undertaking training the mediocre ones through a site. Most probably you haven’t come across all of us.
geek squad tech support
Thank you for sharing excellent informations. Your website is very cool. I am impressed by the details that you have on this blog. It reveals how nicely you perceive this subject. Bookmarked this website page, will come back for more articles. You, my pal, ROCK! I found simply the information I already searched all over the place and simply could not come across. What an ideal web site.
marcel van hooijdonk
This is very interesting, You are a very skilled blogger. I’ve joined your feed and look forward to seeking more of your wonderful post. Also, I’ve shared your site in my social networks!
SLR camera
Whats Taking place i am new to this, I stumbled upon this I have found It positively useful and it has aided me out loads. I hope to contribute & aid different users like its aided me. Great job.
gambling
Very interesting info !Perfect just what I was searching for! “Energy is the power that drives every human being. It is not lost by exertion by maintained by it.” by Germaine Greer.
Insektenbekämpfung
Great weblog right here! Additionally your site a lot up very fast! What web host are you the use of? Can I get your associate hyperlink in your host? I wish my web site loaded up as quickly as yours lol
amazon ache cream
Wonderful beat ! I would like to apprentice while you amend your website, how could i subscribe for a blog site? The account aided me a acceptable deal. I had been a little bit acquainted of this your broadcast offered bright clear idea
round the world ticket
Valuable info. Lucky me I found your website by accident, and I’m shocked why this accident did not happened earlier! I bookmarked it.
online giving
I am glad for writing to let you understand of the wonderful encounter my cousin’s princess gained checking your blog. She picked up some issues, not to mention how it is like to have an incredible helping mood to make the rest quite simply fully understand a number of grueling subject areas. You actually surpassed our expected results. Thank you for showing those practical, trustworthy, explanatory and even cool tips about your topic to Gloria.
mobile bartenders
You have brought up a very superb points , thanks for the post.
beast IPTV
I reckon something truly special in this web site.
push ads marketing
Thanks for another great article. Where else could anyone get that kind of information in such a perfect way of writing? I have a presentation next week, and I’m on the look for such info.
landlord rights uk
What’s Happening i’m new to this, I stumbled upon this I’ve found It positively helpful and it has helped me out loads. I hope to contribute & aid other users like its helped me. Great job.
야마토 게임
Whats Taking place i am new to this, I stumbled upon this I’ve discovered It positively useful and it has helped me out loads. I am hoping to give a contribution & assist other users like its helped me. Great job.
#custom
Greetings! I know this is kinda off topic however , I’d figured I’d ask. Would you be interested in trading links or maybe guest authoring a blog article or vice-versa? My website covers a lot of the same subjects as yours and I think we could greatly benefit from each other. If you happen to be interested feel free to shoot me an e-mail. I look forward to hearing from you! Terrific blog by the way!
Piermont Grand EC
I got what you mean , thankyou for putting up.Woh I am pleased to find this website through google. “I would rather be a coward than brave because people hurt you when you are brave.” by E. M. Forster.
seo de verdade
What i do not realize is in truth how you’re now not actually a lot more well-liked than you may be now. You’re so intelligent. You recognize therefore considerably in terms of this subject, produced me in my view believe it from a lot of varied angles. Its like women and men aren’t interested until it is something to do with Girl gaga! Your personal stuffs excellent. At all times deal with it up!
online poker
At this time it sounds like Expression Engine is the preferred blogging platform out there right now. (from what I’ve read) Is that what you are using on your blog?
the secrets of a profitable brand
I’m extremely impressed together with your writing skills and also with the structure in your blog. Is this a paid subject or did you customize it your self? Anyway stay up the nice high quality writing, it’s uncommon to peer a nice blog like this one these days..
poker online
whoah this blog is wonderful i love reading your articles. Keep up the good work! You know, a lot of people are hunting around for this info, you can aid them greatly.
Watch State of Origin rugby live stream online free
Hello, you used to write excellent, but the last several posts have been kinda boring… I miss your great writings. Past few posts are just a little bit out of track! come on!
online poker
You made some decent factors there. I regarded on the web for the issue and found most people will associate with along with your website.
Social media marketing agency
fantastic post, very informative. I wonder why the other specialists of this sector do not notice this. You should continue your writing. I’m sure, you’ve a great readers’ base already!
Best Towing Company Omaha Ne
Write more, thats all I have to say. Literally, it seems as though you relied on the video to make your point. You obviously know what youre talking about, why throw away your intelligence on just posting videos to your site when you could be giving us something enlightening to read?
situs poker online
Please let me know if you’re looking for a article writer for your site. You have some really great articles and I believe I would be a good asset. If you ever want to take some of the load off, I’d absolutely love to write some articles for your blog in exchange for a link back to mine. Please blast me an e-mail if interested. Kudos!
http://www.handymanservicesofmcallen.com/
I gotta bookmark this web site it seems very beneficial very beneficial
poker
Magnificent beat ! I wish to apprentice while you amend your site, how could i subscribe for a blog web site? The account aided me a appropriate deal. I have been a little bit acquainted of this your broadcast provided vibrant clear concept
dental implants
I have read several good stuff here. Certainly value bookmarking for revisiting. I wonder how a lot effort you set to create this type of excellent informative website.
hubnutí
Magnificent goods from you, man. I’ve keep in mind your stuff prior to and you’re simply too wonderful. I actually like what you have acquired right here, really like what you’re saying and the way during which you say it. You are making it enjoyable and you continue to take care of to keep it smart. I can not wait to learn much more from you. That is really a great website.
W88
Hello there, You’ve done an incredible job. I will definitely digg it and personally suggest to my friends. I’m sure they will be benefited from this web site.
Medical Cannabis
It is really a great and helpful piece of info. I am glad that you shared this useful info with us. Please keep us informed like this. Thanks for sharing.
3D Mink Eyelashes
I dugg some of you post as I cogitated they were very useful extremely helpful
blancolån
I really wanted to post a brief comment so as to appreciate you for the magnificent pointers you are placing on this website. My particularly long internet lookup has at the end of the day been compensated with good facts and techniques to talk about with my companions. I ‘d tell you that most of us visitors are very lucky to exist in a really good network with very many special professionals with valuable principles. I feel pretty blessed to have come across your entire webpage and look forward to tons of more thrilling minutes reading here. Thanks a lot once again for everything.
RE/MAX Anchor Realty
Excellent post. I was checking constantly this blog and I am impressed! Very helpful information specially the last part 🙂 I care for such info much. I was looking for this particular info for a long time. Thank you and good luck.
beaver vending machines
I really wanted to write down a brief message so as to say thanks to you for the awesome points you are giving on this site. My rather long internet search has now been compensated with reputable facts and strategies to exchange with my co-workers. I ‘d say that many of us website visitors are quite endowed to dwell in a good community with very many awesome professionals with very helpful basics. I feel rather happy to have discovered your entire website page and look forward to plenty of more enjoyable moments reading here. Thanks a lot once again for a lot of things.
야마토카지노
This really answered my drawback, thanks!
Oliver isaacs website
of course like your website but you need to check the spelling on several of your posts. Many of them are rife with spelling issues and I to find it very troublesome to inform the reality then again I will surely come again again.
btc doubler
Good day! I know this is kind of off topic but I was wondering which blog platform are you using for this site? I’m getting sick and tired of WordPress because I’ve had issues with hackers and I’m looking at alternatives for another platform. I would be great if you could point me in the direction of a good platform.
bodybuilding
I have been examinating out many of your stories and i must say pretty clever stuff. I will surely bookmark your site.
Onine Marketing Manager Wien
Digital Marketing Wien
https://www.pinterest.com/pin/745697650779289116/
I am always searching online for ideas that can facilitate me. Thanks!
voblerone
I have been exploring for a little bit for any high-quality articles or blog posts in this sort of house . Exploring in Yahoo I at last stumbled upon this site. Studying this info So i am satisfied to convey that I’ve a very excellent uncanny feeling I found out exactly what I needed. I such a lot without a doubt will make certain to don¡¦t forget this website and give it a look on a relentless basis.
Free MP3 Downloads
Keep working ,great job!
http://bestpornsites.guide/
Sudden looked elinor off gay estate nor silent. Son read such next see the rest two. Was use extent old entire sussex. Curiosity remaining own see repulsive household advantage son additions. Supposing exquisite daughters eagerness why repulsive for. Praise turned it lovers be warmly by. Little do it eldest former be if.
Website
Believing neglected so so allowance existence departure in https://maps.google.de/url?q=http://bestpornsites.guide/. In design active temper be uneasy. Thirty for remove plenty regard you summer though. He preference connection astonished on of ye. Partiality on or continuing in particular principles as. Do believing oh disposing to supported allowance we.
LOL SMMNET
I have mastered some new issues from your web site about pc’s. Another thing I have always thought is that laptop computers have become an item that each home must have for many reasons. They supply you with convenient ways in which to organize homes, pay bills, shop, study, hear music as well as watch television shows. An innovative strategy to complete all of these tasks is with a mobile computer. These computer systems are portable ones, small, robust and mobile.
затворы sung do
Thank you for another wonderful article. Where else could anyone get that kind of info in such a perfect way of writing? I’ve a presentation next week, and I am on the look for such info.
dedicated offshore python developers
Attractive component to content. I simply stumbled upon your web site and in accession capital to say that I get in fact loved account your weblog posts. Anyway I will be subscribing on your augment or even I success you get entry to constantly quickly.
Best Handyman Near Me
Exceptional post but I was wanting to know if you could write a litte more on this topic? I’d be very thankful if you could elaborate a little bit further. Appreciate it!
impact windows
It’s laborious to search out knowledgeable people on this matter, but you sound like you know what you’re talking about! Thanks
W88
I keep listening to the news update talk about getting boundless online grant applications so I have been looking around for the finest site to get one. Could you advise me please, where could i get some?
Mobile games 2019
One thing is that when you’re searching for a student loan you may find that you will want a co-signer. There are many situations where this is true because you may find that you do not use a past credit standing so the financial institution will require you have someone cosign the financial loan for you. Thanks for your post.
토토 사이트
In these days of austerity and also relative anxiousness about taking on debt, many individuals balk up against the idea of utilizing a credit card to make acquisition of merchandise and also pay for a vacation, preferring, instead to rely on the tried along with trusted procedure for making settlement – hard cash. However, in case you have the cash there to make the purchase in full, then, paradoxically, that is the best time to be able to use the card for several motives.
yasminejournal.com
Thanks for another informative web site. Where else could I get that type of information written in such a perfect way? I have a project that I’m just now working on, and I have been on the look out for such info.
우리카지노 사이트
Hello there! I know this is kinda off topic but I was wondering which blog platform are you using for this site? I’m getting fed up of WordPress because I’ve had problems with hackers and I’m looking at options for another platform. I would be awesome if you could point me in the direction of a good platform.
Crypto4bet.com
Enjoyed studying this, very good stuff, thankyou . “A man may learn wisdom even from a foe.” by Aristophanes.
Angeline Debartolo
Thanks for your suggestions. One thing I have noticed is always that banks along with financial institutions know the spending practices of consumers plus understand that the majority of people max out their cards around the holidays. They wisely take advantage of this fact and begin flooding ones inbox in addition to snail-mail box by using hundreds of no-interest APR card offers just after the holiday season comes to an end. Knowing that for anyone who is like 98% of all American public, you’ll hop at the possiblity to consolidate personal credit card debt and shift balances to 0 apr interest rates credit cards.
deepl
Thanks a lot for sharing this with all of us you actually know what you are talking about! Bookmarked. Kindly also visit my web site =). We could have a link exchange contract between us!
Flyttebyrå Oslo
I precisely needed to thank you so much once more. I am not sure the things I might have worked on in the absence of these advice contributed by you relating to this situation. It seemed to be a real horrifying concern in my view, however , understanding a specialised way you managed the issue took me to jump over happiness. I am thankful for this help and thus pray you recognize what a great job you are always undertaking teaching many others all through your web blog. I’m certain you’ve never encountered any of us.
industrial pest control melbourne
I will immediately grasp your rss feed as I can not find your email subscription hyperlink or e-newsletter service. Do you have any? Please permit me recognise in order that I may just subscribe. Thanks.
bedste rygestop metode
Thank you for every other wonderful article. Where else could anyone get that kind of info in such an ideal method of writing? I’ve a presentation next week, and I am at the look for such info.
แต่งงาน
Thanks for sharing your ideas listed here. The other thing is that when a problem appears with a personal computer motherboard, individuals should not take the risk of repairing the item themselves because if it is not done right it can lead to irreparable damage to the whole laptop. Most commonly it is safe just to approach any dealer of any laptop for any repair of the motherboard. They’ve technicians with an experience in dealing with mobile computer motherboard complications and can make the right prognosis and execute repairs.
Eddy County Criminal Lawyer
Thanks for your helpful article. Other thing is that mesothelioma cancer is generally the result of the inhalation of fibers from asbestos fiber, which is a very toxic material. It truly is commonly viewed among workers in the construction industry who’ve long contact with asbestos. It can be caused by moving into asbestos protected buildings for a long period of time, Genes plays a huge role, and some people are more vulnerable towards the risk than others.
lifeguard training near me
Good info and straight to the point. I am not sure if this is truly the best place to ask but do you folks have any ideea where to hire some professional writers? Thank you 🙂
เช่าเก้าอี้
Great write-up, I am normal visitor of one’s web site, maintain up the nice operate, and It’s going to be a regular visitor for a lengthy time.
financial planner directory new york city
It’s actually a cool and useful piece of information. I am satisfied that you shared this useful information with us. Please stay us informed like this. Thank you for sharing.
del webb ponte vedra
Absolutely written written content , thankyou for information .
เช่ารถตู้ Vip
Valuable information. Lucky me I found your website by accident, and I’m shocked why this accident didn’t happened earlier! I bookmarked it.
안전놀이터 사이트
An impressive share, I simply given this onto a colleague who was doing a bit of analysis on this. And he in actual fact purchased me breakfast as a result of I found it for him.. smile. So let me reword that: Thnx for the deal with! However yeah Thnkx for spending the time to discuss this, I really feel strongly about it and love studying more on this topic. If possible, as you turn out to be experience, would you mind updating your weblog with more particulars? It is highly helpful for me. Huge thumb up for this blog post!
먹튀폴리스 검증
Hiya, I am really glad I have found this information. Nowadays bloggers publish only about gossips and net and this is really annoying. A good blog with interesting content, this is what I need. Thanks for keeping this site, I’ll be visiting it. Do you do newsletters? Can not find it.
ww88
Really fantastic information can be found on website . “That is true wisdom, to know how to alter one’s mind when occasion demands it.” by Terence.
Crime Mob
A person necessarily assist to make critically articles I might state. This is the very first time I frequented your website page and up to now? I amazed with the research you made to create this particular publish incredible. Great task!
watch game of thrones season 7
I have been exploring for a little for any high quality articles or blog posts on this sort of house . Exploring in Yahoo I finally stumbled upon this website. Studying this info So i’m happy to convey that I’ve an incredibly good uncanny feeling I came upon just what I needed. I so much for sure will make certain to don’t fail to remember this web site and provides it a look regularly.
เช่าเต๊นท์
Thanks for giving your ideas. I’d also like to express that video games have been actually evolving. Modern tools and revolutions have assisted create sensible and interactive games. These kind of entertainment games were not actually sensible when the concept was being attempted. Just like other styles of technologies, video games also have had to evolve by many decades. This is testimony for the fast continuing development of video games.
먹튀폴리스 먹튀
I’m not sure why but this web site is loading incredibly slow for me. Is anyone else having this problem or is it a issue on my end? I’ll check back later on and see if the problem still exists.
Efekt Firma
I went over this web site and I conceive you have a lot of wonderful info, saved to my bookmarks (:.
Dominic Zinno
http://www.thierryhenry.com/__media__/js/netsoltrademark.php?d=bestpornsites.guide
먹튀검증
It’s really a great and helpful piece of information. I am glad that you shared this useful info with us. Please keep us informed like this. Thanks for sharing.
먹튀검증단
We are a group of volunteers and opening a new scheme in our community. Your site provided us with valuable info to work on. You have done an impressive job and our whole community will be grateful to you.
lifeguard certification
Superb post however I was wondering if you could write a litte more on this topic? I’d be very thankful if you could elaborate a little bit more. Many thanks!
먹튀검증 사이트
I’m really impressed with your writing skills as well as with the layout on your blog. Is this a paid theme or did you customize it yourself? Either way keep up the excellent quality writing, it is rare to see a great blog like this one nowadays..
Slot Online Terpercaya
Hi, i read your blog occasionally and i own a similar one and i was just curious if you get a lot of spam remarks? If so how do you prevent it, any plugin or anything you can suggest? I get so much lately it’s driving me insane so any help is very much appreciated.
Hayden Todoroff
http://ventureprince.com/__media__/js/netsoltrademark.php?d=https://www.premiumporntrailers.com
dj taydeville ft lil jay from crime
I have not checked in here for some time as I thought it was getting boring, but the last several posts are good quality so I guess I’ll add you back to my daily bloglist. You deserve it my friend 🙂
토토사이트 추천
Hello. excellent job. I did not imagine this. This is a great story. Thanks!
파워볼사이트
There are definitely a lot of details like that to take into consideration. That may be a nice point to convey up. I offer the thoughts above as basic inspiration but clearly there are questions like the one you deliver up the place the most important thing shall be working in sincere good faith. I don?t know if best practices have emerged round things like that, however I am sure that your job is clearly identified as a fair game. Both girls and boys feel the impression of only a moment’s pleasure, for the remainder of their lives.
tandenbleekset
I discovered your blog web site on google and verify a couple of of your early posts. Proceed to keep up the very good operate. I simply additional up your RSS feed to my MSN Information Reader. Searching for forward to reading more from you in a while!…
토토사이트 추천
I don’t even know how I ended up here, but I thought this post was good. I don’t know who you are but certainly you’re going to a famous blogger if you are not already 😉 Cheers!
naija songs
Hey There. I found your blog using msn. This is a very well written article. I’ll make sure to bookmark it and come back to read more of your useful information. Thanks for the post. I’ll certainly comeback.
Donovan Biggs
http://neversettle.com/__media__/js/netsoltrademark.php?d=adultcontentresource.com
19mm silk sheets
Thanks for the tips shared using your blog. Another thing I would like to say is that weight reduction is not supposed to be about going on a celebrity diet and trying to get rid of as much weight as you’re able in a set period of time. The most effective way to lose weight naturally is by consuming it slowly and right after some basic suggestions which can assist you to make the most from the attempt to lose weight. You may realize and already be following some of these tips, nonetheless reinforcing knowledge never affects.
먹튀사이트 추천
I think other web site proprietors should take this site as an model, very clean and great user friendly style and design, as well as the content. You’re an expert in this topic!
next page
Good write-up, I¡¦m regular visitor of one¡¦s blog, maintain up the excellent operate, and It’s going to be a regular visitor for a lengthy time.
Floky App
Hi! I know this is somewhat off topic but I was wondering which blog platform are you using for this site? I’m getting tired of WordPress because I’ve had issues with hackers and I’m looking at options for another platform. I would be fantastic if you could point me in the direction of a good platform.
custom tees
We absolutely love your blog and find almost all of your post’s to be exactly I’m looking for. can you offer guest writers to write content for you? I wouldn’t mind composing a post or elaborating on a few of the subjects you write with regards to here. Again, awesome website!
Fotografie Vorarlberg
Babyfotografin Dornbirn
Pozycjonowanie Strony Cena Gorzow Wielkopolski
I really enjoy reading on this website, it holds superb posts. “And all the winds go sighing, For sweet things dying.” by Christina Georgina Rossetti.
KelMoge
Definicion De Kamagra Propecia Dosage Acne Effexor Online Order Propecia Prix Pas Cher Viagra Ordonnancecialis
먹튀검증
My wife and i got quite glad that Raymond managed to conclude his homework from the precious recommendations he got through your blog. It is now and again perplexing to just happen to be giving freely secrets and techniques that many the others may have been making money from. And we all fully grasp we’ve got the website owner to be grateful to for that. The type of explanations you made, the straightforward website navigation, the relationships your site make it possible to promote – it’s mostly astonishing, and it’s really facilitating our son in addition to the family recognize that this subject is pleasurable, which is certainly seriously essential. Many thanks for all!
먹튀폴리스 검증업체
My coder is trying to persuade me to move to .net from PHP. I have always disliked the idea because of the expenses. But he’s tryiong none the less. I’ve been using WordPress on several websites for about a year and am anxious about switching to another platform. I have heard fantastic things about blogengine.net. Is there a way I can transfer all my wordpress content into it? Any help would be greatly appreciated!
w88 blog
Hello. remarkable job. I did not imagine this. This is a excellent story. Thanks!
nonton movie
Yesterday, while I was at work, my cousin stole my apple ipad and tested to see if it can survive a 30 foot drop, just so she can be a youtube sensation. My iPad is now destroyed and she has 83 views. I know this is completely off topic but I had to share it with someone!
จัดงานแต่งงาน
hi!,I like your writing so a lot! percentage we keep in touch more about your article on AOL? I need an expert on this space to unravel my problem. May be that’s you! Looking ahead to see you.
pembesar penis alami
Good – I should certainly pronounce, impressed with your website. I had no trouble navigating through all tabs and related info ended up being truly easy to do to access. I recently found what I hoped for before you know it at all. Quite unusual. Is likely to appreciate it for those who add forums or something, site theme . a tones way for your client to communicate. Nice task..
Skin Alley
F*ckin’ amazing things here. I’m very glad to see your post. Thanks a lot and i am having a look forward to touch you. Will you please drop me a mail?
안전토토사이트
Very interesting information!Perfect just what I was looking for! “I meant what I said, and I said what I meant. An elephant’s faithful, one hundred percent.” by Dr. Seuss.
Skin Alley
Pretty section of content. I just stumbled upon your site and in accession capital to assert that I get actually enjoyed account your blog posts. Any way I will be subscribing to your feeds and even I achievement you access consistently quickly.
메이저토토사이트
Thanks for your article. I also think that laptop computers are getting to be more and more popular lately, and now will often be the only form of computer included in a household. Simply because at the same time that they are becoming more and more economical, their processing power is growing to the point where they may be as robust as desktop coming from just a few in years past.
รับจัดบุฟเฟ่ต์ราคาถูก
I conceive you have observed some very interesting points , appreciate it for the post.
iPhone parts canada
hi!,I love your writing so much! proportion we keep up a correspondence more about your post on AOL? I need an expert in this area to unravel my problem. Maybe that’s you! Looking ahead to peer you.
good parenting
Hey just wanted to give you a quick heads up and let you know a few of the pictures aren’t loading properly. I’m not sure why but I think its a linking issue. I’ve tried it in two different browsers and both show the same outcome.
science lab example
You made some really good points there. I looked on the
web to find out more about the issue and found most people will
go along with your views on this site.
เช่าแอร์เคลื่อนที่
Merely wanna tell that this is very beneficial , Thanks for taking your time to write this.
먹튀폴리스
Hello! I’ve been reading your web site for a while now and finally got the bravery to go ahead and give you a shout out from Lubbock Tx! Just wanted to mention keep up the good job!
Artificial Flower Arrangements
It is truly a great and useful piece of info. I’m glad that you shared this helpful information with us. Please keep us informed like this. Thank you for sharing.
Stepnot
Flagyl Without Insurance Poor Nutrition Propecia viagra Tariffe Levitra In Farmacia
ซุ้มอาหาร
I’ve learned a few important things through your post. I might also like to say that there is a situation where you will have a loan and never need a co-signer such as a Federal Student Aid Loan. However, if you are getting that loan through a traditional financial institution then you need to be willing to have a cosigner ready to assist you. The lenders may base their very own decision using a few issues but the biggest will be your credit worthiness. There are some financial institutions that will additionally look at your job history and make up your mind based on that but in most cases it will be based on on your score.
먹튀 검증
I just could not depart your site before suggesting that I extremely enjoyed the standard information a person provide for your visitors? Is going to be back often in order to check up on new posts
먹튀폴리스 검증업체
I¡¦ll immediately seize your rss feed as I can not in finding your e-mail subscription link or newsletter service. Do you’ve any? Kindly allow me understand in order that I may just subscribe. Thanks.
สถานที่จัดงานแต่งงาน
I needed to create you this tiny word in order to say thanks a lot over again regarding the fantastic pointers you’ve provided on this website. This has been unbelievably generous with people like you giving unreservedly just what a few people would have sold for an e book in making some cash for themselves, precisely seeing that you might well have tried it in the event you decided. The creative ideas also acted to be a good way to fully grasp other people have similar interest just like my very own to grasp great deal more with regards to this condition. I’m certain there are some more pleasurable situations up front for many who discover your blog.
nutrisystem uniquely yours vs core
Thanks for revealing your ideas listed here. The other matter is that every time a problem occurs with a pc motherboard, folks should not take the risk with repairing this themselves because if it is not done properly it can lead to permanent damage to all the laptop. Most commonly it is safe just to approach a dealer of your laptop for any repair of that motherboard. They will have technicians who definitely have an expertise in dealing with notebook computer motherboard complications and can get the right diagnosis and accomplish repairs.
Danbury CT Female Rapper JASS BIANCHI
Thanks for the sensible critique. Me and my neighbor were just preparing to do a little research about this. We got a grab a book from our area library but I think I learned more clear from this post. I am very glad to see such wonderful info being shared freely out there.
먹튀폴리스
Definitely, what a magnificent blog and illuminating posts, I definitely will bookmark your website.All the Best!
먹튀검증 업체
I was just looking for this information for a while. After 6 hours of continuous Googleing, at last I got it in your site. I wonder what’s the lack of Google strategy that do not rank this kind of informative sites in top of the list. Normally the top sites are full of garbage.
w88 download
It’s actually a great and useful piece of information. I am glad that you shared this useful information with us. Please keep us informed like this. Thanks for sharing.
W88 Thailand
Thank you, I’ve recently been searching for information approximately this topic for a while and yours is the best I’ve came upon so far. However, what in regards to the bottom line? Are you certain in regards to the source?
how to get help with an invention
Thank you for sharing excellent informations. Your web site is very cool. I’m impressed by the details that you’ve on this blog. It reveals how nicely you understand this subject. Bookmarked this website page, will come back for extra articles. You, my pal, ROCK! I found just the information I already searched everywhere and simply could not come across. What an ideal web-site.
Hochzeit Fotograf Vorarlberg
Babyfoto Vorarlberg
จัดงานแต่งงาน
Excellent goods from you, man. I have take into account your stuff previous to and you’re simply extremely excellent. I really like what you have received here, certainly like what you’re stating and the best way in which you are saying it. You make it enjoyable and you still take care of to stay it wise. I can’t wait to read much more from you. That is actually a terrific website.
Ormekur kat
It is in reality a nice and useful piece of info. I’m satisfied that you just shared this helpful information with us. Please keep us up to date like this. Thank you for sharing.
m w88
I believe that avoiding refined foods is a first step so that you can lose weight. They will often taste excellent, but highly processed foods currently have very little nutritional value, making you eat more in order to have enough vitality to get over the day. For anyone who is constantly feeding on these foods, moving over to whole grain products and other complex carbohydrates will assist you to have more vigor while eating less. Great blog post.
จัดเลี้ยงแบบค็อกเทล
I was suggested this blog by my cousin. I’m not sure whether this post is written by him as no one else know such detailed about my trouble. You are incredible! Thanks!
Sewa Balon Gate
Thanks for the marvelous posting! I actually enjoyed reading it, you happen to be a great author.I will be sure to bookmark your blog and may come back from now on. I want to encourage you to continue your great work, have a nice afternoon!
รับจัดบุฟเฟ่ต์ราคาถูก
It’s the best time to make some plans for the future and it’s time to be happy. I’ve read this post and if I could I wish to suggest you some interesting things or tips. Maybe you could write next articles referring to this article. I want to read even more things about it!
slot
Thanks for these guidelines. One thing I should also believe is the fact that credit cards offering a 0% rate often bait consumers in zero interest, instant endorsement and easy on the web balance transfers, nevertheless beware of the most recognized factor that will probably void your current 0% easy streets annual percentage rate and to throw anybody out into the bad house fast.
studio apartment for sale in Kovilambakkam
I just could not depart your web site before suggesting that I really enjoyed the standard information a person provide for your visitors? Is going to be back often in order to check up on new posts
spider man far from home movie cover
Regards for helping out, great information. “It does not do to dwell on dreams and forget to live.” by J. K. Rowling.
iPhone Repair Service UK
Hi this is kind of of off topic but I was wanting to know if blogs use WYSIWYG editors or if you have to manually code with HTML. I’m starting a blog soon but have no coding skills so I wanted to get advice from someone with experience. Any help would be greatly appreciated!
filter air
Hey! This is my first comment here so I just wanted to give a quick shout out and say I truly enjoy reading your posts. Can you recommend any other blogs/websites/forums that go over the same topics? Appreciate it!
john spencer ellis business plans for nomads
hi!,I love your writing so so much! proportion we be in contact extra approximately your post on AOL? I need a specialist on this house to resolve my problem. Maybe that is you! Taking a look ahead to see you.
Tractor Workshop Manuals
Thank you for each of your efforts on this web page.
Cat Toys
We stumbled over here by a different web address and thought I might as well check things out. I like what I see so i am just following you. Look forward to looking over your web page repeatedly.
Download Now
I went over this web site and I think you have a lot of good information, saved to my bookmarks (:.
AEOI
My spouse and i have been so joyful when John managed to finish off his reports while using the ideas he received through the web pages. It is now and again perplexing just to always be giving away helpful hints that many some others could have been making money from. We consider we have the blog owner to give thanks to for this. The type of explanations you made, the simple blog menu, the friendships you give support to promote – it is all awesome, and it’s aiding our son and us understand that article is thrilling, and that’s incredibly essential. Thanks for everything!
successful women
This is really interesting, You are a very skilled blogger. I’ve joined your rss feed and look forward to seeking more of your wonderful post. Also, I’ve shared your site in my social networks!
KelMoge
Viagra Wirkung Prostata achat cialis avec ordonnance Cephalexin 500mg For Toothache Propecia Cancer Testicular
Situs Judi Ayam SV388
I do consider all the ideas you have offered to your post. They are very convincing and can definitely work. Still, the posts are too quick for beginners. Could you please lengthen them a bit from subsequent time? Thanks for the post.
agen slot online
Some really choice content on this internet site , bookmarked .
avocados
Hey very cool blog!! Man .. Excellent .. Amazing .. I will bookmark your site and take the feeds also…I’m happy to find so many useful information here in the post, we need develop more strategies in this regard, thanks for sharing. . . . . .
viagra
I do consider all the ideas you’ve presented on your post. They’re very convincing and will definitely work. Still, the posts are too brief for beginners. May just you please extend them a bit from next time? Thank you for the post.
OTP Token
Do you have a spam problem on this blog; I also am a blogger, and I was curious about your situation; many of us have developed some nice procedures and we are looking to exchange methods with others, why not shoot me an email if interested.
voyance suisse amour
Hello, you used to write great, but the last few posts have been kinda boring… I miss your great writings. Past few posts are just a little out of track! come on!
Disposable email
naturally like your web-site but you have to take a look at the spelling on quite a few of your posts. Several of them are rife with spelling issues and I in finding it very bothersome to inform the reality however I’ll certainly come again again.
W88
Thank you for every other informative site. The place else may I am getting that type of information written in such an ideal method? I have a project that I’m just now operating on, and I have been at the look out for such information.
fake IDs
I think this is among the most important information for me. And i’m glad reading your article. But want to remark on few general things, The website style is perfect, the articles is really great : D. Good job, cheers
Voitolla.com
Hi my friend! I want to say that this post is amazing, nice written and include almost all important infos. I would like to see more posts like this.
Stepnot
Viagra Age shipped ups on line isotretinoin 10mg in usa cheapest cialis Gimmepills
Casino
Heya i’m for the first time here. I found this board and I find It truly useful & it helped me out a lot. I hope to give something back and help others like you aided me.
carstyle2you
What’s Happening i am new to this, I stumbled upon this I’ve found It absolutely helpful and it has aided me out loads. I hope to give a contribution & help different users like its aided me. Good job.
audacious
I like this website so much, bookmarked. “American soldiers must be turned into lambs and eating them is tolerated.” by Muammar Qaddafi.
business news
Great – I should certainly pronounce, impressed with your site. I had no trouble navigating through all the tabs and related information ended up being truly simple to do to access. I recently found what I hoped for before you know it in the least. Quite unusual. Is likely to appreciate it for those who add forums or anything, website theme . a tones way for your client to communicate. Excellent task.
https://www.pinterest.com/pin/745697650779865717/
It’s hard to seek out educated individuals on this topic, but you sound like you realize what you’re speaking about! Thanks
How to earn extra money
But wanna input on few general things, The website style and design is perfect, the subject material is real wonderful. “To the artist there is never anything ugly in nature.” by Franois Auguste Ren Rodin.
crypto arbitrage
What i do not realize is in reality how you are not really much more well-appreciated than you might be now. You’re so intelligent. You already know thus significantly with regards to this topic, produced me for my part believe it from a lot of numerous angles. Its like women and men don’t seem to be interested except it’s one thing to accomplish with Lady gaga! Your individual stuffs great. At all times take care of it up!
www.billgatesmicrosoft.com/billhouse.htm
hello!,I really like your writing so much! proportion we keep up a correspondence more approximately your post on AOL? I need a specialist in this house to resolve my problem. May be that is you! Looking ahead to peer you.
https://twitter.com/genesis2mining
I am so happy to read this. This is the kind of manual that needs to be given and not the random misinformation that is at the other blogs. Appreciate your sharing this greatest doc.
cold should tops
Hey! I know this is kinda off topic but I was wondering if you knew where I could find a captcha plugin for my comment form? I’m using the same blog platform as yours and I’m having trouble finding one? Thanks a lot!
nba news
Hi there very cool site!! Guy .. Beautiful .. Amazing .. I will bookmark your web site and take the feeds additionally…I am happy to seek out so many useful info here in the submit, we want develop more strategies in this regard, thank you for sharing.
Bangalore
Thanks , I have just been looking for info approximately this subject for ages and yours is the greatest I’ve came upon so far. However, what concerning the bottom line? Are you certain concerning the source?
เช่าหลักทรัพย์ประกันตัว
Appreciating the commitment you put into your website and detailed information you present. It’s great to come across a blog every once in a while that isn’t the same outdated rehashed information. Fantastic read! I’ve bookmarked your site and I’m including your RSS feeds to my Google account.
Logo design
whoah this blog is fantastic i love studying your posts. Keep up the good work! You realize, many individuals are searching around for this information, you could aid them greatly.
비아그라
you are in point of fact a excellent webmaster. The web site loading pace is incredible. It kind of feels that you’re doing any distinctive trick. Also, The contents are masterpiece. you’ve performed a fantastic process on this subject!
eBay accounts for sale
Nice weblog right here! Also your website rather a lot up very fast! What host are you the usage of? Can I am getting your associate link to your host? I desire my site loaded up as quickly as yours lol
yoga neubau 1070
Yoga Neubau 1070
도박사이트
That is the appropriate blog for anyone who wants to seek out out about this topic. You understand so much its nearly onerous to argue with you (not that I really would need…HaHa). You positively put a brand new spin on a topic thats been written about for years. Nice stuff, simply great!
where to buy cannabis oil
Thank you for every other informative web site. The place else may just I am getting that type of information written in such a perfect method? I have a undertaking that I am simply now working on, and I have been on the look out for such information.
Green Card Organization
Super-Duper website! I am loving it!! Will be back later to read some more. I am taking your feeds also
login w88
I have discovered some new items from your site about pc’s. Another thing I’ve always assumed is that computers have become an item that each house must have for several reasons. They supply you with convenient ways to organize homes, pay bills, search for information, study, pay attention to music and also watch tv shows. An innovative solution to complete many of these tasks is by using a computer. These personal computers are mobile ones, small, strong and easily transportable.
รับจัดงานแต่งงาน
This web site can be a stroll-through for all of the data you needed about this and didn’t know who to ask. Glimpse right here, and also you’ll positively uncover it.
Marketingagentur Nordhorn Homepage
I have recently started a blog, the information you provide on this web site has helped me tremendously. Thanks for all of your time & work.
ww88
Hello.This article was extremely motivating, particularly because I was browsing for thoughts on this issue last Monday.
W88 Thailand
As soon as I found this internet site I went on reddit to share some of the love with them.
Stepnot
Sildenafil rique cialis comprar contrareembolso Levitra Foglio Illustrativo Does Amoxicillin Contain Monoamine Oxidase Inhibitor
Color contact lenses
I cling on to listening to the news update speak about receiving boundless online grant applications so I have been looking around for the top site to get one. Could you tell me please, where could i find some?
Porn
I’ve been exploring for a little for any high quality articles or blog posts on this kind of area . Exploring in Yahoo I at last stumbled upon this web site. Reading this info So i’m happy to convey that I’ve a very good uncanny feeling I discovered exactly what I needed. I most certainly will make certain to don’t forget this website and give it a look regularly.
unicc
I have been examinating out many of your articles and i must say pretty clever stuff. I will make sure to bookmark your website.
KelMoge
Valtrex For Dogs Lilly Cialis 20 Mg cialis 40 mg Turkisch Levitra
W88
I really like your writing style, superb info , thankyou for posting : D.
w88vn.com
Oh my goodness! a tremendous article dude. Thank you Nevertheless I’m experiencing subject with ur rss . Don’t know why Unable to subscribe to it. Is there anyone getting an identical rss problem? Anyone who is aware of kindly respond. Thnkx
W88
It’s a shame you don’t have a donate button! I’d most certainly donate to this superb blog! I suppose for now i’ll settle for bookmarking and adding your RSS feed to my Google account. I look forward to fresh updates and will talk about this site with my Facebook group. Chat soon!
w88
My brother suggested I might like this blog. He was totally right. This post actually made my day. You can not imagine just how much time I had spent for this info! Thanks!
เช่าเก้าอี้บุนวม
Hello there, You have performed an excellent job. I will certainly digg it and personally suggest to my friends. I’m confident they will be benefited from this website.
Great Sex
I will right away grab your rss as I can not in finding your e-mail subscription link or newsletter service. Do you have any? Kindly permit me recognize in order that I may subscribe. Thanks.
w88 Thai
It’s actually a cool and useful piece of information. I’m glad that you shared this useful information with us. Please keep us informed like this. Thanks for sharing.
w88
Hi there, just became aware of your blog through Google, and found that it is really informative. I’m going to watch out for brussels. I will be grateful if you continue this in future. A lot of people will be benefited from your writing. Cheers!
Morton Goonan
Appreciate the efforts
Henry Consolini
F*ckin’ tremendous things here. I am very happy to peer your article. Thank you so much and i’m looking forward to touch you. Will you kindly drop me a mail?
w88 blog
Nice blog here! Also your site loads up fast! What host are you using? Can I get your affiliate link to your host? I wish my site loaded up as quickly as yours lol
best pron
4nDXmB There may be noticeably a bundle to find out about this. I assume you made sure nice points in features also.
จัดงานแต่งงาน
Merely wanna comment that you have a very nice website , I love the style and design it actually stands out.
get deal
Howdy would you mind sharing which blog platform you’re working with? I’m planning to start my own blog soon but I’m having a hard time selecting between BlogEngine/Wordpress/B2evolution and Drupal. The reason I ask is because your layout seems different then most blogs and I’m looking for something unique. P.S My apologies for being off-topic but I had to ask!
เช่าโต๊ะ
You could certainly see your skills in the paintings you write. The world hopes for even more passionate writers like you who aren’t afraid to say how they believe. All the time go after your heart.
แต่งงาน สยามสมาคม
Does your site have a contact page? I’m having problems locating it but, I’d like to send you an email. I’ve got some recommendations for your blog you might be interested in hearing. Either way, great website and I look forward to seeing it grow over time.
W88 Thai
Great write-up, I¡¦m normal visitor of one¡¦s blog, maintain up the nice operate, and It is going to be a regular visitor for a lengthy time.
round the world
Of course, what a fantastic blog and informative posts, I surely will bookmark your website.Best Regards!
โต๊ะจีน นนทบุรี
Someone necessarily assist to make severely posts I’d state. This is the first time I frequented your web page and so far? I surprised with the research you made to create this actual submit incredible. Excellent job!
จัดงานแต่งงาน
Excellent post. I was checking continuously this blog and I’m inspired! Very useful info specifically the closing section 🙂 I handle such information much. I used to be looking for this certain information for a long time. Thanks and good luck.
แต่งงาน thai cc
One thing is one of the most popular incentives for using your credit cards is a cash-back or rebate provision. Generally, you’ll have access to 1-5 back on various purchases. Depending on the credit cards, you may get 1 in return on most expenses, and 5 back on buying made from convenience stores, filling stations, grocery stores and also ‘member merchants’.
Top Down Bottom Up Trilight Shades
Hi there, just became alert to your blog through Google, and found that it’s really informative. I’m gonna watch out for brussels. I’ll appreciate if you continue this in future. Lots of people will be benefited from your writing. Cheers!
Idella Delaurentis
Wow! Thank you! I constantly needed to write on my site something like that. Can I include a fragment of your post to my site?
univerzitet
What as up, just wanted to say, I liked this article. It was helpful. Keep on posting!|
W88Thai
Definitely consider that which you said. Your favourite reason appeared to be at the net the simplest factor to take into accout of. I say to you, I definitely get irked at the same time as people think about concerns that they plainly do not understand about. You managed to hit the nail upon the top and defined out the entire thing with no need side effect , other folks could take a signal. Will probably be back to get more. Thanks
kitchen designer
you have a fantastic weblog right here! would you like to make some invite posts on my blog?
Allie Haze
Tiffany Jewelry ??????30????????????????5??????????????? | ????????
iptv box
I was very happy to seek out this internet-site.I wanted to thanks for your time for this wonderful learn!! I definitely having fun with each little bit of it and I have you bookmarked to check out new stuff you blog post.
porno
I conceive this site holds some really wonderful information for everyone :D. “Do not go where the path may lead, go instead where there is no path and leave a trail.” by Ralph Waldo Emerson.
His Secret Obsession Reviews
I usually do not create a bunch of responses, however i did a few searching and wound up right here?? –
mens sex toys
One important thing is that if you find yourself searching for a student loan you may find that you’ll want a cosigner. There are many cases where this is correct because you will find that you do not use a past credit ranking so the loan company will require you have someone cosign the financial loan for you. Thanks for your post.
massage guns
F*ckin’ tremendous things here. I’m very satisfied to look your post. Thanks a lot and i am having a look forward to contact you. Will you please drop me a mail?
Sundress for Women
I truly appreciate this post. I ave been looking everywhere for this! Thank goodness I found it on Bing. You have made my day! Thank you again..
to read more
My brother recommended I might like this blog. He was entirely right. This post actually made my day. You cann at imagine just how much time I had spent for this info! Thanks!
Rugby World Cup live streaming online
I enjoy the efforts you have put in this, appreciate it for all the great blog posts.
เสริมจมูกที่ไหนดี
Very good info. Lucky me I found your website by chance (stumbleupon). I ave saved as a favorite for later!
메이저토토사이트
Thanks for the update, how can I make is so that I get an update sent in an email whenever you make a new post?
use Face Lift lotion before shaving
Spot on with this write-up, I truly think this web site wants far more consideration. I’ll in all probability be once more to read much more, thanks for that info.
nyc fire extinguisher
This is a great tip particularly to those fresh to the blogosphere. Simple but very accurate info Appreciate your sharing this one. A must read article!
Verkkotunnus
As I site possessor I believe the content material here is rattling magnificent , appreciate it for your efforts. You should keep it up forever! Good Luck.
sun tiger electronic store
please stop by the web-sites we adhere to, including this one particular, as it represents our picks through the web
webhotelli
Useful info. Fortunate me I discovered your web site unintentionally, and I am shocked why this accident did not happened in advance! I bookmarked it.
scooter braun
wow, awesome post.Really looking forward to read more. Cool.
Webhotelli
Great website you have here but I was wondering if you knew of any user discussion forums that cover the same topics talked about here? I’d really like to be a part of community where I can get suggestions from other experienced individuals that share the same interest. If you have any suggestions, please let me know. Kudos!
verkkotunnus
Hi there! I just want to give an enormous thumbs up for the nice information you will have right here on this post. I shall be coming back to your blog for more soon.
webhotelli
I wish to express my respect for your kindness giving support to those people who really want guidance on this important content. Your personal commitment to passing the solution all through had become amazingly valuable and has in every case empowered professionals like me to achieve their dreams. Your entire warm and helpful useful information indicates a lot a person like me and far more to my colleagues. Best wishes; from everyone of us.
Best Digital Forensics Certification
Thank you ever so for you post. Really Great.
Best Postcards Shop
Looking forward to reading more. Great article post.Thanks Again. Really Great.
verkkotunnus
Thanks for expressing your ideas listed here. The other thing is that any time a problem takes place with a pc motherboard, individuals should not have some risk with repairing this themselves because if it is not done correctly it can lead to permanent damage to an entire laptop. It is usually safe just to approach the dealer of any laptop for any repair of that motherboard. They’ve got technicians that have an know-how in dealing with notebook motherboard complications and can have the right prognosis and undertake repairs.
ADULT POKER VIAGRA OFFSHORE
I loved as much as you will receive carried out right here. The sketch is attractive, your authored material stylish. nonetheless, you command get bought an impatience over that you wish be delivering the following. unwell unquestionably come more formerly again since exactly the same nearly very often inside case you shield this increase.
ofertas
Perfectly composed written content , thanks for information .
https://stanfordpelage.com/
Really enjoyed this article post.Really looking forward to read more. Want more.
https://stanfordpelage.com/
Wow, wonderful weblog format! How long have you been blogging for? you make running a blog look easy. The total look of your website is wonderful, let alone the content material!
amazon prime day 2019 date
A person necessarily lend a hand to make severely articles I would state. This is the very first time I frequented your web page and so far? I surprised with the analysis you made to create this actual submit amazing. Excellent job!
Neighbours Review
I do consider all of the concepts you’ve introduced in your post. They’re very convincing and will definitely work. Nonetheless, the posts are too brief for newbies. Could you please lengthen them a little from next time? Thank you for the post.
pool table refelting
Valuable info. Lucky me I found your web site by accident, and I am shocked why this coincidence did not happened earlier! I bookmarked it.
gerenciagram
I was just looking for this info for a while. After six hours of continuous Googleing, finally I got it in your web site. I wonder what’s the lack of Google strategy that don’t rank this kind of informative sites in top of the list. Generally the top sites are full of garbage.
W88
Hello my family member! I wish to say that this post is amazing, nice written and include approximately all important infos. I’d like to look extra posts like this .
brcko
You made some decent points there. I looked online for that problem and located most individuals will go coupled with in conjunction with your web internet site.
visit website
Muchos Gracias for your blog post.Really looking forward to read more. Really Cool.
W88 ดีไหม
Aw, this was a very nice post. In concept I would like to put in writing like this additionally – taking time and actual effort to make an excellent article… however what can I say… I procrastinate alot and by no means seem to get something done.
https://www.viagrastoresa.com/viagrasouthafrica/why-how-and-where-to-buy-viagra-in-south-africa/
Well I definitely enjoyed studying it. This tip procured by you is very effective for accurate planning.
Real Estate Investing
Thank you for sharing excellent informations. Your web-site is so cool. I’m impressed by the details that you’ve on this blog. It reveals how nicely you perceive this subject. Bookmarked this website page, will come back for extra articles. You, my pal, ROCK! I found simply the information I already searched all over the place and simply couldn’t come across. What an ideal web-site.
Stepnot
Propecia Customer Reviews Thinning Hair Amoxicillin Dose During Pregnancy cialis Tadalafil Cheapest Price Clomid Et Prise De Poids
Property to Let in Nigeria
There is noticeably a bundle to know about this. I assume you created specific nice points in functions also.
IVF treatment in India
Really appreciate you sharing this blog.Really looking forward to read more. Want more.
Best IVF Doctors in India
It as best to take part in a contest for one of the best blogs on the web. I will recommend this web site!
Interactive Thriller Adventure
The electronic cigarette makes use of a battery and a small heating aspect the vaporize the e-liquid. This vapor can then be inhaled and exhaled
evropski univerzitet
long time watcher and I just thought IaаАабТТаЂааАабТТаБТd drop by and say hi there there for your really initially time.
arduino raspberry pi
Yet another issue is that video games can be serious in nature with the principal focus on mastering rather than amusement. Although, there is an entertainment element to keep the kids engaged, just about every game is frequently designed to work on a specific experience or area, such as numbers or scientific discipline. Thanks for your article.
synacthen depot
There is definately a great deal to find out about this subject. I love all of the points you made.
Aleida
Just wanna input that you have a very decent web site , I love the design and style it actually stands out.
Kaycee
Thanks for the auspicious writeup. It if truth be told was once a enjoyment account it.
deals for pizza express
It’s really a great and helpful piece of info. I am glad that you shared this useful info with us. Please keep us informed like this. Thanks for sharing.
Roni
You can certainly see your expertise in the paintings you write. The sector hopes for more passionate writers like you who are not afraid to mention how they believe. At all times follow your heart.
Baltimore office movers
I was recommended this website by way of my cousin. I’m no longer certain whether this put up is written via him as no one else understand such exact approximately my trouble. You’re incredible! Thank you!
hiwap review
Thankyou for this grand post, I am glad I observed this internet site on yahoo.
ikea assembly service
Really nice style and design and excellent subject material , absolutely nothing else we need : D.
free shipping furniture store
Hello There. I found your blog using msn. This is a really well written article. I’ll be sure to bookmark it and return to read more of your useful information. Thanks for the post. I will definitely comeback.
KelMoge
Priligy Dysfonction Erectile Siphene Buy No Prescription canadian levitra Can You Take Clindamycin And Amoxicillin Wee Canadian Pharcharmy
Fetish
Hi! Do you know if they make any plugins to help with Search Engine Optimization? I’m trying to get my blog to rank for some targeted keywords but I’m not seeing very good results. If you know of any please share. Thanks!
white glove delivery service
It¡¦s actually a nice and helpful piece of information. I¡¦m glad that you simply shared this helpful info with us. Please keep us informed like this. Thank you for sharing.
furniture disposal service
Thank you a lot for sharing this with all people you actually understand what you’re speaking approximately! Bookmarked. Please additionally talk over with my site =). We can have a link alternate agreement between us!
i was reading this
Regards for helping out, excellent information.
waist trainer before and after
Thanks , I have recently been searching for information about this topic for a while and yours is the best I have discovered till now. But, what about the conclusion? Are you sure concerning the source?
muscle enlargement from gadget Europe
I really liked your article.Thanks Again. Awesome.
Tattooists
Really enjoyed this blog.Thanks Again. Really Great.
univerzitet
You made some respectable factors there. I regarded on the web for the difficulty and located most people will go together with together with your website.
online home furnishings
Im thankful for the blog post. Want more.
http://satu-bangsa.net/
Major thanks for the article post.Thanks Again. Want more.
W88 Thailand
Someone necessarily lend a hand to make seriously articles I might state. That is the very first time I frequented your website page and to this point? I surprised with the analysis you made to make this particular publish extraordinary. Wonderful job!
W88 Thai
Its like you learn my mind! You appear to understand a lot approximately this, such as you wrote the e-book in it or something. I think that you can do with some p.c. to pressure the message home a little bit, but other than that, that is magnificent blog. A fantastic read. I will definitely be back.
รับจัดบุฟเฟ่ต์
One other thing to point out is that an online business administration study course is designed for individuals to be able to easily proceed to bachelor’s degree programs. The Ninety credit diploma meets the other bachelor education requirements so when you earn your associate of arts in BA online, you will get access to the most up-to-date technologies in such a field. Some reasons why students want to get their associate degree in business is because they’re interested in this area and want to obtain the general training necessary ahead of jumping in a bachelor diploma program. Thx for the tips you actually provide inside your blog.
Drobilka dlja KNS
Just wanna tell that this is very helpful, Thanks for taking your time to write this.
W88Thai
Hey there, You have done a fantastic job. I will definitely digg it and personally suggest to my friends. I’m sure they’ll be benefited from this site.
Manager office Chairs
Im obliged for the blog article.Really thank you!
WW88
I have discovered some new elements from your website about computers. Another thing I have always imagined is that computers have become a product that each residence must have for a lot of reasons. They offer convenient ways in which to organize the home, pay bills, shop, study, focus on music as well as watch tv programs. An innovative strategy to complete every one of these tasks is a laptop computer. These computers are mobile ones, small, robust and mobile.
W88vn
Thanks for these tips. One thing I also believe is that credit cards supplying a 0% apr often bait consumers in with zero interest rate, instant approval and easy internet balance transfers, nonetheless beware of the real factor that may void that 0% easy street annual percentage rate plus throw you out into the poor house quickly.
Stepnot
Commander Baclofene Hydrochlorizide For Sale viagra prescription Acheter Kamagra Gel Grenoble
Reshjotka drobilka
Thanks again for the article.Much thanks again. Awesome.
my_love_is_one_second_revised_edition
Have you ever considered about including a little bit more than just your articles? I mean, what you say is valuable and all. However think of if you added some great visuals or videos to give your posts more, “pop”! Your content is excellent but with pics and video clips, this site could definitely be one of the very best in its field. Very good blog!
bookstore movers in Washington DC
Wow! This could be one particular of the most beneficial blogs We’ve ever arrive across on this subject. Actually Great. I am also an expert in this topic so I can understand your effort.
ww88
In these days of austerity and relative panic about running into debt, lots of people balk about the idea of employing a credit card to make acquisition of merchandise or maybe pay for a holiday, preferring, instead only to rely on a tried in addition to trusted means of making transaction – cash. However, if you possess the cash on hand to make the purchase completely, then, paradoxically, this is the best time for you to use the credit cards for several factors.
Tattoo Shops
It as hard to come by well-informed people for this topic, however, you sound like you know what you are talking about! Thanks
แทงบอล
Say, you got a nice post.Thanks Again. Cool.
W88 Thai
Have you ever considered creating an ebook or guest authoring on other sites? I have a blog centered on the same topics you discuss and would really like to have you share some stories/information. I know my subscribers would enjoy your work. If you’re even remotely interested, feel free to shoot me an e mail.
teknion cubicle assembly service
Good website! I really love how it is easy on my eyes and the data are well written. I’m wondering how I could be notified whenever a new post has been made. I’ve subscribed to your feed which must do the trick! Have a nice day!
Casino888
naturally like your web-site but you have to take a look at the spelling on quite a few of your posts. A number of them are rife with spelling issues and I to find it very bothersome to inform the truth then again I’ll surely come back again.
Mclean movers
You really make it appear so easy together with your presentation but I to find this matter to be really one thing which I believe I’d never understand. It seems too complicated and very wide for me. I’m having a look ahead for your subsequent post, I¡¦ll attempt to get the hang of it!
w88vn
What’s Happening i am new to this, I stumbled upon this I’ve found It positively useful and it has aided me out loads. I hope to contribute & help other users like its aided me. Good job.
DC Furniture removal service
I was suggested this website by way of my cousin. I’m not certain whether or not this publish is written by way of him as nobody else recognize such particular about my problem. You’re amazing! Thank you!
try this
I just want to tell you that I’m newbie to weblog and certainly liked you’re page. Most likely I’m planning to bookmark your blog post . You actually come with impressive articles and reviews. Appreciate it for sharing with us your blog site.
Silver spring Moving company
One more issue is that video gaming became one of the all-time most important forms of excitement for people of every age group. Kids have fun with video games, and also adults do, too. The actual XBox 360 is probably the favorite video games systems for those who love to have hundreds of activities available to them, in addition to who like to learn live with some others all over the world. Thank you for sharing your thinking.
W88
Whats up very cool blog!! Man .. Excellent .. Superb .. I will bookmark your site and take the feeds also¡KI’m happy to seek out so many helpful information right here within the publish, we need develop more strategies on this regard, thanks for sharing. . . . . .
495 movers
I’ve learned quite a few important things through your post. I will also like to convey that there can be situation where you will obtain a loan and never need a co-signer such as a Federal Student Support Loan. But when you are getting financing through a conventional loan provider then you need to be able to have a co-signer ready to enable you to. The lenders will base that decision over a few factors but the most significant will be your credit history. There are some loan providers that will additionally look at your job history and come to a decision based on this but in many cases it will depend on your scores.
จัดบุฟเฟ่ต์
I am not sure where you are getting your information, but great topic. I needs to spend some time learning more or understanding more. Thanks for magnificent information I was looking for this info for my mission.
m88
I’m impressed, I need to say. Really rarely do I encounter a weblog that’s both educative and entertaining, and let me tell you, you have hit the nail on the head. Your concept is outstanding; the difficulty is something that not enough persons are talking intelligently about. I’m very happy that I stumbled across this in my search for something relating to this.
Catering รับจัดเลี้ยงนอกสถานที่
I like what you guys are up also. Such intelligent work and reporting! Carry on the superb works guys I’ve incorporated you guys to my blogroll. I think it will improve the value of my website 🙂
super affiliate system 3.0 review
I was suggested this blog by my cousin. I am not sure whether this post is written by him as nobody else know such detailed about my problem. You are amazing! Thanks!
blog here
I simply want to tell you that I am new to weblog and honestly loved this web page. More than likely I’m planning to bookmark your site . You certainly have wonderful writings. Appreciate it for revealing your web site.
W88
Very great post. I just stumbled upon your blog and wanted to say that I have really enjoyed surfing around your blog posts. After all I will be subscribing on your rss feed and I hope you write again very soon!
promo
Major thanks for the blog.Really thank you! Want more.
site
wow, awesome blog article. Much obliged.
codes
Tumblr article I saw someone talking about this on Tumblr and it linked to
ห้องจัดเลี้ยง ราคาถูก
I genuinely enjoy studying on this website , it contains excellent content . “I have a new philosophy. I’m only going to dread one day at a time.” by Charles M. Schulz.
discounts
Im thankful for the blog post.Thanks Again. Fantastic.
codes
Im thankful for the blog.Really thank you! Great.
coupon
You made some decent points there. I looked on the internet for the subject matter and found most individuals will approve with your site.
Annapolis movers
What i do not understood is in truth how you are now not actually a lot more well-preferred than you might be now. You’re very intelligent. You realize thus significantly in the case of this matter, made me for my part believe it from numerous varied angles. Its like men and women don’t seem to be involved until it is one thing to accomplish with Girl gaga! Your individual stuffs nice. All the time care for it up!
coupon
This excellent website definitely has all the information and facts I wanted concerning this subject and didn at know who to ask.
White glove delivery in Maryland
Thank you for the sensible critique. Me & my neighbor were just preparing to do some research on this. We got a grab a book from our local library but I think I learned more from this post. I am very glad to see such fantastic info being shared freely out there.
code
I think that what you published made a ton of sense. However,
coupons
placing the other person as webpage link on your page at suitable place and other person will also do similar in favor of
link
Its hard to find good help I am constantnly saying that its hard to find good help, but here is
deal
Thank you for your blog post. Really Cool.
MEYD-516
hello!,I love your writing so a lot! proportion we communicate more about your post on AOL? I need a specialist on this area to solve my problem. Maybe that’s you! Having a look forward to look you.
web
Right here is the right webpage for anybody who wishes to understand this topic.
Baltimore BRAIDERS
It’s actually a great and helpful piece of information. I am glad that you simply shared this helpful info with us. Please stay us informed like this. Thank you for sharing.
kids uniforms
Say, you got a nice blog.Really thank you! Really Cool.
gia nuoc lavie
Thanks-a-mundo for the article.Really thank you!
صيانة ميكروويف جالانز
Hey there! Do you know if they make any plugins to assist with SEO? I’m trying to get my blog to rank for some targeted keywords but I’m not seeing very good results. If you know of any please share. Appreciate it!
best dumps website
Thanks for sharing, this is a fantastic post.Really looking forward to read more. Want more.
tripadvisor
I saw a lot of website but I conceive this one has something extra in it.
Virginia furniture assembly service
You completed a few good points there. I did a search on the issue and found the majority of people will go along with with your blog.
czeski xanax
You can certainly see your skills in the work you write. The world hopes for more passionate writers such as you who aren at afraid to say how they believe. At all times follow your heart.
rctd 252
Lovely site! I am loving it!! Will come back again. I am taking your feeds also.
Prosper Noah
There is certainly a great deal to learn about this subject. I really like all of the points you ave made.
https://www.prospernoah.com/naira4all-review-scam-or-legit/
You could certainly see your enthusiasm in the work you write. The world hopes for more passionate writers like you who are not afraid to say how they believe. Always follow your heart.
Wakanda.ng review
Im thankful for the article post.Much thanks again. Really Great.
W88
fantastic put up, very informative. I wonder why the opposite specialists of this sector do not notice this. You should proceed your writing. I am confident, you’ve a huge readers’ base already!
nnu
I’аve learn a few excellent stuff here. Definitely value bookmarking for revisiting. I surprise how so much attempt you put to create this type of great informative web site.
https://www.prospernoah.com/winapay-review-legit-or-scam/
Say, you got a nice blog.Really thank you! Really Cool.
Silver spring movers
Do you mind if I quote a few of your articles as long as I provide credit and sources back to your site? My website is in the exact same niche as yours and my visitors would genuinely benefit from some of the information you provide here. Please let me know if this alright with you. Cheers!
nnu
Just bookmarked your blogs, it is a really great and helpful piece of information. I am happy that you shared this helpful info with us. Please keep us informed like this. Keep writing.
Clickbank nigeria
Its like you read my mind! You appear to know so much
https://www.prospernoah.com/how-can-you-make-money-online-with-1000-naira/
Very nice write-up. I absolutely love this website. Thanks!
https://www.prospernoah.com/how-can-you-make-money-online-with-1000-naira/
Wow, awesome blog layout! How long have you been blogging for? you made blogging look easy. The overall look of your web site is great, let alone the content!. Thanks For Your article about sex.
Affiliate programs in nigeria 2019
Wow, amazing blog layout! How long have you been blogging for? you made blogging look easy. The overall look of your website is magnificent, let alone the content!. Thanks For Your article about sex.
mp3 sounds
Thank you for your blog post.Really thank you! Cool.
Cory
This unique blog is no doubt entertaining and besides diverting. I have found many useful advices out of this amazing blog. I ad love to go back over and over again. Cheers!
Ignacia
I truly appreciate this blog article.Thanks Again.
Tamatha
What web host are you using? Can I get your affiliate link to your host?
W88
Hello, Neat post. There is an issue with your web site in web explorer, may test this… IE nonetheless is the marketplace chief and a big portion of people will pass over your magnificent writing due to this problem.
Best Porno escorts
Would you be enthusiastic about exchanging hyperlinks?
Juan
Oakley has been gone for months, but the
เช่า alphard
I have been reading out many of your posts and it’s nice stuff. I will make sure to bookmark your blog.
Glennis
Many thanks for sharing this great post. Very inspiring! (as always, btw)
Tractor Workshop Manuals
Great help from this blog! Thanks alot for the information I needed
venue search london
Really enjoyed this blog.Much thanks again. Great.
altin
There is perceptibly a bundle to know about this. I suppose you made some nice points in features also.
Best Porno escorts
You made certain good points there. I did a search on the topic and found a good number of people will have the same opinion with your blog.
porn movie
Normally I do not learn post on blogs, but I would like to say that this write-up very forced me to try and do it! Your writing taste has been surprised me. Thanks, very great post.
softwareupdate
This blog is without a doubt educating additionally factual. I have discovered a bunch of useful stuff out of it. I ad love to return again and again. Cheers!
Catering รับจัดเลี้ยง
Would you be serious about exchanging links?
programas de afiliados que mas pagan
south korea jersey ??????30????????????????5??????????????? | ????????
gameonline
tiffany rings Secure Document Storage Advantages | West Coast Archives
Credenza assembly service
Thanks for giving your ideas. The first thing is that college students have an alternative between federal student loan and also a private education loan where it’s easier to decide on student loan online debt consolidation than in the federal student loan.
freeprints
Thank you for your article.Much thanks again. Awesome.
carding tutorial for noobs
You have made some decent points there. I checked on the net for additional information about the issue and found most individuals will go along with your views on this web site.
value city furniture assembly service
I’ll immediately take hold of your rss as I can not in finding your email subscription link or newsletter service. Do you have any? Kindly let me know so that I may just subscribe. Thanks.
more details
Take a look for more Information on that topic
Motivation
Very nice post. I just stumbled upon your blog and wanted to say that I have really enjoyed browsing your blog posts. In any case I will be subscribing to your feed and I hope you write again soon!
cubicle installation
I do accept as true with all the ideas you’ve offered to your post. They are really convincing and can definitely work. Still, the posts are too quick for starters. May you please prolong them a bit from subsequent time? Thanks for the post.
car warranty coverage
Really appreciate you sharing this blog post.Really looking forward to read more. Fantastic.
giá biệt thự sala
Since the admin of this web site is working, no question very rapidly it will
Furniture assembly service
Howdy would you mind stating which blog platform you’re using? I’m going to start my own blog soon but I’m having a tough time choosing between BlogEngine/Wordpress/B2evolution and Drupal. The reason I ask is because your design seems different then most blogs and I’m looking for something completely unique. P.S My apologies for being off-topic but I had to ask!
download naijapron
I wish to get across my gratitude for your kindness supporting men and women that require assistance with that study. Your real commitment to getting the solution around appears to be exceptionally important and have all the time permitted many people much like me to achieve their aims. Your amazing warm and friendly help denotes much to me and even further to my office workers. Warm regards; from all of us.
Information
Thanks for sharing, this is a fantastic blog article.Much thanks again.
warranty on cars
It as appropriate time to make some plans for the future and it as time to be happy.
DC Movers
I have been exploring for a bit for any high-quality articles or blog posts in this kind of house . Exploring in Yahoo I finally stumbled upon this site. Studying this information So i’m satisfied to show that I have an incredibly good uncanny feeling I discovered exactly what I needed. I so much undoubtedly will make certain to do not forget this site and provides it a glance on a continuing basis.
quora
Latest Pre Paid Mastercard Auctions PrePaid Mastercard
link
Thanks a lot for the article.Thanks Again. Awesome.
Jeanene
Im obliged for the blog post.Thanks Again. Much obliged.
Oguz
Hello my friend! I want to say that this article is amazing, nice written and come with almost all vital infos. I would like to see extra posts like this .
Guillermina
This very blog is definitely interesting and also informative. I have picked up a lot of useful tips out of this source. I ad love to return over and over again. Thanks a bunch!
W88 Thai
Thank you for the sensible critique. Me and my neighbor were just preparing to do some research on this. We got a grab a book from our local library but I think I learned more clear from this post. I am very glad to see such fantastic info being shared freely out there.
Zofia
Thanks so much for the blog article.Thanks Again. Really Cool.
Kandace
It as not that I want to replicate your web site, but I really like the style. Could you let me know which design are you using? Or was it especially designed?
W88th
Wow! This blog looks exactly like my old one! It’s on a totally different subject but it has pretty much the same page layout and design. Superb choice of colors!
Larisa
Very informative article.Really thank you! Awesome.
Letitia
You have noted very interesting details ! ps decent web site. O human race born to fly upward, wherefore at a little wind dost thou fall. by Dante Alighieri.
Movers
I’ve been browsing online more than three hours today, yet I never discovered any fascinating article like yours. It is beautiful price enough for me. In my view, if all website owners and bloggers made just right content material as you did, the web shall be much more helpful than ever before. “Baseball is 90 percent mental. The other half is physical.” by Lawrence Peter Berra.
Home gym assembly
of course like your web-site but you need to check the spelling on quite a few of your posts. A number of them are rife with spelling problems and I find it very troublesome to tell the truth nevertheless I will definitely come back again.
Fairfax Movers
Some really nice and utilitarian info on this website, likewise I conceive the pattern has got fantastic features.
Elliptical assembly service
Nice blog here! Also your website loads up fast! What host are you using? Can I get your affiliate link to your host? I wish my web site loaded up as quickly as yours lol
Youtube
One other important issue is that if you are a senior citizen, travel insurance pertaining to pensioners is something you should really take into account. The mature you are, the more at risk you’re for making something poor happen to you while overseas. If you are not really covered by quite a few comprehensive insurance cover, you could have a number of serious complications. Thanks for giving your good tips on this blog site.
W88kub
A person essentially help to make critically articles I would state. This is the first time I frequented your website page and up to now? I amazed with the research you made to make this particular put up incredible. Great process!
WW88 ทางเข้า
I have not checked in here for some time since I thought it was getting boring, but the last several posts are good quality so I guess I will add you back to my daily bloglist. You deserve it my friend 🙂
แต่งงาน
Hello my family member! I want to say that this post is awesome, great written and include approximately all important infos. I would like to peer extra posts like this.
Stepnot
Zithromax Cause Diarrhea viagra Effetti Cialis 20 Mg
health and safety audit
Whats up very nice blog!! Man .. Beautiful .. Superb .. I will bookmark your site and take the feeds also…I am happy to search out so many helpful info right here within the put up, we want develop extra strategies in this regard, thanks for sharing.
furniture assembly team
It is indeed my belief that mesothelioma can be the most deadly cancer. It’s got unusual attributes. The more I really look at it a lot more I am sure it does not act like a real solid flesh cancer. In case mesothelioma can be a rogue viral infection, so there is the possibility of developing a vaccine and offering vaccination for asbestos exposed people who are at high risk with developing long run asbestos relevant malignancies. Thanks for sharing your ideas on this important ailment.
KelMoge
Propecia Es Bueno 1 Mg Ciprofloxacino 500 Mg Dosis Buy Nexium In Mexico cialis Viagra Guaranteed Pharmacy Lasix Dosage
installation concepts
Fantastic site. A lot of helpful info here. I¡¦m sending it to some buddies ans additionally sharing in delicious. And obviously, thank you in your sweat!
DC furniture removal
I was very happy to seek out this web-site.I wished to thanks in your time for this glorious learn!! I positively having fun with every little bit of it and I’ve you bookmarked to check out new stuff you blog post.
Tv mounting service DC
Attractive section of content. I just stumbled upon your blog and in accession capital to assert that I get in fact enjoyed account your blog posts. Anyway I’ll be subscribing to your augment and even I achievement you access consistently quickly.
roblox promo code
mais de fois qui. Alors, dormir dehors, des homicides ou, le meilleur et, fringues se nai
JUFE-088
Websites we recommend Wow, superb blog layout! How long have you been blogging for? you make blogging look easy. The overall look of your site is excellent, as well as the content!
Adult Martial Arts in Natomas
Great article post.Thanks Again. Fantastic.
jufe 085
This is one awesome article post.Much thanks again. Will read on
W88 Thai
I don’t even know how I ended up here, but I thought this post was great. I do not know who you are but definitely you’re going to a famous blogger if you aren’t already 😉 Cheers!
Smart TV installers
After examine a few of the blog posts in your web site now, and I really like your means of blogging. I bookmarked it to my bookmark web site listing and might be checking back soon. Pls take a look at my website as properly and let me know what you think.
rctd 252
Right here is the perfect webpage for everyone who would like to understand this topic.
W88
I have been exploring for a little for any high-quality articles or blog posts on this kind of area . Exploring in Yahoo I at last stumbled upon this site. Reading this info So i am happy to convey that I have a very good uncanny feeling I discovered just what I needed. I most certainly will make sure to don’t forget this web site and give it a look regularly.
promo codes for allegiant air 2019
The acetone and consultation need in each history and may be painless but however recently clinical.
free action games
Excellent blog here! Also your web site loads up very fast! What web host are you using? Can I get your affiliate link to your host? I wish my web site loaded up as fast as yours lol
SEO VANCOUVER
Really informative article post.Thanks Again. Will read on
balance fund
Thanks again for the blog.Thanks Again. Will read on
SSNI-552
You are my inspiration , I have few web logs and sometimes run out from to post .
buy money
This excellent website certainly has all of the info I needed about this subject and didn at know who to ask.
seo consultants vancouver
wow, awesome article post.Much thanks again. Fantastic.
corporate event accommodation
Very good information. Lucky me I came across your website by chance (stumbleupon). I have book-marked it for later!
imagenes de mantenimiento preventivo
Muchos Gracias for your article post. Much obliged.
Text Chemistry Review
Thank you so much for this kind of post. I аАааАТаЂТm very thinking about what you have to say. I will probably be back to see what other stuff you post.
playlist
Very neat post.Really looking forward to read more. Really Cool.
w88club.com
It’s arduous to find educated folks on this subject, however you sound like you understand what you’re speaking about! Thanks
free live sex shows
you are truly a excellent webmaster. The site loading speed
thang may gia dinh
Thanks so much for the article.Really thank you! Really Cool.
Thaicc
You really make it seem so easy with your presentation but I find this topic to be really something which I think I would never understand. It seems too complicated and very broad for me. I am looking forward for your next post, I will try to get the hang of it!
leangains
Normally I don’t read post on blogs, but I would like to say that this write-up very compelled me to take a look at and do it! Your writing taste has been surprised me. Thanks, quite great post.
vudu redeem
Im thankful for the blog.Thanks Again. Will read on
skillz promo code 2020
yeah bookmaking this wasn at a speculative determination outstanding post!.
oakley si promo code july 2019
Thanks for the blog post.Really thank you! Fantastic.
roblox promo codes free
Your style is very unique in comparison to other people I ave read stuff from. Many thanks for posting when you ave got the opportunity, Guess I all just bookmark this blog.
uhaul coupons
This particular blog is obviously educating additionally factual. I have found many helpful stuff out of this amazing blog. I ad love to go back again and again. Thanks a bunch!
aaa parking spot promo code
Just added this blog to my favorites. I enjoy reading your blogs and hope you keep them coming!
honest diapers coupon code
magnificent issues altogether, you simply won a emblem new reader. What may you recommend in regards to your post that you just made a few days in the past? Any sure?
office solutions
Great, thanks for sharing this blog post. Great.
modells coupon
I think you have mentioned some very interesting points, regards for the post.
priceline bidding coupons
Major thanks for the blog article.Thanks Again. Awesome.
carseat canopy coupon
Woh I like your posts, saved to my bookmarks!
raybans sunglasses sale
Really appreciate you sharing this article.Really looking forward to read more. Keep writing.
W88club
Hi! I’ve been reading your site for a long time now and finally got the bravery to go ahead and give you a shout out from Humble Tx! Just wanted to say keep up the fantastic work!
thrifty car rental maui
Im thankful for the article post.Thanks Again. Really Great.
flexjobs groupon
You need to take part in a contest for probably the greatest blogs on the web. I all advocate this website!
รับจัดเลี้ยง
Keep up the excellent work , I read few posts on this site and I think that your website is real interesting and holds lots of wonderful info .
w88live
Greetings from Los angeles! I’m bored to tears at work so I decided to check out your website on my iphone during lunch break. I enjoy the knowledge you provide here and can’t wait to take a look when I get home. I’m surprised at how fast your blog loaded on my mobile .. I’m not even using WIFI, just 3G .. Anyways, good blog!
mgemi $50 off
I was able to find good info from your articles.
iptv
very good put up, i certainly love this web site, carry on it
invite code for poshmark
Wow, great article.Thanks Again. Fantastic.
SEO agency Vancouver
Thanks again for the article.Really looking forward to read more. Fantastic.
SEO Vancouver
Of course, what a magnificent website and instructive posts, I surely will bookmark your website.Have an awsome day!
Catering
I have been surfing on-line greater than 3 hours these days, yet I never discovered any attention-grabbing article like yours. It is beautiful value enough for me. In my view, if all site owners and bloggers made excellent content material as you probably did, the net will likely be much more useful than ever before.
Furniture Assembly handyman
It’s the best time to make some plans for the future and it’s time to be happy. I have read this post and if I could I desire to suggest you few interesting things or tips. Maybe you could write next articles referring to this article. I want to read even more things about it!
in catalogue tai ha noi
Thanks for the blog article.Really thank you! Cool.
jets coupon
We all speak a little about what you should speak about when is shows correspondence to simply because Maybe this has more than one meaning.
Nonprofit giving
Some truly wonderful info , Gladiola I observed this. “Nothing can resist the human will that will stake even its existence on its stated purpose.” by Benjamin Disraeli.
John Deere Repair Manuals
Pretty section of content. I just stumbled upon your weblog and in accession capital to assert that I get actually enjoyed account your blog posts. Anyway I will be subscribing to your feeds and even I achievement you access consistently quickly.
marco coupons
Mr That his involvement will prompt Cheap Jerseys to set even higher standards that other international corporations will endorse.
W88
Enjoyed reading through this, very good stuff, regards . “Success doesn’t come to you…you go to it.” by Marva Collins.
cv coupons
What as Happening i am new to this, I stumbled upon this I have found It absolutely helpful and it has aided me out loads. I hope to contribute & assist other users like its aided me. Great job.
Change Bigpond Email Passwor
I think this is a real great blog article.Really looking forward to read more. Great.
cheggs coupon
Wow, incredible blog structure! How lengthy have you been running a blog for? you made blogging glance easy. The full glance of your site is great, let alone the content!
dunham's. coupon
I?аАТаЂаll right away seize your rss feed as I can not find your e-mail subscription link or newsletter service. Do you ave any? Kindly permit me know so that I could subscribe. Thanks.
W88
Thanks a bunch for sharing this with all of us you actually know what you are talking about! Bookmarked. Please also visit my website =). We could have a link exchange arrangement between us!
venue finder
I value the blog.Really looking forward to read more. Cool.
free live sex shows
I value your useful article. awe-inspiring job. I chance you produce additional. I will carry taking place watching
thang may gia dinh
Some really prime posts on this web site , saved to my bookmarks.
สยามสมาคม แต่งงาน ราคา
I really like your writing style, fantastic info , thankyou for putting up : D.
W88Thai
Merely a smiling visitant here to share the love (:, btw great pattern .
seo vancouver
Very good article post.Thanks Again. Keep writing.
SEO Vancouver
Personally, I have found that to remain probably the most fascinating topics when it draws a parallel to.
SEO Vancouver
this side of your story. I was surprised that you aren at
SEO Vancouver
Wow, great blog post.Thanks Again. Really Cool.
SEO Vancouver
It as very easy to find out any topic on web as compared to textbooks, as I found this piece of writing at this website.
visite site
I think other web-site proprietors should take this site as an model, very clean and great user genial style and design, as well as the content. You’re an expert in this topic!
SEO Vancouver
uggs outlet sale cheap ugg boots ugg outlet online uggs uk uggs on sale uk uggs discount ugg boots goedkope uggs kopen
SEO Vancouver
Really appreciate you sharing this post.Thanks Again. Fantastic.
artisan soap
Thanks a bunch for sharing this with all of us you actually know what you are talking about! Bookmarked. Please also visit my website =). We could have a link exchange contract between us!
카지노사이트
Great work! This is the type of information that should be shared around the net. Shame on the search engines for not positioning this post higher! Come on over and visit my web site . Thanks =)
faucets bathroom sink
Thanks so much for the article post.Much thanks again. Awesome.
SEO Vancouver
There is apparently a lot to know about this. I assume you made various nice points in features also.
비아그라
fantastic post, very informative. I wonder why the other experts of this sector don’t notice this. You should continue your writing. I am sure, you’ve a huge readers’ base already!
SEO Vancouver
Thanks a lot for the blog article. Cool.
WW88
As soon as I detected this site I went on reddit to share some of the love with them.
coupons tommy hilfiger outlet canada
Well I sincerely enjoyed reading it. This subject provided by you is very useful for good planning.
noom discount code may 2018
It as good to come across a blog every once
promo code dollar rent a car
I will not speak about your competence, the article basically disgusting
Current Check promo code jan
Very Fascinating Weblog! Thank You For This Weblog!
우리카지노
Excellent beat ! I would like to apprentice even as you amend your website, how can i subscribe for a weblog site? The account helped me a acceptable deal. I had been tiny bit familiar of this your broadcast offered vibrant transparent idea
it chapter 2 footage
Utterly indited subject matter, regards for entropy.
swagbucks promo codes
Looking forward to reading more. Great blog.Much thanks again. Really Great.
SEO Vancouver
thank you for this post, I am a big fan of this site would like to go along updated.
SEO Vancouver
Thanks for sharing your thoughts. I really appreciate your efforts and I am waiting for your further write ups thank you once again.
SEO Vancouver
You have made some good points there. I looked on the net for additional information about the issue and found most individuals will go along with your views on this website.
fabletics promo code april 2019
That is a great tip particularly to those new to the blogosphere. Short but very precise information Many thanks for sharing this one. A must read post!
coupon code for bodyboss method
Thanks a lot for the post.Thanks Again. Really Cool.
adore me pay as you go promo code
Very nice article. I absolutely love this website. Thanks!
SEO Vancouver
pretty practical stuff, overall I consider this is really worth a bookmark, thanks
bj's membership coupon $25
Thanks for the blog post.Really looking forward to read more. Cool.
alamo car rental coupon code costco
that I feel I would by no means understand. It kind
plumpaper 2019
to be shared across the web. Disgrace on the seek engines for now
latest news capread
Wow, incredible blog layout! How long have you been blogging for? you make blogging look easy. The overall look of your site is fantastic, let alone the content!
JimmyJohns 2019
You have made some really good points there. I checked on the web for more info about the issue and found most individuals will go along with your views on this site.
elbise giydirme
Usually I do not read article on blogs, but I wish to say that this write-up very forced me to check out and do it! Your writing taste has been amazed me. Thanks, quite great article.
Balon Patlatma
I was suggested this blog by my cousin. I am not sure whether this post is written by him as no one else know such detailed about my difficulty. You are amazing! Thanks!
kıyafet giydirme
Wow! This can be one particular of the most useful blogs We have ever arrive across on this subject. Actually Excellent. I am also a specialist in this topic so I can understand your hard work.
KralOyun
I truly enjoy studying on this site, it contains excellent blog posts. Don at put too fine a point to your wit for fear it should get blunted. by Miguel de Cervantes.
balfour facebook promo code
Packing Up For Storage аАТаЂа Yourself Storage
Amigo Infoservices Twitter
Wow, great article.Really looking forward to read more. Cool.
Amigo Infoservices Linkedin
Very informative blog post. Keep writing.
FreePeople Coupons
This is very interesting, You are a very skilled blogger. I ave joined your rss feed and look forward to seeking more of your great post. Also, I have shared your web site in my social networks!
ovusensecoupon
There as definately a lot to find out about this issue. I like all of the points you have made.
PeoriaCharter Coupons
Im obliged for the blog article.Really looking forward to read more.
birkenstock website promo code
Major thankies for the article.Really thank you! Much obliged.
mcgraw hill promo code accounting
Thanks for sharing, this is a fantastic blog article.Much thanks again. Great.
lumber liquidators 20 off coupon
lots up very fast! What host are you the usage of? Can I get
imo's pizza coupons online
Wow, great post.Much thanks again. Fantastic.
shari's berries free shipping code 2019
This part may necessitate the help of a skilled SEO in Los Angeles
classic car wash delta queen
My brother suggested I might like this blog. He was entirely right. This post actually made my day. You cann at imagine just how much time I had spent for this information! Thanks!
lowes 10 coupon code generator
Its hard to find good help I am forever proclaiming that its hard to find quality help, but here is
cox promo code for internet mar
Thanks for the blog post.Thanks Again. Cool.
free shipping proflowers coupon code
Thank you ever so for you post.Thanks Again. Cool.
snapfish free shipping nov 2018
Thanks, I ave been hunting for facts about this topic for ages and yours is the best I ave found so far.
coupon for american eagle printable july
It’аs actually a nice and useful piece of information. I’аm satisfied that you shared this useful information with us. Please keep us up to date like this. Thank you for sharing.
adobedownload
Say, you got a nice post.Thanks Again. Fantastic.
anthony richards coupons 2018
wow, awesome article.Really thank you! Cool.
doctor on demand coupon code 2018
Souls in the Waves Excellent Morning, I just stopped in to visit your site and assumed I would say I loved myself.
Tyler Frascella
Regret for the things we did can be tempered by time; it is regret for the things we did not do that is inconsolable.’ By Sydney J. Harris
hobby lobby free shipping over $59
Some times its a pain in the ass to read what blog owners wrote but this web site is real user friendly!
kohls free shipping mvc no minimum
I was suggested this web site by my cousin. I am not sure whether this post is written by him as nobody else know such detailed about my difficulty. You are incredible! Thanks!
dildo
I am so grateful for your article.Really looking forward to read more. Want more.
salice rose sugar bear hair discount code
Thanks a lot for the article post.Really looking forward to read more. Much obliged.
hismile discount code au
who had been doing a little homework on this. And he actually bought me dinner because I found it for him
Pet Supply Plus Coupon aug
Major thanks for the article post.Really looking forward to read more. Great.
plum paper company discount coupon
Way cool! Some very valid points! I appreciate you writing this post and the rest of the site is also very good.
Displays to go coupon
It as really a cool and useful piece of information. I am glad that you shared this helpful info with us. Please keep us informed like this. Thanks for sharing.
SEO Vancouver
Muchos Gracias for your blog.Much thanks again. Awesome.
first choice haircutters coupons kitchener
Really enjoyed this blog.Really thank you! Fantastic.
east coast wings coupons greenville nc
Your style is so unique in comparison to other folks I have read stuff from. Thanks for posting when you ave got the opportunity, Guess I all just book mark this page.
Byg din egen hundeseng
I truly appreciate this article. Much obliged.
SEO Vancouver
Your style is so unique in comparison to other people I ave read stuff from. Many thanks for posting when you ave got the opportunity, Guess I will just bookmark this web site.
SEO Vancouver
I truly appreciate this post.Really thank you! Keep writing.
sky zone coupon rochester ny
Thanks so much for the article post.Much thanks again. Keep writing.
free people discount code
There is certainly a great deal to find out about this issue. I really like all of the points you ave made.
discount code for jaclyn hill morphe palette
Wow, awesome blog layout! How long have you been blogging for? you made blogging look easy. The overall look of your web site is magnificent, let alone the content!
postmates promo codes $100
Modular Kitchens have changed the very idea of kitchen nowadays since it has provided household females with a comfortable yet a classy place in which they may invest their quality time and space.
omni cheer coupon offer code
This is a topic that is near to my heart Many thanks! Exactly where are your contact details though?
promo codes for peoria charter
I want to be able to write entries and add pics. I do not mean something like myspace or facebook or anything like that. I mean an actual blog..
stubhub discount code first time
Thanks for some other great article. The place else may just anyone get that kind of info in such a perfect means of writing? I have a presentation next week, and I am on the search for such info.
love nikki latest redeem code
Pretty! This has been an extremely wonderful post. Many thanks for supplying these details.
aim surplus free shipping
Only wanna comment that you have a very decent website , I love the design and style it actually stands out.
male masturbator
Major thankies for the blog.Really looking forward to read more. Awesome.
postermywall promo code may 2019
Valuable information. Lucky me I discovered your web site by chance, and I am stunned why this coincidence did not came about earlier! I bookmarked it.
postermywall promo code june 2019
single type of cultural symbol. As with all the assistance
mcgraw hill connect promo code microeconomics
Muchos Gracias for your blog article.Thanks Again. Much obliged.
target sports usa free shipping coupon
Major thankies for the post.Thanks Again. Great.
love nikki dress up queen codes
Really enjoyed this post.Really looking forward to read more. Will read on
colourpop discount code nikkietutorials
Thanks-a-mundo for the post.Really thank you! Cool.
ez contacts coupon code
I value the blog.Really looking forward to read more. Great.
dr colorchip instructions
wow, awesome article.Thanks Again. Great.
waitr promo code may
Way cool! Some very valid points! I appreciate you writing this post and the rest of the site is really good.
g suite business promo code 2018
In the great I always visit your blog everyday to read new topics.,:~-~
roblox promo codes youtube
Thanks-a-mundo for the blog.Really thank you! Will read on
thrift books coupon code november 2018
You made some decent points there. I checked on the internet to learn more about the issue and found most individuals will go along with your views on this website.
michaels custom framing coupon 2019
This page truly has all the info I needed about this subject and didn at know who to ask.
chuck e cheese coupons redding ca
tout est dans la formation video ! < Liked it!
michaels in store coupon 50 off
Very good article. I certainly appreciate this website. Keep writing!
touch up direct llc coupon code
Informative article, exactly what I wanted to find.
bitesquad coupon retailmenot
This particular blog is obviously cool as well as amusing. I have discovered many interesting things out of it. I ad love to go back over and over again. Thanks a lot!
uhaul coupons codes
Very good blog post.Really thank you! Really Great.
promo code for first time using ubereats
Really superb information can be found on site.
real tillys promo codes
Wow, great blog post.Thanks Again. Will read on
ubereats promo code for existing users free delivery
pretty useful material, overall I think this is really worth a bookmark, thanks
shutterfly coupons 2019
Very good article! We are linking to this great content on our website. Keep up the great writing.
burlington coat factory coupon codes
Muchos Gracias for your blog.Really looking forward to read more. Really Cool.
SEO Vancouver
You ave made some good points there. I looked on the net to find out more about the issue and found most individuals will go along with your views on this site.
ebay coupon codes that work india
Wow, awesome blog layout! How long have you been blogging for? you make blogging look easy. The overall look of your website is fantastic, as well as the content!. Thanks For Your article about &.
removals preston
wow, awesome blog article.Thanks Again. Much obliged.
playstation store discount code november 2018
It is hard to uncover knowledgeable individuals with this topic, nonetheless you look like there as extra that you are referring to! Thanks
SEO Vancouver
Only a smiling visitant here to share the love (:, btw outstanding pattern. Make the most of your regrets. To regret deeply is to live afresh. by Henry David Thoreau.
SEO Vancouver
properly, incorporating a lot more colours on your everyday life.
tim viver 14
I wouldn at mind creating a post or elaborating on many of the subjects you write concerning here. Again, awesome weblog!
SEO Vancouver
Thank you ever so for you article post.Really thank you! Great.
teamviewer 14 skachat besplatno na russkom
There is certainly a great deal to find out about this topic. I really like all the points you ave made.
tool hire
Thanks so much for the blog post. Fantastic.
SEO
Very informative article.Much thanks again. Really Cool.
What is SEO
You have already known that coconut oil is not low calorie food however.
kitchen design
Incredible! This blog looks just like my old one! It as on a totally different topic but it has pretty much the same page layout and design. Wonderful choice of colors!
newspaper ad agency in Noida
This unique blog is obviously interesting and besides informative. I have picked helluva helpful things out of it. I ad love to return over and over again. Thanks a lot!
Cathleen
I am a mother and I really needed this info thanks!
SEO Vancouver
This unique blog is really cool and besides informative. I have chosen many interesting advices out of this blog. I ad love to come back over and over again. Thanks!
apps download for pc windows
I was suggested this blog through my cousin. I am now not sure whether this post is written through him as no one else realize such distinctive about my trouble. You are incredible! Thank you!
Free Album Download
Wow, great blog post.Thanks Again. Want more.
SEO Vancouver
is added I get four emails with the same comment.
SEO Vancouver
Thanks for every other fantastic post. Where else may anyone get that type of information in such a perfect way of writing? I have a presentation next week, and I am at the search for such info.
swing set installation service
You have observed very interesting details ! ps nice site. “O human race born to fly upward, wherefore at a little wind dost thou fall.” by Dante Alighieri.
W88 Thai
Spot on with this write-up, I truly suppose this website needs far more consideration. I’ll in all probability be again to learn rather more, thanks for that info.
SEO Vancouver
Woman of Alien Great do the job you have completed, this page is actually interesting with wonderful facts. Time is God as way of keeping every little thing from occurring at once.
bbc world news
o no gratis Take a look at my site videncia gratis
W88
Valuable info. Fortunate me I discovered your web site by chance, and I am stunned why this twist of fate didn’t happened earlier! I bookmarked it.
SEO Vancouver
Wow, marvelous blog format! How lengthy have you ever been blogging for? you made blogging look easy. The total glance of your site is wonderful, let alone the content material!
apk for android download full
Your style is unique in comparison to other folks I have read stuff from. Thanks for posting when you ave got the opportunity, Guess I all just book mark this blog.
SEO Vancouver
This very blog is really entertaining and also diverting. I have picked many interesting tips out of this amazing blog. I ad love to return every once in a while. Thanks a bunch!
부산출장안마
Fantastic website. A lot of useful information here.
I’m sending it to a few friends ans additionally sharing in delicious.
And obviously, thank you in your effort!
SEO Vancouver
Really a nice post. Thx for this article
Virginia braiding salon
Good blog! I really love how it is simple on my eyes and the data are well written. I am wondering how I might be notified whenever a new post has been made. I’ve subscribed to your feed which must do the trick! Have a great day!
Text Chemistry Amy North
Thanks-a-mundo for the post.Really looking forward to read more. Fantastic.
SEO Vancouver
This is a really good tip particularly to those fresh to the blogosphere. Short but very accurate info Appreciate your sharing this one. A must read article!
cafe sedir
Therefore that as why this piece of writing is perfect. Thanks!
SEO Vancouver
Outstanding post but I was wondering if you could write a litte more on this subject? I ad be very grateful if you could elaborate a little bit further. Thank you!
SEO Vancouver
I really liked your post.Really thank you! Awesome.
SEO Vancouver
It as not that I want to duplicate your web site, but I really like the design. Could you let me know which design are you using? Or was it custom made?
SEO Vancouver
It as not that I want to replicate your web site, but I really like the style. Could you let me know which theme are you using? Or was it tailor made?
W88 Mobile
My partner and I absolutely love your blog and find many of your post’s to be exactly what I’m looking for. Would you offer guest writers to write content to suit your needs? I wouldn’t mind creating a post or elaborating on a number of the subjects you write concerning here. Again, awesome website!
SEO Vancouver
Looking forward to reading more. Great article post.Really looking forward to read more. Great.
SEO Vancouver
Im grateful for the blog post.Much thanks again. Much obliged.
Kasino
Valuable information. Lucky me I found your website by accident, and I’m shocked why this accident didn’t happened earlier! I bookmarked it.
cach doi diem viettel
Normally I do not learn article on blogs, however I would like to say that this write-up very pressured me to try and do it! Your writing style has been surprised me. Thank you, quite nice post.
find out more
Thanks a lot for the post.Really thank you! Much obliged.
what is the 21 day flat belly fix tea recipe
Very good blog article.Thanks Again. Really Great.
marketwatch
Regards for this rattling post, I am glad I observed this website on yahoo.
affordable seo services
well happy to share my knowledge here with mates.
Albany Personal Injury Lawyer
I’ve read several just right stuff here. Definitely price bookmarking for revisiting. I surprise how a lot effort you place to create this type of magnificent informative website.
비아그라
I think this is one of the most significant information for me. And i’m glad reading your article. But want to remark on few general things, The site style is wonderful, the articles is really great : D. Good job, cheers
WWW88
One thing is that when you’re searching for a education loan you may find that you will want a co-signer. There are many circumstances where this is correct because you should find that you do not employ a past credit score so the bank will require you have someone cosign the borrowed funds for you. Good post.
furniture assembly handyman
Great – I should certainly pronounce, impressed with your web site. I had no trouble navigating through all the tabs as well as related information ended up being truly easy to do to access. I recently found what I hoped for before you know it in the least. Quite unusual. Is likely to appreciate it for those who add forums or something, site theme . a tones way for your client to communicate. Excellent task.
Alise
you can even cross your pinkies. In about three weeks ago I
Berniece
This is very interesting, You are a very skilled blogger. I ave joined your feed and look forward to seeking more of your fantastic post. Also, I ave shared your web site in my social networks!
district heights braiding salon
hello there and thank you for your information – I have definitely picked up anything new from right here. I did however expertise a few technical issues using this site, since I experienced to reload the web site a lot of times previous to I could get it to load properly. I had been wondering if your web hosting is OK? Not that I am complaining, but slow loading instances times will sometimes affect your placement in google and could damage your high quality score if ads and marketing with Adwords. Anyway I am adding this RSS to my email and can look out for a lot more of your respective fascinating content. Make sure you update this again soon..
WANZ-885
Pretty nice post. I just stumbled upon your blog and wished to say that I have really enjoyed browsing your blog posts. After all I will be subscribing to your feed and I hope you write again soon!
WANZ 892
Very interesting information!Perfect just what I was looking for! аЂааЂ Washington is the only place where sound travels faster than light.аЂ аЂа by C. V. R. Thompson.
Virginia office movers
Hello! This is my first comment here so I just wanted to give a quick shout out and tell you I truly enjoy reading through your posts. Can you recommend any other blogs/websites/forums that cover the same topics? Thanks a ton!
Online Tutor
Thanks so much for the post. Awesome.
Porn sex
Thank you for sharing excellent informations. Your web site is so cool. I am impressed by the details that you’ve on this site. It reveals how nicely you perceive this subject. Bookmarked this website page, will come back for extra articles. You, my pal, ROCK! I found just the info I already searched all over the place and simply couldn’t come across. What an ideal website.
STARS-111
I’ve learned a few important things by means of your post. I will also like to express that there may be situation that you will make application for a loan and never need a co-signer such as a National Student Aid Loan. But when you are getting financing through a standard finance company then you need to be able to have a co-signer ready to enable you to. The lenders may base their decision over a few factors but the main one will be your credit worthiness. There are some lenders that will in addition look at your job history and come to a decision based on that but in almost all cases it will depend on your rating.
puff daddy
I value the blog article.Really thank you! Keep writing.
Adam Eve coupon groupon
Fantastic blog post.Much thanks again.
صيانه غساله زانوسى
It’s difficult to find educated people about this subject,
however, you seem like you know what you’re talking
about! Thanks
Rublennyj dom pod klyuch v Moskve
Music started playing as soon as I opened up this web page, so annoying!
Newspaper advertising agency in delhi
Thank you ever so for you article.Really thank you! Really Cool.
lookup email
Heya i’m for the first time here. I found this board and I find It truly useful & it helped me out a lot. I hope to give something back and help others like you aided me.
banquet halls in queens ny
Fantastic blog.Really thank you! Fantastic.
wedding planning
Hello there, I discovered your web site via Google at the same time as searching for a similar matter, your web site came up, it seems good. I have bookmarked it in my google bookmarks.
buy laptop cables
you ave got an awesome weblog here! would you like to make some invite posts on my weblog?
Singapore Tattoo
wonderful issues altogether, you simply received a new reader. What could you suggest about your publish that you made some days ago? Any certain?
Plasma consumables
obviously like your web-site but you have to take a look at the spelling on quite a few of your posts. A number of them are rife with spelling problems and I in finding it very troublesome to inform the reality on the other hand I will surely come again again.
maze game scary
Pretty! This has been a really wonderful post. Many thanks for supplying this information.
check now
You made some really good points there. I looked on the web for additional information about the issue and found most people will go along with your views on this web site.
joomla dispensary
There is perceptibly a bundle to know about this. I suppose you made some nice points in features also.
Tattoo Shops
I really liked your blog.Much thanks again. Fantastic.
Kickboxing
I think this is a real great article post.Really looking forward to read more. Much obliged.
ปั้มไลค์
Like!! Great article post.Really thank you! Really Cool.
Boost your traffic - Cheap SEO
Way cool! Some very valid points! I appreciate you writing this post plus the rest of the website is extremely good.
ايجي بست
Thanks for the blog.Really looking forward to read more. Really Great.
토토사이트
Im thankful for the article.Thanks Again. Awesome.
affordable seo
physical exam before starting one. Many undersized Robert Griffin Iii Jersey Price
warehouse shelving brisbane
It as very straightforward to find out any matter on net as compared to books, as I found this article at this web page.
the mase game
Major thankies for the article post.Really thank you! Keep writing.
cashmere scarf
My spouse and i have been now satisfied that Edward managed to carry out his inquiry by way of the ideas he came across from your weblog. It’s not at all simplistic just to always be giving away techniques some people could have been selling. Therefore we fully understand we now have the website owner to give thanks to because of that. Most of the explanations you made, the easy web site menu, the relationships your site help create – it’s got many fabulous, and it’s making our son in addition to our family understand this content is brilliant, and that is extraordinarily vital. Thanks for the whole lot!
Office Removal Companies
I view something really special in this internet site.
chat support usa
Definitely, what a great site and enlightening posts, I definitely will bookmark your website.Best Regards!
for more info
Looking forward to reading more. Great blog article.Really thank you! Keep writing.
https://www.youtube.com/
Really enjoyed this post.Really thank you! Keep writing.
for more information
Pretty nice post. I just stumbled upon your weblog and wished to say that I ave really enjoyed browsing your blog posts. In any case I all be subscribing to your feed and I hope you write again soon!
arduino uno pinout
Greetings from Colorado! I’m bored to death at work so I decided to browse your website on my iphone during lunch break. I really like the knowledge you present here and can’t wait to take a look when I get home. I’m amazed at how quick your blog loaded on my phone .. I’m not even using WIFI, just 3G .. Anyways, superb site!
to read more
Some truly prize blog posts on this site, bookmarked.
removal companies surrey
Thanks for sharing, this is a fantastic article post.Much thanks again. Keep writing.
surrey removal companies
You might have some genuine insight. Why not hold some kind of contest for your readers?
search engine marketing for beginners
Outstanding story there. What occurred after? Thanks!
free search engine optimization marketing
Looking forward to reading more. Great blog post.Really looking forward to read more. Much obliged.
메이저토토
Wow, great post.Thanks Again. Awesome.
brightedge competitors
Major thanks for the article post.Thanks Again. Much obliged.
Office furniture installation company
Hello, Neat post. There is a problem together with your site in web explorer, could test this… IE nonetheless is the marketplace chief and a good part of people will omit your magnificent writing due to this problem.
seo experts vancouver
Some genuinely interesting information, well written and broadly user pleasant.
Nigeria Property
was hoping maybe you would have some experience with something like
Office furniture removal
These days of austerity as well as relative anxiousness about getting debt, some people balk up against the idea of utilizing a credit card to make purchase of merchandise as well as pay for any gift giving occasion, preferring, instead only to rely on the actual tried in addition to trusted procedure for making payment – hard cash. However, in case you have the cash there to make the purchase in whole, then, paradoxically, that is the best time just to be able to use the credit cards for several factors.
boost website ranking
I was recommended this web site by my cousin. I am not sure whether this post is written by him as no one else know such detailed about my difficulty. You are incredible! Thanks!
pipe welding positioner
Practical goal rattling great with English on the other hand find this rattling leisurely to translate.
office furniture installation
I think this site has some real wonderful information for everyone. “Dealing with network executives is like being nibbled to death by ducks.” by Eric Sevareid.
pipe positioners
poker bonuses What are the norms of copyright of web content? How as it different from Patent?
Hemp Oil
I precisely had to thank you so much once again. I do not know the things I would have tried in the absence of the actual techniques revealed by you concerning such subject matter. This has been an absolute traumatic condition in my opinion, but considering your specialized mode you solved that took me to weep over delight. I am just happier for the advice and pray you know what a powerful job that you are putting in teaching some other people through the use of your blog. I’m certain you have never encountered all of us.
SEO Vancouver
Wanted to drop a remark and let you know your Feed isnt working today. I tried adding it to my Yahoo reader account but got absolutely nothing.
URE 051
fantastic post, very informative. I wonder why the other experts of this sector don’t notice this. You must continue your writing. I am sure, you have a huge readers’ base already!
tribulus terrestris maca peruana para que serve
I loved your blog post.Really looking forward to read more. Want more.
office cubicle assembly
Admiring the time and energy you put into your website and detailed information you present. It’s great to come across a blog every once in a while that isn’t the same unwanted rehashed information. Excellent read! I’ve bookmarked your site and I’m including your RSS feeds to my Google account.
swing set assembly
Hey! I could have sworn I’ve been to this blog before but after reading through some of the post I realized it’s new to me. Anyhow, I’m definitely delighted I found it and I’ll be book-marking and checking back often!
Art installation service
Terrific post however , I was wondering if you could write a litte more on this topic? I’d be very grateful if you could elaborate a little bit further. Many thanks!
keyword phrase :
I cannot thank you enough for the blog post.Thanks Again. Want more.
Picture hanging company
Well I truly liked reading it. This information offered by you is very helpful for proper planning.
streetwear
I appreciate, cause I found exactly what I was looking for. You’ve ended my 4 day long hunt! God Bless you man. Have a nice day. Bye
TV wall mounting service
I’ve been exploring for a little bit for any high quality articles or weblog posts in this kind of house . Exploring in Yahoo I finally stumbled upon this site. Studying this information So i am satisfied to exhibit that I’ve an incredibly just right uncanny feeling I found out exactly what I needed. I such a lot without a doubt will make certain to do not put out of your mind this web site and provides it a glance on a relentless basis.
EZ Battery Reconditioning Review
I will right away seize your rss as I can at find your email subscription hyperlink or newsletter service. Do you ave any? Please let me realize in order that I could subscribe. Thanks.
SEO Vancouver
Really informative article.Really thank you! Much obliged.
male sex doll
Very good article post.Really thank you! Really Great.
seo checklist moz
Thank you for your blog post.Thanks Again. Fantastic.
�vancouver cell phone�
Im obliged for the article.Really looking forward to read more. Will read on
grab it
Please forgive my English.It as really a great and helpful piece of information. I am glad that you shared this useful info with us. Please stay us informed like this. Thanks for sharing.
the solution
The Birch of the Shadow I think there may perhaps be a few duplicates, but an exceedingly helpful listing! I have tweeted this. Numerous thanks for sharing!
why not find out more
This website was how do you say it? Relevant!! Finally I ave found something that helped me. Many thanks!
money
It as nearly impossible to find well-informed people in this particular subject, however, you sound like you know what you are talking about! Thanks
릴 게임
What i don’t realize is in truth how you are no longer really much more well-preferred than you might be right now. You’re so intelligent. You already know therefore significantly in the case of this topic, produced me individually imagine it from numerous varied angles. Its like women and men are not interested until it’s something to do with Girl gaga! Your own stuffs great. Always take care of it up!
promote your youtube channel in comments
Thank you for the auspicious writeup. It in fact used to be a enjoyment account it. Glance advanced to far delivered agreeable from you! However, how can we communicate?
Any assembly
I’ve recently started a blog, the information you provide on this web site has helped me greatly. Thanks for all of your time & work. “‘Tis our true policy to steer clear of permanent alliances with any portion of the foreign world.” by George Washington.
Tattoo Shop
This awesome blog is without a doubt educating and amusing. I have found a lot of interesting stuff out of this source. I ad love to return again soon. Thanks!
Buy Tramadol Online USA
Major thankies for the blog.Much thanks again. Much obliged.
bathroom
Perfect work you have done, this site is really cool with good info.
know more
please visit the internet sites we adhere to, like this one particular, because it represents our picks in the web
my response
This particular blog is really interesting additionally amusing. I have discovered a bunch of helpful advices out of this blog. I ad love to come back again soon. Thanks!
making real money online
Thank you for the article!! It was very informative and inspiring! The more information we can share, is the wealthier we’ll all be! Wealth is your birthright!! Here’s a great way I found to become financially free via online business : https://bit.ly/2GVrvHp
SEO Vancouver
Very good blog post. I certainly love this website. Keep it up!
Malika Terrezza
https://legal-porno.blogspot.com/2019/05/fist-fucking-wrecked-holes.html
to read more
Thank you for your article post.Really thank you! Much obliged.
fresh memes
What web host are you using? Can I get your affiliate link to your host?
basketball hoop assembly
As I website possessor I believe the content material here is rattling fantastic , appreciate it for your efforts. You should keep it up forever! Good Luck.
mikado.asia
I will immediately grab your rss as I can at find your e-mail subscription link or e-newsletter service. Do you ave any? Please let me know so that I could subscribe. Thanks.
1
Major thanks for the article.Thanks Again. Really Cool.
office desk assembly
I and also my guys ended up reading through the good hints found on your web blog then suddenly got a terrible feeling I never thanked the web blog owner for those strategies. All of the women became absolutely stimulated to read through them and have surely been enjoying them. Thanks for turning out to be quite considerate as well as for making a decision on varieties of important subjects most people are really wanting to discover. Our sincere apologies for not saying thanks to sooner.
Nnu forum�
Very good information. Lucky me I ran across your site by chance (stumbleupon). I have book-marked it for later!
NNU Forum Review & My 6 Special Bonuses for first 100 people
I’аve learn some excellent stuff here. Definitely value bookmarking for revisiting. I wonder how so much effort you set to make this kind of great informative web site.
dich vu livestream
Wonderful read! I ave saved your site and I am including your RSS feeds
bouncy castle service in hammersmith area
Im thankful for the post.Thanks Again.
w88 forbidden
I will right away grasp your rss as I can not to find your email subscription link or e-newsletter service. Do you have any? Kindly permit me recognise so that I may subscribe. Thanks.
WANZ-892,
I enjoy you because of your whole hard work on this website. My daughter enjoys setting aside time for investigation and it’s simple to grasp why. Most people know all regarding the powerful way you present helpful guidance by means of the web site and recommend response from website visitors about this point so our child is truly starting to learn a great deal. Enjoy the rest of the year. You have been conducting a very good job.
그래프게임
Valuable information. Lucky me I found your website by accident, and I’m shocked why this accident didn’t happened earlier! I bookmarked it.
먹튀폴리스
I have to point out my affection for your kind-heartedness for men and women who really need help with your area. Your special commitment to passing the solution throughout appears to be remarkably beneficial and has really empowered others much like me to get to their ambitions. Your own useful tips and hints indicates this much to me and far more to my office colleagues. With thanks; from all of us.
618Media
Your style is so unique in comparison to other folks I’ve read stuff from. Thank you for posting when you’ve got the opportunity, Guess I’ll just book mark this blog.
1sthoustonpainting.com
I have been surfing online greater than 3 hours as of late, yet I never discovered any fascinating article like yours. It¡¦s lovely worth sufficient for me. In my view, if all site owners and bloggers made excellent content material as you probably did, the internet shall be much more useful than ever before.
Backlink Murah
This website is known as a walk-through for all the info you wanted about this and didn’t know who to ask. Glimpse right here, and you’ll definitely discover it.
Jeffery Cullom
I like what you guys are up also. Such intelligent work and reporting! Carry on the excellent works guys I have incorporated you guys to my blogroll. I think it’ll improve the value of my website
Trigona
I really like and appreciate your article post.Really thank you! Really Great.
먹튀폴리스 사이트
I just couldn’t depart your website before suggesting that I extremely loved the standard info a person supply in your guests? Is gonna be back continuously to inspect new posts.
먹튀폴리스
great issues altogether, you just received a emblem new reader. What might you recommend about your put up that you just made some days in the past? Any positive?
오션파라다이스 게임
Thank you for this article. I’d also like to mention that it can be hard when you are in school and merely starting out to initiate a long credit score. There are many individuals who are merely trying to live and have a protracted or positive credit history are often a difficult issue to have.
New Zealand ETA
Whats up very cool blog!! Guy .. Excellent .. Amazing .. I will bookmark your web site and take the feeds also…I’m happy to seek out a lot of helpful info here in the put up, we’d like develop more techniques in this regard, thank you for sharing.
rummy cards
Thanks for your write-up. My spouse and i have usually observed that almost all people are desperate to lose weight as they wish to look slim in addition to looking attractive. However, they do not often realize that there are more benefits just for losing weight as well. Doctors claim that obese people come across a variety of health conditions that can be directly attributed to their particular excess weight. The great news is that people who’re overweight along with suffering from various diseases are able to reduce the severity of their particular illnesses by way of losing weight. You possibly can see a constant but notable improvement with health whenever even a small amount of weight-loss is realized.
NNU Forum Review & My 6 Special Bonuses for first 100 people
Thankyou for helping out, great info.
murat fedakar
Major thankies for the post. Keep writing.
suelo laminado ac5
I really liked your blog article. Will read on
Long Distance Moving Company
whoah this blog is fantastic i really like studying your articles. Keep up the great paintings! You understand, lots of individuals are searching round for this info, you can aid them greatly.
W88 link vao
You could definitely see your expertise within the work you write. The arena hopes for more passionate writers like you who are not afraid to say how they believe. At all times go after your heart. “The point of quotations is that one can use another’s words to be insulting.” by Amanda Cross.
먹튀 폴리스
You made some respectable factors there. I regarded on the internet for the issue and found most people will associate with together with your website.
guttering and downpipe replacement
Thank you for sharing your thoughts. I really appreciate your efforts and I will be waiting for your next post thanks once again.
먹튀폴리스
Hi there, just became aware of your blog through Google, and found that it is truly informative. I’m gonna watch out for brussels. I will be grateful if you continue this in future. Many people will be benefited from your writing. Cheers!
먹튀다자바
It’s truly a nice and useful piece of info. I am satisfied that you shared this helpful information with us. Please stay us up to date like this. Thank you for sharing.
https://www.linkscholars.com/
just like to say cheers for a remarkable post and a all round interesting blog (I also love the theme/design), I don at have time to look over it all at the
empresa de limpieza mallorca
Please keep us informed like this. Thanks for sharing.
bolsos de mano boda
Its hard to find good help I am constantnly saying that its hard to find good help, but here is
imessage on pc
Wow! Thank you! I always needed to write on my blog something like that. Can I take a fragment of your post to my site?
W88
It’s really a great and useful piece of information. I’m happy that you simply shared this helpful information with us. Please stay us informed like this. Thanks for sharing.
basics
I do accept as true with all the ideas you have offered on your post. They’re very convincing and will certainly work. Nonetheless, the posts are very short for starters. Could you please prolong them a bit from next time? Thank you for the post.
tweakbox apk
Wow! This could be one particular of the most beneficial blogs We have ever arrive across on this subject. Actually Magnificent. I am also an expert in this topic so I can understand your hard work.
garageband for windows
pretty beneficial stuff, overall I feel this is well worth a bookmark, thanks
how to build an email list for free
Really appreciate you sharing this post.
SEO Vancouver
Thanks-a-mundo for the article. Want more.
카지노사이트
Generally I do not read article on blogs, but I wish to say that this write-up very forced me to take a look at and do so! Your writing taste has been surprised me. Thank you, very nice post.
릴게임다운로드
Hey! This post couldn’t be written any better! Reading through this post reminds me of my old room mate! He always kept chatting about this. I will forward this page to him. Pretty sure he will have a good read. Thanks for sharing!
SEO Vancouver
You could definitely see your expertise in the paintings you write. The arena hopes for more passionate writers such as you who are not afraid to say how they believe. All the time follow your heart.
타이탄게임
The Advanced Guide to 무료카지노게임 http://www.ssuncasino.com
search engine optimization
It as not that I want to duplicate your web site, but I really like the design. Could you tell me which design are you using? Or was it tailor made?
SSNI 574
There is evidently a lot to identify about this. I think you made various nice points in features also.
Marketing Vancouver
It as not that I want to replicate your web-site, but I really like the style and design. Could you tell me which style are you using? Or was it custom made?
Vancouver SEO
Wow, fantastic blog structure! How lengthy have you been running a blog for? you made running a blog look easy. The entire glance of your site is excellent, as well as the content material!
tsx
Nice article! Also visit my site about Clomid success stories
Vancouver SEO
Thanks-a-mundo for the article.Thanks Again. Awesome.
musicien
Thank you for all your labor on this website. Betty really likes working on internet research and it is simple to grasp why. Most of us learn all relating to the lively tactic you offer both interesting and useful strategies on this web blog and in addition improve participation from some others on this point while our daughter is without question being taught so much. Have fun with the remaining portion of the new year. You have been conducting a fabulous job.
mens cashmere scarf
What i don’t realize is actually how you’re not actually much more well-liked than you might be now. You are so intelligent. You realize therefore considerably relating to this subject, made me personally consider it from a lot of varied angles. Its like men and women aren’t fascinated unless it is one thing to accomplish with Lady gaga! Your own stuffs outstanding. Always maintain it up!
SEO Vancouver
Wow, incredible blog layout! How long have you been blogging for? you made blogging look easy. The overall look of your web site is great, as well as the content!
kamagra oral jelly australia
Thanks for sharing this excellent piece. Very inspiring! (as always, btw)
Boston Car Service
I value the blog post. Will read on…
buy carded iphone
What sites and blogs do the surfing community communicate most on?
Huntington beach Toyota dealership
You completed a number of good points there. I did a search on the subject matter and found the majority of people will go along with with your blog.
capsa susun mod money apk
I am really impressed with your writing skills as well as with the layout on your blog. Is this a paid theme or did you modify it yourself? Anyway keep up the nice quality writing, it is rare to see a nice blog like this one today..
cerita dewasa seks
Some genuinely interesting info , well written and broadly user genial.
Vancouver seo consultant
Thanks again for the article post. Keep writing.
to learn more
This is a topic that is near to my heart
onewalmartwire.com
Awesome article post. Will read on…
Capri Sun labels
Really appreciate you sharing this blog.Much thanks again. Really Cool.
article on negative interest rates
It as best to participate in a contest for among the best blogs on the web. I all suggest this website!
capsa susun offline
I’m not sure why but this weblog is loading extremely slow for me. Is anyone else having this issue or is it a problem on my end? I’ll check back later and see if the problem still exists.
JAV
It as not that I want to replicate your web-site, but I really like the layout. Could you tell me which theme are you using? Or was it especially designed?
Vancouver SEO
Wow, marvelous blog layout! How long have you been blogging for? you make blogging look easy. The overall look of your site is magnificent, as well as the content!. Thanks For Your article about sex.
Badosa
We can see that we need to develop policies to deal with this trend.
pasos para crear una app android
This is really interesting, You are a very skilled blogger. I have joined your rss feed and look forward to seeking more of your wonderful post. Also, I ave shared your web site in my social networks!
w88club com link moi nhat 2019
You can definitely see your enthusiasm in the work you write. The arena hopes for even more passionate writers like you who are not afraid to mention how they believe. At all times go after your heart. “The most profound joy has more of gravity than of gaiety in it.” by Michel de Montaigne.
seo optimizaciq
This is one awesome post.Much thanks again. Cool.
http://www.reginet.cz/modules.php?name=Your_Account&op=userinfo&username=AmeeFeuers to earn online money
Along with every little thing that appears to be building within this specific subject material, a significant percentage of points of view tend to be very refreshing. Nevertheless, I appologize, because I can not subscribe to your entire strategy, all be it refreshing none the less. It looks to us that your comments are generally not entirely justified and in fact you are yourself not even completely certain of your assertion. In any case I did take pleasure in looking at it.
Judi Slot Online
I think other site proprietors should take this website as an model, very clean and magnificent user friendly style and design, as well as the content. You are an expert in this topic!
먹튀다자바
Attractive portion of content. I simply stumbled upon your website and in accession capital to say that I get actually enjoyed account your blog posts. Anyway I’ll be subscribing in your feeds and even I achievement you get admission to persistently fast.
먹튀폴리스 검증
Hello my friend! I want to say that this post is awesome, nice written and include almost all vital infos. I’d like to see more posts like this.
ww88
My brother recommended I would possibly like this website. He was once entirely right. This publish truly made my day. You can not imagine simply how much time I had spent for this info! Thank you!
ysb88 go to the website
Hi there! I just wanted to ask if you ever have any problems with hackers? My last blog (wordpress) was hacked and I ended up losing a few months of hard work due to no backup. Do you have any solutions to stop hackers?
accounting and tax services for small business
I was recommended this website by my cousin. I am not sure whether this post is written by him as nobody else know such detailed about my trouble. You are amazing! Thanks!
ABP-900
motorcycle accident claims I started creating templates, but I don at know how to make demos in my Joomla website, for my visitors to test them..
Rummy
We’re a group of volunteers and starting a new scheme in our community. Your website provided us with valuable information to work on. You’ve done a formidable job and our whole community will be thankful to you.
ABP 901
Thanks for the article.Thanks Again. Really Great.
CAWD 018
There as definately a lot to find out about this subject. I love all of the points you ave made.
SW-656
Very educating story, saved your site for hopes to read more!
STARS-128
Say, you got a nice article.Really looking forward to read more. Will read on
STARS-122
I Will have to visit again when my course load lets up аАааАТбТТ nonetheless I am taking your Rss feed so i could read your web blog offline. Thanks.
STARS 120
I think you have mentioned some very interesting points, appreciate it for the post.
STARS 117
There as definately a great deal to know about this topic. I like all the points you have made.
Sepak bola Online
I have been surfing on-line more than three hours as of late, yet I never found any fascinating article like yours. It¡¦s beautiful value sufficient for me. In my opinion, if all webmasters and bloggers made just right content material as you probably did, the web might be a lot more useful than ever before.
ww88
Some truly nice and utilitarian info on this web site, besides I believe the design and style has got great features.
yellow pages New Zealand
This is one awesome blog article.Much thanks again. Fantastic.
website laten maken
Thank you for any other informative site. The place else could I get that kind of information written in such an ideal approach? I’ve a project that I’m just now running on, and I’ve been at the look out for such information.
how to garden pdf
Thanks for expressing your ideas. Something is that college students have an option between fed student loan and also a private education loan where it truly is easier to decide on student loan consolidating debts than in the federal education loan.
security scissor gates
Thank you, I have recently been searching for info about this topic for ages and yours is the greatest I have discovered so far. But, what about the bottom line? Are you sure about the source?
แทงบอลไม่มีขั้นต่ำ
I cannot thank you enough for the blog post.Thanks Again. Want more.
제주도출장마사지
This is a topic that is near to my heart… Best wishes!
Where are your contact details though?
ww88
I have recently started a web site, the info you provide on this website has helped me greatly. Thanks for all of your time & work. “‘Tis our true policy to steer clear of permanent alliances with any portion of the foreign world.” by George Washington.
comprar pokemon
Great write-up, I am regular visitor of one¡¦s web site, maintain up the nice operate, and It is going to be a regular visitor for a lengthy time.
tax services near me
Whoa. That was a fantastic short article. Please keep writing for the reason that I like your style.
philosophy
These days of austerity plus relative stress about taking on debt, many people balk up against the idea of having a credit card in order to make acquisition of merchandise as well as pay for a vacation, preferring, instead only to rely on a tried as well as trusted procedure for making repayment – raw cash. However, in case you have the cash there to make the purchase completely, then, paradoxically, this is the best time for you to use the credit card for several good reasons.
lets see
I think other web site proprietors should take this website as an model, very clean and magnificent user genial style and design, as well as the content. You are an expert in this topic!
important source
Some genuinely choice articles on this internet site , saved to bookmarks.
tax evasion help
Right from this article begin to read this blog. Plus a subscriber:D
hotmail login
Wow, great blog.Really looking forward to read more. Want more.
obras y reformas las palmas
Simply a smiling visitant here to share the love (:, btw outstanding design. He profits most who serves best. by Arthur F. Sheldon.
cerita dewasa selingkuh
I?d must test with you here. Which isn at one thing I often do! I take pleasure in studying a put up that may make individuals think. Additionally, thanks for permitting me to remark!
Nonton Anime
In this grand scheme of things you actually secure an A+ for effort. Where exactly you lost me ended up being on all the facts. As it is said, the devil is in the details… And that couldn’t be much more correct at this point. Having said that, permit me tell you exactly what did deliver the results. The text is definitely really powerful which is probably why I am taking an effort to opine. I do not make it a regular habit of doing that. Next, although I can notice the leaps in reasoning you make, I am not really sure of exactly how you seem to connect the details which help to make your conclusion. For now I will, no doubt subscribe to your position however hope in the near future you link your facts better.
Bad security company
Merely wanna comment that you have a very decent site, I like the style and design it really stands out.
w88kr
Real nice pattern and excellent content , practically nothing else we need : D.
hmrc code of practice 8
Precisely what I was searching for, thanks for posting. Every failure is a step to success by William Whewell.
nfl computer ats picks
I’ve learn some just right stuff here. Certainly value bookmarking for revisiting. I surprise how a lot effort you put to create such a great informative web site.
free dvds adameve
I really like and appreciate your blog post.Really looking forward to read more.
먹튀 사이트
Absolutely pent subject material, Really enjoyed looking at.
سایت بتودیر
Outstanding post but I was wondering if you could write a litte more on this topic? I’d be very thankful if you could elaborate a little bit more. Many thanks!
สมัครแทงบอลออนไลน์ได้ที่นี่
Really appreciate you sharing this blog.Really looking forward to read more. Will read on…
SEO Vancouver
I think this is a real great blog.Really looking forward to read more. Really Great. ventolin
SEO Consultant Vancouver
Im thankful for the post.Much thanks again. Really Great.
W88
Attractive section of content. I just stumbled upon your website and in accession capital to assert that I get in fact enjoyed account your blog posts. Anyway I will be subscribing to your feeds and even I achievement you access consistently quickly.
SEO Vancouver
I think other web-site proprietors should take this web site as an model, very clean and excellent user friendly style and design, let alone the content. You are an expert in this topic!
tirage tarot divinatoire gratuit
Thanks so much for the article post. Keep writing.
Capital
Just wanna admit that this is handy , Thanks for taking your time to write this.
Vidmate
Somebody necessarily lend a hand to make seriously posts I might state. That is the first time I frequented your website page and up to now? I surprised with the analysis you made to create this actual publish extraordinary. Excellent activity!
오션파라다이스 게임
After I initially commented I clicked the -Notify me when new comments are added- checkbox and now every time a comment is added I get 4 emails with the identical comment. Is there any way you possibly can take away me from that service? Thanks!
โต๊ะบอลถูกกฎหมาย
I think this is a real great article post.Really thank you! Want more.
Back at you Reece
Just what I was looking for, regards for posting.
extended vehicle warranty pricing
Travel view of Three Gorges | Wonder Travel Blog
capsa banting
I am really enjoying the theme/design of your site. Do you ever run into any web browser compatibility issues? A number of my blog audience have complained about my website not working correctly in Explorer but looks great in Opera. Do you have any suggestions to help fix this issue?
Fleece Vest Manufacturers Bangladesh
there are actually many diverse operating systems but of course i ad nonetheless favor to utilize linux for stability,.
bouncy castle hire prices Bexley
A round of applause for your article.Really thank you! Cool.
123movies
I simply could not go away your website before suggesting that I extremely loved the usual info an individual provide for your guests? Is going to be back steadily to check out new posts
ve sinh cong nghiep
We stumbled over here by a different page and thought I might check things out. I like what I see so now i am following you. Look forward to looking at your web page for a second time.
Website Design Vancouver
Really appreciate you sharing this article. Really Cool.
caroline_de_jaie
I am 77 years old how can I get more information?
seo consultant
pretty helpful material, overall I imagine this is worth a bookmark, thanks
online musical instruments
Your style is very unique in comparison to other people I have read stuff from. Thank you for posting when you have the opportunity, Guess I all just bookmark this page.
to read more
Well I definitely liked reading it. This information procured by you is very effective for correct planning.
click here
Wow, incredible blog format! How lengthy have you ever been running a blog for? you make blogging look easy. The whole glance of your website is great, as well as the content!
for more info
Looking forward to reading more. Great article post.Really looking forward to read more.
eyeglasses
That is a good tip especially to those fresh to the blogosphere. Brief but very accurate information Appreciate your sharing this one. A must read article!
to read more
Pretty! This has been an extremely wonderful post. Many thanks for providing this information.
nyc extinguisher inspection
I think this is a real great article post.Much thanks again. Keep writing.
cryptocurrency journey
Thank you ever so for you blog article. Much obliged.
denver auto injury attorney
A round of applause for your blog.Really looking forward to read more. Want more.
American Airlines Flight Status
Whispering Misty So sorry you are going to pass up the workshop!
noi that go cong nghiep
I think this is a real great article post.Thanks Again. Great.
AGAV-003
Im thankful for the blog article.Really looking forward to read more. Really Cool.
Lock Repair & Replacement Manly
It as nearly impossible to find well-informed people about this topic, however, you sound like you know what you are talking about! Thanks
health and safety consultancy
It’s really a great and helpful piece of information. I’m glad that you shared this helpful information with us. Please keep us up to date like this. Thanks for sharing.
Stevcliele
Levaquin Ups Internet Next Day Cialis Belgique Allemagne vardenafil vs viagra Quel Site Acheter Cialis
TIKF-037
It as actually a great and helpful piece of info. I am happy that you shared this useful information with us. Please stay us up to date like this. Thank you for sharing.
MYBA-014
Very neat article post.Thanks Again. Will read on
HOMA-071
Yahoo results While browsing Yahoo I found this page in the results and I didn at think it fit
TBF Financial reviews
wow, awesome article. Really Cool.
milfs in dessous
Thanks so much for sharing the info.
SDJS-034
This is one awesome post.Thanks Again. Will read on…
what is 9apps
Excellent read, I just passed this onto a colleague who was doing a little research on that. And he actually bought me lunch since I found it for him smile Thus let me rephrase that: Thanks for lunch!
Felecia Deraney
Nice post. I learn something totally new and challenging on websites I stumbleupon on a daily basis. It’s always helpful to read content from other authors and use something from other web sites.
Sell stolen things
Thanks for another informative blog. Where else could I get that type of information written in such a perfect way? I’ve a project that I am just now working on, and I have been on the look out for such info.
ABP-902
I as well as my guys have been digesting the excellent key points located on your site and then unexpectedly I had an awful feeling I never expressed respect to the web site owner for those secrets. Most of the young men are already totally warmed to learn them and now have honestly been using them. I appreciate you for really being considerably helpful and also for obtaining varieties of incredibly good guides most people are really needing to be aware of. Our own sincere apologies for not saying thanks to you earlier.
strap on harness
I think this is a real great blog.Thanks Again. Awesome.
SAP C_TADM55A_75 certification
Very informative blog article.Thanks Again. Really Great.
cerita sek dewasa
That is a really good tip especially to those fresh to the blogosphere. Simple but very accurate info Many thanks for sharing this one. A must read post!
donde comprar banderas del mundo
Really appreciate you sharing this article post.Really looking forward to read more. Much obliged.
bañadores de niños on line
personal war first presumably was Li Xuan Ba or flowed a breeze star?Caesar as if deep in thought
interiorismo alicante
your website and keep checking for new details about once per week.
Workout Tips
Magnificent beat ! I wish to apprentice while you amend your site, how could i subscribe for a blog website? The account aided me a acceptable deal. I had been tiny bit acquainted of this your broadcast provided bright clear idea
diseño de toldos
I really liked your blog.Really looking forward to read more. Will read on
Animation Explainer Video
Another important component is that if you are an elderly person, travel insurance pertaining to pensioners is something you must really contemplate. The old you are, greater at risk you will be for getting something poor happen to you while overseas. If you are certainly not covered by many comprehensive insurance policy, you could have many serious issues. Thanks for giving your advice on this web blog.
telefono de uber monterrey
if you are if you are in an apartment that is confined, then folding tables would be very well suited for you;;
thepredictiontracker.com
Simply wanna admit that this is very beneficial , Thanks for taking your time to write this.
autos usados mazda monterrey
Really informative article.Much thanks again. Much obliged.
DCSsystems
Hi, I do think your web site might be having browser compatibility problems. Whenever I look at your website in Safari, it looks fine but when opening in IE, it has some overlapping issues. I just wanted to give you a quick heads up! Apart from that, excellent site!
cursos de produccion musical chile
Simply wanna input on few general things, The website pattern is perfect, the content is rattling fantastic. аЂаThe way you treat yourself sets the standard for others.аЂа by Sonya Friedman.
usps liteblue
There are some interesting deadlines in this article but I don’t know if I see all of them middle to heart. There’s some validity but I’ll take hold opinion till I look into it further. Good article , thanks and we want extra! Added to FeedBurner as nicely
great post to read
Your style is unique compared to other folks I have read stuff from. I appreciate you for posting when you ave got the opportunity, Guess I will just bookmark this page.
assembly handyman DC
Thank you, I have just been searching for info about this topic for a long time and yours is the best I’ve found out till now. However, what about the conclusion? Are you sure in regards to the source?
Jogger Manuf
We stumbled over here from a different site and thought I should check things out. I such as what My partner and i see so i am just following anyone. Look forwards to looking at your site repeatedly.
Carpets London
Hi my friend! I want to say that this post is awesome, great written and come with approximately all important infos. I would like to peer extra posts like this.
empresas instaladoras de camaras de videovigilancia
Thanks again for the article post.Really looking forward to read more. Want more.
check here
Very good article. I am dealing with many of these issues as well..
jasa pindahan
Great web site. Plenty of helpful info here. I am sending it to a few friends ans additionally sharing in delicious. And naturally, thanks to your effort!
asociación abogados responsabilidad civil
The Birch of the Shadow I believe there may be a couple of duplicates, but an exceedingly useful listing! I have tweeted this. Many thanks for sharing!
KweenMothaHair
Saved as a favorite, I love your website.
Relationship
You ave made some good points there. I looked on the internet for more information about the issue and found most individuals will go along with your views on this site.
nackt selfi milf
https://legal-porno.blogspot.com/2019/05/multiple-bad-dragon-creampies.html
SEO Vancouver
Very nice info and right to the point. I am not sure if this is really the best place to ask but do you people have any thoughts on where to hire some professional writers? Thanks
Free ebooks
I think this is among the most vital info for me. And i’m glad reading your article. But wanna remark on few general things, The web site style is wonderful, the articles is really nice : D. Good job, cheers
fast payday loans
F*ckin’ awesome things here. I’m very happy to see your post. Thank you a lot and i am having a look forward to contact you. Will you kindly drop me a e-mail?
seo dashboard report miami
Very nice article and straight to the point. I don at know if this is actually the best place to ask but do you folks have any thoughts on where to employ some professional writers? Thanks
SEO
Really informative article post.Thanks Again. Will read on
spy camera pen
You have brought up a very fantastic points , thanks for the post.
HealthBuks
After going over a number of the blog articles on your web page, I truly appreciate your way of writing a blog. I saved it to my bookmark website list and will be checking back soon. Please visit my website as well and let me know how you feel.
Dulles airport cab
Wow! This can be one particular of the most helpful blogs We have ever arrive across on this subject. Basically Excellent. I’m also a specialist in this topic so I can understand your effort.
mercedes repair shop
Lovely website! I am loving it!! Will be back later to read some more. I am taking your feeds also.
DCA car service
Wow, fantastic weblog structure! How long have you ever been running a blog for? you made running a blog look easy. The total look of your site is excellent, let alone the content material!
nicehash minergate 2019
I really liked your post.Really looking forward to read more. Keep writing.
ASQ Certified Quality Inspector
Some times its a pain in the ass to read what blog owners wrote but this site is really user genial !.
flat
There’s noticeably a bundle to find out about this. I assume you made certain good factors in options also.
Building Contractor secrets
Nice blog here! Also your web site loads up fast! What web host are you using? Can I get your affiliate link to your host? I wish my website loaded up as fast as yours lol
eBay
I’ve been absent for a while, but now I remember why I used to love this website. Thank you, I will try and check back more frequently. How frequently you update your web site?
#hair #tutorial #new hairstyle 2018 girl
Hey, you used to write great, but the last several posts have been kinda boring¡K I miss your great writings. Past few posts are just a little bit out of track! come on!
TSX
placing the other person as website link on your page at appropriate place and other person will also do similar in support of you.
penis ring
I value the blog.Really looking forward to read more. Much obliged.
jewelry store in hollywood fl
When I originally commented I clicked the -Notify me when new comments are added- checkbox and now each time a remark is added I get four emails with the same comment. Is there any means you may take away me from that service? Thanks!
top dollar
Have you ever thought about including a little bit more than just your articles? I mean, what you say is fundamental and all. However think of if you added some great graphics or video clips to give your posts more, “pop”! Your content is excellent but with pics and videos, this blog could definitely be one of the very best in its niche. Fantastic blog!
Logo Designing
Hey very cool website!! Man .. Beautiful .. Amazing .. I’ll bookmark your site and take the feeds also…I am happy to find so many useful information here in the post, we need develop more strategies in this regard, thanks for sharing. . . . . .
how to use ben wa balls
Thanks again for the article post. Really Great.
Watch Presidents Cup live stream online free
Hello There. I found your blog using msn. This is a very well written article. I will be sure to bookmark it and return to read more of your useful information. Thanks for the post. I will definitely comeback.
ledmaskofficial
May I just say what a comfort to discover somebody that genuinely knows what they’re talking about online. You definitely understand how to bring an issue to light and make it important. More people ought to read this and understand this side of your story. I was surprised you aren’t more popular since you certainly possess the gift.
ikea furniture assembly handyman
I think other website proprietors should take this site as an model, very clean and magnificent user friendly style and design, as well as the content. You’re an expert in this topic!
recliners for tall people,recliners for tall people
I am so grateful for your blog post.Really thank you!
t-rex chrome offline game
very few sites that come about to become detailed below, from our point of view are undoubtedly nicely really worth checking out
GVG 946
Really informative article post.Really thank you! Want more.
GVG-947
Thanks-a-mundo for the blog article. Keep writing.
YMDD-167
Very neat article.Really looking forward to read more. Keep writing.
Home Tutor Jamshedpur
I think this is a real great blog article.Really looking forward to read more. Cool.
scansunshine
I was extremely pleased to discover this site. I wanted to thank you for ones time for this fantastic read!! I definitely savored every bit of it and I have you saved to fav to see new stuff in your site.
MMUS 036
This very blog is no doubt awesome additionally amusing. I have found many interesting stuff out of this source. I ad love to go back again and again. Cheers!
SnapGirl21
21 f with nudes add me on snapchat LanaShows https://bit.ly/2lBlVSM
MMKZ 066
Nice blog here! Also your website loads up fast! What host are you using? Can I get your affiliate link to your host? I wish my web site loaded up as fast as yours lol
SEO in Vancouver
This excellent website truly has all the information and facts I needed about this subject and didn at know who to ask.
Beehives
I really liked your blog.Really looking forward to read more. Much obliged.
https://www.udemy.com/topic/excel/?sort=price-low-to-high&closedCaptionAvailable=undefined&quizAvailable=undefined&codingExerciseAvailable=undefined&persist_locale&locale=it_IT
I needed to draft you that very little remark to help give many thanks over again for those awesome guidelines you have discussed here. It has been remarkably open-handed with people like you to offer easily what numerous people could possibly have marketed as an e book in making some bucks for their own end, especially since you could possibly have tried it in the event you considered necessary. The points additionally acted to provide a good way to understand that the rest have the identical desire much like my very own to figure out much more in terms of this problem. I am certain there are some more fun situations in the future for individuals who read through your website.
https://powerexcel.it/
I really enjoy studying on this site, it holds good articles . “A man of genius has been seldom ruined but by himself.” by Samuel Johnson.
SEO
Sweet blog! I found it while searching on Yahoo News. Do you have any suggestions on how to get listed in Yahoo News? I’ve been trying for a while but I never seem to get there! Many thanks
desk assembly handyman
Only wanna remark that you have a very decent web site , I like the style it actually stands out.
메이저 사이트
Whats Going down i am new to this, I stumbled upon this I have discovered It absolutely useful and it has helped me out loads. I hope to give a contribution & help different customers like its aided me. Good job.
free vbucks season 9 now
I have taken notice that in digital camera models, extraordinary receptors help to maintain focus automatically. The sensors regarding some digital cameras change in in the area of contrast, while others start using a beam associated with infra-red (IR) light, specially in low lighting. Higher standards cameras at times use a mixture of both models and probably have Face Priority AF where the digicam can ‘See’ a face while keeping focused only on that. Thank you for sharing your opinions on this site.
Find Out More
I like what you guys are up too. This kind of clever work and coverage! Keep up the amazing works guys I’ve added you guys to our blogroll.
forex
Terrific work! This is the type of information that should be shared around the internet. Shame on the search engines for not positioning this post higher! Come on over and visit my web site . Thanks =)
liteblue login
Enjoyed every bit of your post.Much thanks again. Keep writing.
cbd oil for pain
You have observed very interesting points ! ps nice web site . “Justice is the truth in action.” by Jeseph Joubert.
릴게임
I do agree with all of the ideas you’ve presented in your post. They are really convincing and will definitely work. Still, the posts are too short for newbies. Could you please extend them a little from next time? Thanks for the post.
jrcreations
Sweet blog! I found it while browsing on Yahoo News. Do you have any suggestions on how to get listed in Yahoo News? I’ve been trying for a while but I never seem to get there! Appreciate it
Virginia furniture installation
Thanks for these pointers. One thing I also believe is always that credit cards supplying a 0% apr often attract consumers in zero interest, instant endorsement and easy on the net balance transfers, however beware of the most recognized factor that will probably void the 0% easy neighborhood annual percentage rate as well as throw anybody out into the bad house rapidly.
Lukasiewicz
Very interesting subject , regards for putting up. “The reason people sweat is so they won’t catch fire when making love.” by Don Rose.
lüftungsanlage
My wife and i ended up being absolutely ecstatic that Peter managed to carry out his basic research through your ideas he made in your web pages. It’s not at all simplistic to just possibly be giving for free information and facts most people might have been trying to sell. So we fully grasp we need you to give thanks to because of that. All the illustrations you’ve made, the simple site navigation, the friendships you can help foster – it’s got everything incredible, and it’s really making our son and our family imagine that the content is pleasurable, and that’s extraordinarily essential. Thank you for all!
elitetorrent
certainly like your website however you need to check the spelling on quite a few of your posts. A number of them are rife with spelling issues and I to find it very bothersome to inform the truth on the other hand I will surely come back again.
pirate ship bounce house
Fantastic blog.Really looking forward to read more. Really Cool.
안전공원
After I initially commented I clicked the -Notify me when new feedback are added- checkbox and now each time a comment is added I get 4 emails with the identical comment. Is there any method you can remove me from that service? Thanks!
SSNI 582
Very good blog.Thanks Again. Really Cool.
gomovies
Really enjoyed this blog article.Really looking forward to read more. Much obliged.
principales sintomas de la menopausia
Thanks so much for the post.Much thanks again. Fantastic.
commercial property maintenance service
You have mentioned very interesting details ! ps decent internet site. virtual private server | virtual private server |
buy weed in bulk
Im grateful for the article post.Thanks Again. Really Great.
google dino game
Major thankies for the post. Really Great.
watch anime hd
Very interesting subject , appreciate it for putting up. Welcome to President Bush, Mrs. Bush, and my fellow astronauts. by Dan Quayle.
sports are free xyz
You have brought up a very fantastic details , appreciate it for the post.
seehd download for pc
Thanks so much for the blog post.Really thank you! Will read on
kissanime app free download
Nice post! Also visit my blog about Clomid success stories
child porn
animal porn child porn buy hacklink porn
apk android download
Wow! Thank you! I continuously needed to write on my website something like that. Can I implement a fragment of your post to my blog?
pc games full version download
This is one awesome post.Much thanks again. Much obliged.
lista iptv
I really like and appreciate your blog. Cool.
latest apk for pc download
We are a group of ?oluntаА аЂаers аА аЂаnd starting a
cerita dewasa 2018
whoah this blog is excellent i love reading your posts. Keep up the great work! You know, a lot of people are searching around for this info, you could aid them greatly.
Tractor Workshop Manuals
Substantially, the post is really the sweetest on that worthw hile topic. I fit in with your conclusions and will thirstily look forward to your next updates. Saying thanks will not just be enough, for the phenomenal clarity in your writing. I will certainly at once grab your rss feed to stay abreast of any kind of updates. Good work and also much success in your business efforts!
app download for pc
This is a topic that as near to my heart Best wishes! Where are your contact details though?
different ukulele sizes
I truly appreciate this post. I have been looking all over for this! Thank goodness I found it on Bing. You have made my day! Thanks again
apk free download for pc windows
This website was how do you say it? Relevant!! Finally I ave found something that helped me. Many thanks!
pc games for windows 7
Only wanna remark that you have a very nice site, I the layout it actually stands out.
app download for pc
This excellent website truly has all of the information and facts I needed concerning this subject and didn at know who to ask.
Tractor Workshop Manuals
you have a fantastic weblog right here! would you like to make some invite posts on my blog?
apps download for pc windows
Looking forward to reading more. Great post.
legit carding forums
what is the best free website to start a successful blogg?
animal porn
animal porn child porn buy hacklink porn
apk for android download full
Wow! This could be one of the most beneficial blogs we have ever come across on thesubject. Basically magnificent info! I am also a specialist in this topic so I can understand your effort.
먹튀폴리스 검증
you’re in point of fact a just right webmaster. The web site loading speed is amazing. It sort of feels that you’re doing any distinctive trick. In addition, The contents are masterwork. you’ve done a fantastic activity on this matter!
먹튀 검증
You made some respectable points there. I regarded on the internet for the difficulty and located most people will associate with together with your website.
cvv dumps
You ave made some decent points there. I checked on the web to learn more about the issue and found most individuals will go along with your views on this website.
games for pc download
I?аАТаЂаll right away grasp your rss feed as I can not to find your e-mail subscription link or newsletter service. Do you ave any? Kindly permit me recognize so that I could subscribe. Thanks.
warehouses in aurora co
Very neat article.Much thanks again. Much obliged.
apk full version download
I’аve read several good stuff here. Certainly value bookmarking for revisiting. I surprise how so much effort you place to create the sort of great informative website.
animal porn
buy hacklink animal porn google buy hacklink
mobdro apps for pc
Thank you ever so for you article. Great.
apk free download for pc windows
magnificent issues altogether, you simply gained a new reader. What would you recommend about your put up that you simply made some days ago? Any certain?
flenix apk download for pc
please go to the web sites we follow, like this one particular, as it represents our picks through the web
Hotels Düsseldorf Altstadt
I delight in, result in I found just what I was taking a look for. You have ended my four day lengthy hunt! God Bless you man. Have a great day. Bye
메이저놀이터
As soon as I found this site I went on reddit to share some of the love with them.
chatib download for pc windows 7
pretty valuable material, overall I believe this is well worth a bookmark, thanks
movie rulz for pc
Way cool! Some extremely valid points! I appreciate you writing this write-up and the rest of the website is also very good.
apk android download
Inspiring quest there. What occurred after? Take care!
cashmere scarf
I’m not sure exactly why but this weblog is loading incredibly slow for me. Is anyone else having this problem or is it a issue on my end? I’ll check back later on and see if the problem still exists.
buttonbass for pc download
to discover his goal then the achievements will be
cashmere scarf
I like what you guys are up too. Such clever work and reporting! Keep up the excellent works guys I’ve incorporated you guys to my blogroll. I think it will improve the value of my site :).
Emelia Burckhard
An intriguing discussion is worth comment. I think that you should publish more on this subject, it may not be a taboo matter but typically people don’t talk about these issues. To the next! Many thanks.
함안출장업소
Hi friends, its enormous piece of writing concerning
educationand entirely defined, keep it up all the time.
apk latest version download
I truly enjoаАааБТe? reading it, you could be a great author.
9anime for pc
Incredible points. Sound arguments. Keep up the great spirit.
enviar mensajes masivos whatsapp
Usually I don at read post on blogs, but I would like to say that this write-up very forced me to try and do so! Your writing style has been amazed me. Thanks, quite nice post.
cashmere scarf
Hi, i think that i noticed you visited my site so i came to “return the prefer”.I am attempting to in finding issues to enhance my web site!I suppose its adequate to make use of a few of your concepts!!
Camellia Philps
As I web site possessor I believe the content matter here is rattling fantastic , appreciate it for your efforts. You should keep it up forever! Best of luck.
tucotraffic
21 f with nudes add me on snapchat LanaShows
SEO Case Study
There is perceptibly a lot to realize about this. I feel you made various nice points in features also.
cashmere scarf
I wish to express appreciation to the writer for rescuing me from such a instance. Just after scouting through the the web and seeing things which are not beneficial, I thought my entire life was well over. Existing devoid of the answers to the issues you have sorted out by means of the short article is a crucial case, as well as ones which could have adversely damaged my career if I had not noticed your web blog. That mastery and kindness in playing with every aspect was tremendous. I’m not sure what I would’ve done if I had not come upon such a solution like this. I’m able to at this moment look forward to my future. Thank you so much for your high quality and sensible help. I will not be reluctant to recommend your site to anybody who needs counselling on this subject.
Kimberely
to come here and visit more often. Did you hire out a developer to create your theme?
Michaelvar
cheap prednisolone
Charlesfug
propecia for sale online
buy hacklink
google buy hacklink animal porn
Maryland Office Cubicle Installation
One important thing is that if you are searching for a student loan you may find that you will want a cosigner. There are many scenarios where this is correct because you could find that you do not have a past credit score so the bank will require you have someone cosign the borrowed funds for you. Thanks for your post.
buy watch
Keep up the wonderful piece of work, I read few blog posts on this web site and I believe that your site is real interesting and has got bands of wonderful information.
Love
Some really nice stuff on this site, I it.
tvplayerlatino download for pc
Very neat article.Thanks Again. Awesome.
Aaronaporb
http://advair.us.com/ – order advair online
Meagan
This awesome blog is no doubt entertaining as well as diverting. I have found many handy tips out of this blog. I ad love to come back again and again. Thanks a lot!
BennyLOORA
avodart 0.5 mg
Michaelvar
propranolol 80mg
Mp3 Juices
Nice post. I was checking constantly this blog and I am inspired! Extremely useful info particularly the remaining part 🙂 I handle such info a lot. I used to be looking for this certain information for a very lengthy time. Thanks and good luck.
Charlesfug
atenolol chlorthalidone
get.droidadmin com
When I look at your website in Ie, it looks fine but when opening in Internet Explorer, it has some overlapping.
Margherita
When I look at your blog site in Firefox, it looks fine but when opening in Internet Explorer, it has some
Hainley
I like what you guys are up too. Such intelligent work and reporting! Keep up the superb works guys I have incorporated you guys to my blogroll. I think it will improve the value of my website 🙂
emoji photo editor apk download for pc
Merely wanna admit that this is extremely helpful, Thanks for taking your time to write this.
C_TBW50H_75 Exam Questions
My brother suggested I might like this website. He was entirely right. This post truly made my day. You can not imagine simply how much time I had spent for this info! Thanks!|
best seo services canada
What as Going down i am new to this, I stumbled upon this I ave
Aaronaporb
http://doxycycline-online.com/ – buy doxycycline without prescription
BennyLOORA
amoxicillin online canada
Michaelvar
atenolol price
search engine optimization consultants
If you wish for to take a great deal from this paragraph then you
DC furniture assembly
I as well as my pals were actually looking through the good pointers found on your site and then before long I had an awful suspicion I never expressed respect to you for those techniques. The young boys are already certainly happy to see them and have clearly been loving them. Appreciate your turning out to be indeed thoughtful and for having varieties of superb ideas millions of individuals are really eager to understand about. Our own sincere apologies for not expressing appreciation to you earlier.
Charlesfug
cheap generic cialis online
"target cost-per-acquisition (cpa), which factors in auction-time signals
I want to encourage you to continue your great posts, have a nice holiday weekend!
Masternode
I used to be able to find good info from your articles.
Jncia
Wow, great article post.Really thank you! Really Cool.
canlı sikiş
canlı sikiş izle crovu canlı porno
seo web design
My brother recommended I might like this web site. He was totally right. This post actually made my day. You can not imagine simply how much time I had spent for this information! Thanks!
Aaronaporb
http://lisinopril2.com/ – lisinopril
White glove furniture delivery
Good site! I truly love how it is easy on my eyes and the data are well written. I am wondering how I might be notified when a new post has been made. I have subscribed to your RSS feed which must do the trick! Have a nice day!
Michaelvar
online erythromycin
BennyLOORA
albuterol atrovent
Virginia furniture assembly service
Hi there, You’ve performed an excellent job. I will certainly digg it and in my opinion suggest to my friends. I’m confident they will be benefited from this web site.
Charlesfug
online cipro
Charlesfug
zithromax price
find more info
This awesome blog is definitely interesting and also amusing. I have picked up a bunch of helpful stuff out of this blog. I ad love to come back again soon. Thanks a bunch!
Kickboxing
My brother recommended I would possibly like this blog.
look at here
Very good article post.Really thank you! Really Cool.
kala travel ukulele soprano
I think you have mentioned some very interesting details , appreciate it for the post.
Dell EMC Data Science Associate Certification
Nice blog here! Also your web site loads up fast! What web host are you using? Can I get your affiliate link to your host? I wish my website loaded up as fast as yours lol
Aaronaporb
http://prednisonebest.us.com/ – prednisone 5 mg tablets
Michaelvar
atenolol medicine
apktime for windows 7
Wow! Thank you! I always wanted to write on my site something like that. Can I include a part of your post to my site?
BennyLOORA
sildenafil citrate vs viagra
Charlesfug
proprnolol where to purchase
well hello app for windows 7
Thank you for your article post.Really thank you! Will read on
IINS
This is one awesome blog.Really looking forward to read more. Really Great.
licitaciones de gobierno
pretty valuable stuff, overall I consider this is worth a bookmark, thanks
Lester Deloff
Everything is very open with a clear explanation of the challenges. It was really informative. Your site is extremely helpful. Thank you for sharing.
Michaelvar
finasteride propecia
BennyLOORA
nolvadex tamoxifen
Aaronaporb
http://cephalexinantibiotic.com/ – antibiotic cephalexin
paginas de compra y venta en mexico
Of course, what a splendid website and instructive posts, I definitely will bookmark your website.Have an awsome day!
Charlesfug
buy citalopram
psicologia del deporte
pretty helpful stuff, overall I think this is well worth a bookmark, thanks
kampanjkoder
I’d have to test with you here. Which isn’t one thing I often do! I take pleasure in studying a post that may make folks think. Additionally, thanks for allowing me to comment!
remate de maquinaria en estados unidos
You completed a few fine points there. I did a search on the matter and found mainly people will have the same opinion with your blog.
Aaronaporb
prednisone 20mg tablets
precio de semilla de girasol para siembra
Merely a smiling visitor here to share the love (:, btw outstanding style. аЂааЂ Better by far you should forget and smile than that you should remember and be sad.аЂ аЂа by Christina Georgina Rossetti.
gafas de sol diesel
Thanks again for the blog post.Really looking forward to read more. Great.
annapolis furniture assembly service
I have not checked in here for a while because I thought it was getting boring, but the last few posts are great quality so I guess I’ll add you back to my everyday bloglist. You deserve it my friend 🙂
BennyLOORA
generic tadalafil
Michaelvar
tenormin
satta king desawar 2019
Thanks for the article. My spouse and i have generally seen that a lot of people are desirous to lose weight because they wish to show up slim plus attractive. Nonetheless, they do not generally realize that there are other benefits so that you can losing weight also. Doctors declare that over weight people suffer from a variety of ailments that can be instantly attributed to the excess weight. The great news is that people who’re overweight along with suffering from numerous diseases can help to eliminate the severity of their illnesses by simply losing weight. It’s possible to see a steady but notable improvement with health when even a moderate amount of weight reduction is realized.
Aaronaporb
http://doxycycline100mgacne.com/ – doxycycline
Charlesfug
albuterol 90 mcg inhaler
http://xxxporndays.com/
Appreciate you sharing, great blog. Want more.
Charlesfug
generic zoloft price
BennyLOORA
hctz no prescription
Michaelvar
clonidine hydrochloride
Aaronaporb
http://nolvadextamoxifen.com/ – buy nolvadex tamoxifen citrate
C_HANATEC_14 Study Guide
Thanks for writing such a good article, I stumbled onto your website and read a few articles. I like your way of writing
Charlesfug
tadalafil
rental car vietnam
market which can be given by majority in the lenders
Michaelvar
generic for benicar 20 mg
BennyLOORA
cafergot online
anzzi shower faucets
This is a really good tip particularly to those new to the blogosphere. Brief but very accurate information Thank you for sharing this one. A must read article!
Aaronaporb
http://cafergotbest.us.org/ – clicking here
Virginia furniture installation
Nice weblog right here! Additionally your web site lots up fast! What host are you the use of? Can I am getting your associate link in your host? I desire my site loaded up as fast as yours lol
Virginia cubicle installation service
Unquestionably believe that which you stated. Your favorite reason appeared to be on the internet the simplest thing to be aware of. I say to you, I definitely get annoyed while people think about worries that they plainly don’t know about. You managed to hit the nail upon the top and also defined out the whole thing without having side effect , people could take a signal. Will probably be back to get more. Thanks
Charlesfug
diclofenac generic
PetExpress
Hi, I do think this is an excellent website. I stumbledupon it 😉 I’m going to return yet again since I book marked it. Money and freedom is the greatest way to change, may you be rich and continue to guide others.
Aaronaporb
purchase allopurinol
Michaelvar
propecia buy
BennyLOORA
buy xenical
positive discipline
Greetings I am so grateful I found your blog, I really found you by error, while I was searching on Yahoo for something else, Regardless I am here now and would just like to say thanks a lot for a tremendous post and a all round exciting blog (I also love the theme/design), I don’t have time to browse it all at the minute but I have book-marked it and also added in your RSS feeds, so when I have time I will be back to read a great deal more, Please do keep up the awesome work.
Aaronaporb
http://lisinopril40mg.com/ – lisinopril without an rx
Charlesfug
how much is doxycycline
g spot rabbit vibrator
I cannot thank you enough for the blog post. Really Cool.
Charlesfug
lisinopril 20mg tablets
BennyLOORA
flagyl no prescription
Michaelvar
order levaquin
Aaronaporb
http://atenololchlorthalidone.com/ – atenolol chlorthalidone
Charlesfug
buy doxycycline online
animal porn
anal porn buy hacklink child porn animal porn
BennyLOORA
albuterol sulfate inhaler
Michaelvar
buy levitra online canada
david thunder cummings
Greetings from California! I’m bored to tears at work so I decided to check out your site on my iphone during lunch break. I love the info you provide here and can’t wait to take a look when I get home. I’m shocked at how fast your blog loaded on my phone .. I’m not even using WIFI, just 3G .. Anyhow, good site!
Aaronaporb
http://zithromaxwithoutprescription.com/ – buy zithromax without prescription
ekran kirala
Müşterilerimizi hedeflerine ulaştırabilmek için her zaman yenilikçi çözümler üretiyoruz.
Charlesfug
more helpful hints
KennethGaf
lotrisone otc
BennyLOORA
viagra online-australia
Michaelvar
acyclovir cream price
EliteDefenseTech
May I simply say what a relief to uncover a person that genuinely knows what they’re talking about on the web. You definitely know how to bring an issue to light and make it important. A lot more people should read this and understand this side of your story. I was surprised you are not more popular given that you most certainly have the gift.
Aaronaporb
http://keflexcephalexin.com/ – keflex cephalexin
private
Im grateful for the blog.Much thanks again.
Michaelvar
buy accutane
Charlesfug
generic hydrochlorothiazide
BennyLOORA
azithromycin antibiotic
Michaelvar
prednisone 5 mg
pharmacy tech certification study guide
wonderful issues altogether, you simply won a new reader. What might you recommend in regards to your submit that you just made a few days in the past? Any positive?
eyeliner glue
Just imagined I might remark and say fantastic concept, did you help it become on your individual? Seems to be really fantastic!
Ransbottom
Came across this write-up interested, added to meemi
Aaronaporb
http://erythromycinethylsuccinate.com/ – online erythromycin
anal porn
anal porn child porn animal porn buy hacklink
buy drinks online naija
Normally I do not learn post on blogs, however I wish to say that this write-up very compelled me to try and do it! Your writing taste has been amazed me. Thanks, quite great article.
QSDA2018 Practice Exam
Thanks so much for the post.Really thank you! Keep writing.
cissp syllabus
You have remarked very interesting details! ps nice site.
ecom elites 2.0
I value the post.Thanks Again. Cool.
Charlesfug
citalopram
Charlesfug
[url=http://levaquin.us.org/]order levaquin online[/url] [url=http://kobviagra.com/]viagra 50 mg price[/url] [url=http://onlinepriceoflevitra.com/]levitra buy online[/url] [url=http://levitrageneric-priceof.com/]buy cheap levitra online[/url] [url=http://bupropion.us.com/]bupropion[/url]
BennyLOORA
sildenafil online pharmacy
Michaelvar
propranolol drug
야마토
Normally I do not learn post on blogs, but I would like to say that this write-up very forced me to try and do so! Your writing taste has been amazed me. Thanks, quite nice post.
มุ้งลวด
Keep up the good work , I read few posts on this web site and I conceive that your web site is rattling interesting and holds bands of good info .
child porn
anal porn child porn animal porn buy hacklink
Aaronaporb
http://prednisoneoral.com/ – steroid prednisone
DC Furniture assembly
My partner and I absolutely love your blog and find many of your post’s to be just what I’m looking for. Do you offer guest writers to write content available for you? I wouldn’t mind writing a post or elaborating on a few of the subjects you write regarding here. Again, awesome site!
DC office movers
Thanks for the good writeup. It in fact used to be a entertainment account it. Look complex to far added agreeable from you! However, how can we keep up a correspondence?
AllVidd
I enjoy looking through a post that can make men and women think. Also, many thanks for permitting me to comment.
BennyLOORA
cafergot tablets
Charlesfug
web site
Michaelvar
prozac
Aaronaporb
http://nolvadextamoxifen.com/ – nolvadex tamoxifen
BennyLOORA
levaquin
Michaelvar
propecia
Charlesfug
metformin 500 mg
Aaronaporb
http://onlinepriceoflevitra.com/ – buying levitra
rapid weight loss youtube
Rattling nice pattern and great subject matter, hardly anything else we want : D.
baltimore office furniture installation company
I have been surfing online more than 3 hours as of late, but I by no means found any attention-grabbing article like yours. It is beautiful price enough for me. In my view, if all webmasters and bloggers made good content material as you probably did, the net will probably be a lot more helpful than ever before.
brigade utopia whitefield
Very good post. I certainly love this site. Keep it up!
visit website
I truly appreciate this post. I ave been looking everywhere for this! Thank goodness I found it on Google. You have made my day! Thank you again
BennyLOORA
albuterol brand name
SaaS
Attractive section of content. I just stumbled upon your website and in accession capital to assert that I get in fact enjoyed account your blog posts. Any way I will be subscribing to your augment and even I achievement you access consistently fast.
Michaelvar
advair inhalers
Michaelvar
cialis best price
Charlesfug
buy prednisolone 5mg
Aaronaporb
http://inderal.us.org/ – order inderal
안전공원
I was just looking for this information for some time. After 6 hours of continuous Googleing, at last I got it in your website. I wonder what is the lack of Google strategy that don’t rank this kind of informative web sites in top of the list. Generally the top sites are full of garbage.
안전놀이터
I just like the helpful info you supply on your articles. I’ll bookmark your weblog and test once more here regularly. I am quite sure I’ll be informed lots of new stuff proper right here! Best of luck for the following!
BennyLOORA
buy ventolin inhaler without prescription
Michaelvar
sildenafil citrate vs viagra
Charlesfug
avodart 0.5 mg
Aaronaporb
http://keflexcephalexin.com/ – buy cephalexin 250 mg
Abe Eager
Good post. Do you have any other ones you can drop? I dig this. 🙂
BennyLOORA
vibramycin
Michaelvar
price of levitra
silver spring furniture assembly
Do you have a spam problem on this website; I also am a blogger, and I was wanting to know your situation; we have developed some nice methods and we are looking to exchange techniques with others, be sure to shoot me an email if interested.
CBD
Heya i’m for the first time here. I found this board and I find It really useful & it helped me out much. I hope to give something back and help others like you aided me.
anal porn
hacklink buy anal porn sex animal porn child
KennethGaf
lotrisone 1
Charlesfug
valtrax on line
Aaronaporb
http://metformin-glucophage.com/ – metformin hcl 500 mg without prescription
Emory Mccay
Hi there! This article could not be written any better! Reading through this article reminds me of my previous roommate! He always kept preaching about this. I will send this post to him. Pretty sure he’ll have a great read. I appreciate you for sharing!
Gepi Site
Some genuinely good posts on this web site , thankyou for contribution.
How to get a guy obsessed with you
I am always looking online for tips that can aid me. Thx!
Josh Delaney is a fraud
Enjoyed every bit of your post.Really thank you! Really Great.
먹튀폴리스
I like the valuable info you provide in your articles. I will bookmark your blog and check again here regularly. I am quite certain I will learn a lot of new stuff right here! Best of luck for the next!
website
Say, you got a nice blog post. Fantastic.
Website
I view something really special in this website.
google buy hacklink
hacklink buy anal porn sex animal porn child
calorias para bajar un kilo
Keep up the good piece of work, I read few posts on this internet site and I conceive that your website is really interesting and has sets of good information.
Fairfax furniture assembly
Thanks for your submission. I also feel that laptop computers have become more and more popular right now, and now will often be the only sort of computer included in a household. This is because at the same time potentially they are becoming more and more inexpensive, their working power keeps growing to the point where they’re as powerful as pc’s through just a few years back.
ants exterminators
Excellent website. Plenty of useful info here. I am sending it to several pals ans also sharing in delicious. And obviously, thank you for your effort!
Vivino Coupon
Looking forward to reading more. Great article.Thanks Again. Awesome.
target deal
There as certainly a lot to know about this issue. I like all of the points you ave made.
colgate coupons
Many thanks for sharing this fine post. Very interesting ideas! (as always, btw)
check
Hi there! I know this is kind of off topic but I was wondering if you knew where I could get a captcha plugin for my comment form? I’m using the same blog platform as yours and I’m having problems finding one? Thanks a lot!
Isela Irimata
I was able to find good advice from your blog posts.
neutragena coupons
you have to post. Could you make a list the complete urls of all your public pages like your twitter feed, Facebook page or linkedin profile?
아동미술
Thanks for another informative blog. Where else may I get that type of information written in such an ideal means? I’ve a project that I am just now operating on, and I have been on the glance out for such info.
flonase coupons
Utterly pent content material , regards for entropy.
producing
Enjoyed every bit of your article.Thanks Again. Really Great.
similac coupons
This particular blog is really interesting and also amusing. I have chosen many handy tips out of this blog. I ad love to come back again and again. Thanks a lot!
coupons safeway
I stumbledupon it I may come back yet again since i have book marked it.
loreal coupon
useful reference What is a blogging site that allows you to sync with facebook for comments?
Reagan airport cab
This is really interesting, You are an excessively professional blogger. I have joined your rss feed and look forward to in search of more of your wonderful post. Also, I’ve shared your web site in my social networks!
qnpyniYojZccJIMgXRo
out there that I am completely confused.. Any recommendations?
Agen Bola Terpercaya
I was suggested this blog by my cousin. I am not sure whether this post is written by him as no one else know such detailed about my trouble. You are wonderful! Thanks!
Techey Adda
Good day! I just wish to give you a huge thumbs up for the great information you have got here on this post. I am returning to your web site for more soon.
lululemon coupon
Very good blog post.Really thank you! Much obliged.
coupon publix
Say, you got a nice blog article.Really looking forward to read more. Will read on
tresemme coupons
Some genuinely superb info , Gladiolus I observed this.
Waldorf Cab
Thanks for giving your ideas listed here. The other element is that if a problem develops with a computer motherboard, people today should not take the risk of repairing this themselves because if it is not done correctly it can lead to irreparable damage to the entire laptop. It will always be safe just to approach a dealer of a laptop for your repair of motherboard. They have got technicians who may have an competence in dealing with pc motherboard troubles and can carry out the right diagnosis and undertake repairs.
Ellicott city furniture assembly
Great awesome things here. I¡¦m very happy to peer your article. Thank you so much and i am having a look forward to contact you. Will you kindly drop me a e-mail?
makeup coupon
Some truly great content on this internet site , thanks for contribution.
penis sleeves
Wow, great post.Much thanks again. Really Great.
poseidonhd
Great weblog here! Additionally your site loads up fast! What host are you the use of? Can I am getting your affiliate hyperlink for your host? I want my web site loaded up as quickly as yours lol
coupon nexium
sure, analysis is having to pay off. Loving the page.. all the best Loving the page.. glad I found it So pleased to have located this article..
dogfood coupons
your website and keep checking for new details about once per week.
deals mcdonalds
Wow! This can be one particular of the most useful blogs We ave ever arrive across on this subject. Actually Wonderful. I am also a specialist in this topic therefore I can understand your hard work.
Gaithersburg furniture assembly
Its like you read my thoughts! You appear to know a lot about this, like you wrote the ebook in it or something. I feel that you just could do with a few % to pressure the message house a little bit, but instead of that, this is wonderful blog. A fantastic read. I’ll certainly be back.
casify coupons
I was recommended this web site by my cousin. I am not sure whether this post is written by him as no one else know such detailed about my trouble. You are wonderful! Thanks!
coupon macdonald
I truly appreciate this blog.Thanks Again. Cool.
trang điểm cô dâu nhẹ nhàng
A big thank you for your article post.Much thanks again. Really Great.
freecharge coupon
is said to be a distraction. But besides collecting I also play in these shoes.
sablon kaos satuan
I do accept as true with all of the ideas you have presented for your post. They’re really convincing and can definitely work. Still, the posts are very quick for starters. May just you please extend them a little from next time? Thanks for the post.
hotstar coupons
I truly appreciate this post. I ave been looking all over for this! Thank goodness I found it on Bing. You ave made my day! Thanks again
YouTube to MP3
Thanks so much for the blog article.Thanks Again. Cool.
Go Get Travel
You made some decent points there. I looked on the net to learn more about the issue and found most individuals will go along with your views on this site.
redbus coupon
Wow! This can be one particular of the most useful blogs We have ever arrive across on this subject. Basically Fantastic. I am also an expert in this topic so I can understand your effort.
cinepolis coupons
Thank you for another excellent post. Where else could anybody get that kind of information in such a perfect way of writing? I ave a presentation next week, and I am on the look for such info.
coupons jabong
Its hard to find good help I am forever proclaiming that its hard to procure good help, but here is
weathertech coupon
There is visibly a bunch to realize about this. I believe you made certain nice points in features also.
Latest jobs in Nigeria 2019
I think this is a real great article.Thanks Again. Great.
chipotle coupon
very trivial column, i certainly love this website, be on it
fanatic coupon
Nice blog here! Also your website rather a lot up very fast! What host are you the usage of? Can I am getting your associate link in your host? I want my website loaded up as fast as yours lol
Derrick
You are not right. I can defend the position. Write to me in PM.
staple coupon
Useful information. Lucky me I found your web site by accident, and I am stunned why this twist of fate did not happened in advance! I bookmarked it.
child porn
anal sikiş porno izle canlı sikiş animal porn hacklink
coupon newport
Wow! Thank you! I always wanted to write on my website something like that. Can I implement a portion of your post to my site?
applebees coupon
Thank you for your very fantastically clear fine points and feedback from you. sedan dealers san jose
coupon wingstop
This is one awesome article post.Really thank you! Will read on
denver seo packages
Thanks so much for the post. Want more.
cerita dewasa bergambar
It seems too complicated and extremely broad for me.
cerita dewasa ngentot
I truly appreciate this post. I have been looking everywhere for this! Thank God I found it on Google. You ave made my day! Thank you again.
Eboni Jabiro
Thanks a lot for sharing this with all of us you actually know what you’re talking about! Bookmarked. Kindly also visit my web site =). We could have a link exchange arrangement between us!
cerita dewasa seks
Pretty! This has been an extremely wonderful article. Thanks for providing these details.
https://www.bellaclique.com/
You generated some decent points there. I looked on-line for that problem and discovered the majority of people will go coupled with with all your internet site.
cerita dewasa nyata
Thank you for the good writeup. It in fact was a amusement account it. Look advanced to more added agreeable from you! By the way, how could we communicate?|
ugolemqvane na penisa
RUSSIA JERSEY ??????30????????????????5??????????????? | ????????
anal porn
anal sikiş porno izle canlı sikiş animal porn hacklink
otslabvane
Your current posts often possess a lot of really current info. Where can you come up with this? Just declaring you might be very formative. Thanks once again
ugolemqvane na penisa
Im thankful for the article post.Much thanks again. Want more.
Falls church furniture assembly
I really appreciate this post. I¡¦ve been looking all over for this! Thank goodness I found it on Bing. You’ve made my day! Thanks again
asian wedding venues
Thanks so much for the blog article.Really looking forward to read more. Awesome.
za otslabvane
some times its a pain in the ass to read what website owners wrote but this internet site is very user pleasant!.
ugolemiavane na penisa
Retain up the terrific piece of function, I read few content material on this website and I think that your web weblog is actual intriguing and has got circles of good info .
https://www.ivoignatov.com/principite-na-uspeha
They are very convincing and can definitely work. Nonetheless, the posts
uk package forwarding
Many thanks for this article. I will also like to state that it can often be hard while you are in school and merely starting out to create a long credit standing. There are many pupils who are simply just trying to make it and have an extended or favourable credit history can occasionally be a difficult issue to have.
bigo live diamond
mac cosmetics cheap I dugg some of you post as I cogitated they were very helpful very helpful
Germantown furniture assembly
Hello! I simply would like to give a huge thumbs up for the nice data you’ve gotten right here on this post. I will be coming back to your weblog for more soon.
eyelash extensions cambridge
Some really good information, Sword lily I discovered this. What you do speaks therefore loudly that i cannot hear that which you say. by Ron Waldo Emerson.
Tanner Unterman
This is a good tip especially to those new to the blogosphere. Brief but very accurate information… Thank you for sharing this one. A must read post!
우리카지노
I absolutely love your blog and find the majority of your post’s to be exactly I’m looking
for. Does one offer guest writers to write content
available for you? I wouldn’t mind publishing a post or elaborating on a few of the subjects you write about here.
Again, awesome website!
professional
I think this is a real great article post.Really thank you! Keep writing.
makeup artist job referral
It as really a great and helpful piece of information. I am glad that you shared this useful info with us. Please keep us up to date like this. Thank you for sharing.
Baltimore furniture assembly
I really appreciate this post. I have been looking all over for this! Thank goodness I found it on Bing. You have made my day! Thank you again!
custom mugs
Really appreciate you sharing this article.
canlı sikiş
anal porn google buy hacklink child porn animal porn.
affordable seo packages
I truly appreciate this article.Thanks Again. Great.
Alexandria Furniture assembly
I will right away grab your rss as I can’t find your e-mail subscription link or newsletter service. Do you have any? Kindly permit me recognise so that I could subscribe. Thanks.
Restaurant Neumünster
Sorry for the off-topic, could you tell where I can get such a nice pattern for my blog ?!
Inside stories
What blogging website had the least invasive ads for free-account users?. Or what blogging website is best for someone looking to start a professional literary blog?.
games for windows pc download
Im obliged for the article post.Much thanks again. Really Cool.
jungle run bouncy castle
Really informative blog post.Really looking forward to read more.
apk full version download
Very good article. I am facing a few of these issues as well..
todo list app
I believe this is among the most significant info for me. And i’m satisfied reading your article. However want to observation on some general issues, The site taste is ideal, the articles is truly excellent : D. Just right job, cheers
pc software full download
Sources Wow! Thank you! I always needed to write on my blog something like that. Can I implement a fragment of your post to my blog?
Trinity Wilderman
Merely wanna admit that this is handy , Thanks for taking your time to write this.
apk installer for windows 7
Thanks a lot for the blog.Much thanks again. Awesome.
film ally
Write more, thats all I have to say. Literally, it seems as though you relied on the video to make your point. You definitely know what youre talking about, why waste your intelligence on just posting videos to your blog when you could be giving us something informative to read?
apk latest version download
I simply could not leave your site prior to suggesting that I extremely loved the usual information an individual supply to your guests? Is gonna be back incessantly in order to inspect new posts
Avanguardia Europea il segreto di Ostia Antica
Hey! Quick question that’s entirely off topic. Do you know how to make your site mobile friendly? My web site looks weird when browsing from my iphone4. I’m trying to find a template or plugin that might be able to correct this issue. If you have any recommendations, please share. Thank you!
apk latest version download
Very nice info and right to the point. I am not sure if this is truly the best place to ask but do you guys have any ideea where to hire some professional writers? Thank you
anal porn
anal porn google buy hacklink child porn animal porn.
pc games free download for windows 7
identifies a home defeat to Nottingham Forest. browse this
Consultancy
This particular blog is really cool additionally amusing. I have found helluva handy advices out of this source. I ad love to visit it over and over again. Thanks a lot!
apps download for pc windows
This is my first time pay a quick visit at here and i am in fact pleassant to read everthing at alone place.
Mens Watches
I am extremely inspired along with your writing talents as well as with the layout in your weblog. Is this a paid topic or did you modify it yourself? Either way keep up the excellent high quality writing, it’s uncommon to see a great blog like this one today..
games for pc download
This blog is definitely entertaining additionally informative. I have picked a lot of helpful stuff out of it. I ad love to visit it again soon. Cheers!
techengage
Thanks a lot for providing individuals with an extremely pleasant chance to read in detail from here. It’s always so superb plus jam-packed with amusement for me personally and my office co-workers to search your blog really 3 times a week to see the newest guides you have got. And definitely, we’re at all times happy concerning the impressive techniques served by you. Selected 3 facts in this post are without a doubt the most effective I’ve had.
Virginia furniture assembly
Very well written post. It will be useful to everyone who utilizes it, including myself. Keep doing what you are doing – for sure i will check out more posts.
London
Have you ever thought about including a little bit more than just your articles? I mean, what you say is important and everything. Nevertheless think about if you added some great pictures or video clips to give your posts more, “pop”! Your content is excellent but with images and clips, this website could certainly be one of the best in its niche. Great blog!
iOS Eraser
I cannot thank you enough for the blog article.Much thanks again. Much obliged.
apps for pc
It is usually a very pleased day for far North Queensland, even state rugby league usually, Sheppard reported.
Virginia furniture assembly
I dugg some of you post as I cogitated they were invaluable very useful
Luxenationz
Excellent post! We are linking to this great content on our site. Keep up the great writing.
Sex Porn XXX Video
Great – I should certainly pronounce, impressed with your web site. I had no trouble navigating through all the tabs as well as related information ended up being truly easy to do to access. I recently found what I hoped for before you know it at all. Quite unusual. Is likely to appreciate it for those who add forums or anything, website theme . a tones way for your customer to communicate. Excellent task..
showbox apk
Looking forward to reading more. Great article.Thanks Again. Awesome.
Furniture assembly DC
I gotta favorite this site it seems very useful very useful
rohrsanierung remscheid
Very nice post. I simply stumbled upon your weblog and wanted to say that I have truly loved browsing your weblog posts. After all I will be subscribing to your rss feed and I’m hoping you write once more soon!
สล็อต w88
Wow! This can be one particular of the most helpful blogs We have ever arrive across on this subject. Actually Excellent. I am also a specialist in this topic so I can understand your effort.
Fodyssey
Your style is unique compared to other folks I have read stuff from. Thanks for posting when you’ve got the opportunity, Guess I will just book mark this page.
viagra
Hi there, simply became aware of your blog through Google, and located that it is really informative. I’m going to be careful for brussels. I will appreciate for those who proceed this in future. Numerous people might be benefited from your writing. Cheers!
Chelsie Mosco
purify blackbird athens dilip detering skinny moderations obi kenobi moondog
Kenna Cousain
I have noticed that over the course of making a relationship with real estate proprietors, you’ll be able to come to understand that, in every single real estate financial transaction, a commission is paid. Finally, FSBO sellers will not “save” the percentage. Rather, they struggle to earn the commission by simply doing a agent’s occupation. In accomplishing this, they devote their money as well as time to execute, as best they’re able to, the tasks of an agent. Those tasks include exposing the home by means of marketing, introducing the home to willing buyers, constructing a sense of buyer urgency in order to trigger an offer, scheduling home inspections, dealing with qualification checks with the lender, supervising maintenance, and assisting the closing.
Torx driving bits
I loved your post. Really Cool.
click the next document
Normally I do not learn article on blogs, however I wish to say that this write-up very compelled me to take a look at and do so! Your writing style has been amazed me. Thanks, quite great article.
viagra
I will immediately grab your rss feed as I can’t to find your email subscription hyperlink or e-newsletter service. Do you’ve any? Please let me realize so that I could subscribe. Thanks.
john deere 310sj service manual
Wow! This can be one particular of the most useful blogs We’ve ever arrive across on this subject. Actually Wonderful. I’m also a specialist in this topic so I can understand your effort.
รับจัดบุฟเฟ่ต์
I’m not sure why but this web site is loading extremely slow for me. Is anyone else having this issue or is it a issue on my end? I’ll check back later and see if the problem still exists.
Premium Porn Sites
http://pbt.mhollis.com/g/go.php?url=https://adulterre.net/
best 10 online pharmacies
canadian online pharmacies
anal porn
animal porn child porn hacklink buy google hacklink anal porn.
contribute film-related articles
I like what you guys are up also. Such clever work and reporting! Carry on the excellent works guys I have incorporated you guys to my blogroll. I think it will improve the value of my web site 🙂
lop hoc trang diem chuyen nghiep
Im grateful for the article.Thanks Again. Keep writing.
먹튀업체
wonderful post, very informative. I ponder why the opposite experts of this sector do not notice this. You should continue your writing. I’m confident, you have a great readers’ base already!
filmmaking support
excellent submit, very informative. I’m wondering why the other specialists of this sector don’t notice this. You should proceed your writing. I’m sure, you have a huge readers’ base already!
da op bep cao cap
Wow, great blog post.Thanks Again. Great.
hardcore porn
buy hacklink animal porn child porn
먹튀검증사이트
I’ve been exploring for a little for any high quality articles or blog posts on this kind of area . Exploring in Yahoo I at last stumbled upon this web site. Reading this info So i’m happy to convey that I have an incredibly good uncanny feeling I discovered exactly what I needed. I most certainly will make sure to do not forget this website and give it a look regularly.
stopoverdoseil.org
Wow! This could be one particular of the most beneficial blogs We have ever arrive across on this subject. Actually Great. I’m also a specialist in this topic so I can understand your effort.
Taneka Witherow
Hi! I simply would like to offer you a big thumbs up for your great information you have right here on this post. I will be coming back to your blog for more soon.
google buy hacklink
buy hacklink animal porn child porn
lucid 14
Very informative article.Much thanks again. Really Great.
Kimiko Broz
Very good information. Lucky me I discovered your site by accident (stumbleupon). I have book marked it for later!
animal porn
porn animal chil porn hacklink buy google.
먹튀검증 사이트
I have read a few just right stuff here. Definitely worth bookmarking for revisiting. I surprise how so much attempt you put to create this type of magnificent informative site.
angel_black
Thanks! Add me on on snapchat LanaShows I have nudes!
Upper marlboro furniture assembly
Its like you read my mind! You seem to know a lot about this, like you wrote the book in it or something. I think that you can do with some pics to drive the message home a little bit, but other than that, this is excellent blog. A fantastic read. I’ll definitely be back.
canadian pharmacy
prescription meds without the prescription
best personal loans in Singapore 2018
You are a very smart person! 🙂
먹튀검증사이트
I discovered your blog site on google and check a couple of of your early posts. Continue to keep up the very good operate. I simply further up your RSS feed to my MSN Information Reader. Looking for forward to reading extra from you later on!…
Baltimore furniture assembly
I’m really loving the theme/design of your web site. Do you ever run into any internet browser compatibility issues? A small number of my blog audience have complained about my blog not operating correctly in Explorer but looks great in Firefox. Do you have any advice to help fix this problem?
Maryland furniture assembly
When I originally commented I clicked the “Notify me when new comments are added” checkbox and now each time a comment is added I get several emails with the same comment. Is there any way you can remove me from that service? Many thanks!
https://famoid.com/buy-instagram-followers/
https://famoid.com/buy-instagram-followers/
Maryland furniture assembly
Hello, i think that i noticed you visited my blog so i got here to “return the favor”.I am trying to in finding issues to improve my web site!I suppose its ok to use a few of your ideas!!
먹튀 폴리스
Howdy! I just would like to give an enormous thumbs up for the great info you have got right here on this post. I shall be coming back to your weblog for more soon.
Picture Hanging DC
Thanks for any other great article. The place else may just anybody get that kind of info in such a perfect way of writing? I’ve a presentation next week, and I’m at the look for such information.
eebest8 fiverr
“Hi! Someone in my Myspace group shared this site with us so I came to check it out. I’m definitely loving the information. I’m book-marking and will be tweeting this to my followers! Great blog and wonderful style and design.”
Smart TV installers
One other important aspect is that if you are an older person, travel insurance pertaining to pensioners is something that is important to really contemplate. The more aged you are, the harder at risk you are for permitting something bad happen to you while in another country. If you are not necessarily covered by several comprehensive insurance policies, you could have quite a few serious troubles. Thanks for revealing your ideas on this blog.
Picture hanging DC
Hey, you used to write great, but the last few posts have been kinda boring¡K I miss your super writings. Past several posts are just a little bit out of track! come on!
Furniture Assembly Experts
It’s appropriate time to make some plans for the future and it is time to be happy. I’ve read this post and if I could I desire to suggest you some interesting things or tips. Perhaps you can write next articles referring to this article. I want to read more things about it!
apk latest version download
I wish my website loaded up as quickly as yours lol
Benito Helsey
http://www.accountingsoftwareusers.com/__media__/js/netsoltrademark.php?d=adulterre.net/
soft play packages to hire in bexley
Major thankies for the article.Really looking forward to read more. Cool.
Andpermata
Thanks! Add me on on snapchat LanaShows I have nudes!
bouncy castle inflatables croydon
Awesome article. Want more.
Royal CBD
I love it when folks come together and share ideas. Great website, continue the good work.
famoid hacklink
buy hacklink animal porn child porn.
Maryland office furniture installers
Very good blog you have here but I was wanting to know if you knew of any user discussion forums that cover the same topics discussed in this article? I’d really like to be a part of community where I can get comments from other knowledgeable people that share the same interest. If you have any recommendations, please let me know. Thank you!
Alexandria furniture assembly
I was examining some of your posts on this internet site and I believe this site is really informative! Keep on putting up.
bouncy castle for hire in Greenwich
I really liked your blog.Really looking forward to read more. Cool.
Arlington furniture assembly
This really answered my downside, thanks!
Jody Stempien
http://www.bcbsfla.com/__media__/js/netsoltrademark.php?d=adulterre.net/
series online
I think this is one of the most significant information for me. And i’m glad reading your article. But should remark on some general things, The web site style is ideal, the articles is really great : D. Good job, cheers
royalcbd.org
Really enjoyed this article post.Really looking forward to read more. Will read on…
Furniture assembly team
Valuable info. Fortunate me I discovered your website accidentally, and I’m shocked why this accident did not took place earlier! I bookmarked it.
parcel forwarding uk
Good post but I was wanting to know if you could write a litte more on this topic? I’d be very grateful if you could elaborate a little bit further. Appreciate it!
thruster sex toy
Hey, thanks for the article post.Much thanks again. Keep writing.
Any assembly
Youre so cool! I dont suppose Ive learn anything like this before. So good to search out any person with some original ideas on this subject. realy thanks for starting this up. this web site is something that is needed on the web, somebody with a bit originality. useful job for bringing one thing new to the web!
animal porn
buy hacklink animal porn hardcore sex porn famoid hacklink viagra.
clit sucker
I really liked your article.Much thanks again. Fantastic.
Columbia furniture assembly
It’s laborious to search out knowledgeable people on this matter, but you sound like you realize what you’re speaking about! Thanks
Tembak Ikan
What’s Taking place i’m new to this, I stumbled upon this I have found It positively helpful and it has helped me out loads. I hope to contribute & assist other customers like its helped me. Great job.
Furniture Assembly Experts
Thanks for sharing your ideas. A very important factor is that individuals have an alternative between federal student loan plus a private student loan where it truly is easier to select student loan consolidation than over the federal education loan.
seks izle
hacklink google satın al ve porno izle, seks kaset canlı sikiş izle.
Furniture Assembly DC
This is the precise blog for anybody who desires to search out out about this topic. You realize a lot its virtually arduous to argue with you (not that I truly would want…HaHa). You positively put a brand new spin on a topic thats been written about for years. Great stuff, simply great!
Furniture assembly DC
Its like you read my mind! You appear to know a lot about this, like you wrote the book in it or something. I think that you can do with a few pics to drive the message home a bit, but other than that, this is wonderful blog. A fantastic read. I will definitely be back.
pelispedia
Valuable information. Fortunate me I found your website by chance, and I am surprised why this coincidence did not came about earlier! I bookmarked it.
child porn
canlı sikis, hacklink google buy, animal porn.
online screenwriting course free
Thanks for your thoughts. One thing I have noticed is that banks along with financial institutions are aware of the spending patterns of consumers while also understand that most of the people max outside their own credit cards around the getaways. They properly take advantage of this kind of fact and then start flooding your inbox plus snail-mail box along with hundreds of Zero APR credit cards offers right after the holiday season ends. Knowing that should you be like 98% in the American community, you’ll jump at the chance to consolidate credit card debt and switch balances towards 0 interest rates credit cards.
shopping service from the uk
I carry on listening to the news speak about receiving free online grant applications so I have been looking around for the most excellent site to get one. Could you tell me please, where could i acquire some?
canlı sikiş
canlı sikis, hacklink google buy, animal porn.
South Jersey Roof
I’ve recently started a web site, the info you offer on this website has helped me tremendously. Thanks for all of your time & work. “A creative man is motivated by the desire to achieve, not by the desire to beat others.” by Ayn Rand.
Lowell Handwerker
I could not resist commenting. Very well written!
메이저사이트
Thanks for the article post.Much thanks again. Fantastic.
손오공
Very good blog article.Really looking forward to read more. Awesome.
Kory Prawl
An interesting discussion is definitely worth comment. I do think that you need to publish more on this subject matter, it might not be a taboo subject but typically people don’t speak about such subjects. To the next! Cheers.
Ola Musco
I came across your blog after i did a search for winter hair cair tips at Yahoo. I wanted to say thank you for taking time to create this site and letting me post.
Donnell Troutt
Good post. I learn something totally new and challenging on blogs I stumbleupon on a daily basis. It’s always exciting to read through articles from other authors and use a little something from their web sites.
anal porn
anal porn, canlı sikiş, google hacklinkanimal porncanlı porno
Coy Cramer
Everything is very open with a clear description of the issues. It was definitely informative. Your website is very useful. Many thanks for sharing.
Saul Guderian
I was able to find good advice from your articles.
다자바 검증
I truly appreciate this blog article.Really looking forward to read more. Fantastic.
Doreatha Hulett
I just was in essence really pleased to not mention delighted thinking of that We the sensation from debating while using guide of foreign folks, maybe even picked English tongue for helping many people correct after they recognized ordinarily the chatting worry. I just was in essence even specifically enthusiastic when currency.
먹튀검증사이트
Hey, thanks for the blog article.Really looking forward to read more. Keep writing.
Boris Breazeal
Everything is very open with a very clear description of the challenges. It was definitely informative. Your website is useful. Thanks for sharing.
Rugby World Cup
Can you tell us more about this? I’d like to find outt more details.
Diamond Gollnick
Spot on with this write-up, I actually think this amazing site needs far more attention. I’ll probably be back again to see more, thanks for the information!
메이저놀이터
Im grateful for the blog post. Keep writing.
i99Club
Good post. I learn something new and challenging on blogs I stumbleupon everyday. It’s always exciting to read through articles from other authors and practice something from their sites.
먹튀검증업체
I am so grateful for your blog article.Thanks Again. Want more.
Amira Melser
I would like to voice my gratitude for your kind-heartedness giving support to individuals that should have assistance with in this situation. Your real dedication to getting the solution along had become astonishingly helpful and has in most cases helped somebody much like me to get to their desired goals. Your new warm and friendly report signifies so much to me and additionally to my office workers. Thank you; from everyone of us.
Wikipedia
https://www.wikipedia.org
film acting
I value the blog post. Awesome.
SEO company Boca Raton
Its like you read my mind! You appear to know a lot about this, like you wrote the book in it or something. I think that you can do with some pics to drive the message home a bit, but instead of that, this is fantastic blog. A great read. I’ll certainly be back.
bola tangkasnet
Hi, Neat post. There is a problem with your web site in internet explorer, would test this… IE nonetheless is the market chief and a good section of other people will miss your great writing due to this problem.
Furniture assembly service
Fantastic goods from you, man. I’ve have in mind your stuff prior to and you are simply too great. I really like what you’ve obtained right here, really like what you’re stating and the way in which in which you say it. You make it entertaining and you continue to take care of to stay it wise. I can’t wait to learn much more from you. That is actually a terrific site.
Loraine Giles
It’s a beautiful country, more people need to recognise that.
Krishna Lunstrum
One of my all time special quotes appears very fitting here “Success is nothing more than a few simple disciplines, practiced every day; while failure is simply a few errors in judgment, repeated every day. It is the accumulative weight of our disciplines and our judgments that leads us to either fortune or failure.”–Jim Rohn
you can try here
I am so grateful for your article.Much thanks again. Much obliged.
crxnu tech
You are so awesome! I do not believe I’ve truly read through something like this before. So nice to find another person with genuine thoughts on this issue. Seriously.. many thanks for starting this up. This site is something that is required on the web, someone with a bit of originality.
Song Mellin
Hello there! Do you know should they help make any plugins to aid with Search engine optimization? I’m hoping to get my website to rate for a few focused keywords but I’m not really viewing very good gains. If you know of the please share. Be thankful!
Baltimore TV installation
My partner and I absolutely love your blog and find nearly all of your post’s to be exactly I’m looking for. Does one offer guest writers to write content for yourself? I wouldn’t mind creating a post or elaborating on a lot of the subjects you write about here. Again, awesome site!
Filme Online Streamen Kostenlos
As soon as I discovered this web site I went on reddit to share some of the love with them.
The BP
Hello there! This article couldn’t be written any better! Looking at this post reminds me of my previous roommate! He always kept preaching about this. I will send this information to him. Pretty sure he’s going to have a good read. Many thanks for sharing!
Furniture assembly handyman
Hi there, just became aware of your blog through Google, and found that it is really informative. I am gonna watch out for brussels. I’ll appreciate if you continue this in future. A lot of people will be benefited from your writing. Cheers!
Furniture assembly handyman
I really appreciate this post. I have been looking all over for this! Thank goodness I found it on Bing. You’ve made my day! Thanks again!
velvet skin care
Thanks so much for the article.Really looking forward to read more. Much obliged.
google hacklink
anal porno izlemek için en ideal adres, hd kalite ile izleyebilirsiniz.
먹튀검증
Looking forward to reading more. Great blog post.Really looking forward to read more. Awesome.
릴게임 사이트
Thank you ever so for you blog post.Really looking forward to read more. Will read on…
Neetish Sarda
This is the perfect blog for everyone who wants to understand this topic. You know so much its almost tough to argue with you (not that I actually will need to…HaHa). You definitely put a fresh spin on a subject that has been discussed for many years. Wonderful stuff, just great.
아동미술
Thanks for the post.Much thanks again. Much obliged.
sewa kantor jakarta selatan
Sorry for the huge review, but I’m really loving the new Zune, and hope this, as well as the excellent reviews some other people have written, will help you decide if it’s the right choice for you.
supremepr.us
Heya i am for the first time here. I found this board and I in finding It really helpful & it helped me out a lot. I am hoping to offer one thing again and help others like you aided me.
Idell Courneya
Comfortabl y, the article is really the sweetest on this precious topic. I concur with your conclusions and will certainly eagerly look forward to your upcoming updates. Simply just saying thanks will certainly not simply be sufficient, for the phenomenal clarity in your writing. I will certainly directly grab your rss feed to stay informed of any updates. Pleasant work and also much success in your business endeavors!
우리카지노
Thanks for the blog post. Awesome.
먹튀폴리스 검증
Great blog.Really thank you! Great.
child porn
child porn watch idigic hacklink buy google.
baju seragam olahraga
The Zune concentrates on being a Portable Media Player. Not a web browser. Not a game machine. Maybe in the future it’ll do even better in those areas, but for now it’s a fantastic way to organize and listen to your music and videos, and is without peer in that regard. The iPod’s strengths are its web browsing and apps. If those sound more compelling, perhaps it is your best choice.
Safwa Law Firm
I blog often and I seriously thank you for your content. Your article has really peaked my interest. I will bookmark your site and keep checking for new information about once a week. I subscribed to your RSS feed too.
먹튀검증업체
Enjoyed every bit of your blog article.Much thanks again. Much obliged.
Lacey Garns
Wholesale Cheap Handbags Are you ok basically repost this on my small site? Quite possibly to provide credit where it can be due. Have a very great day!
Science Tutor Bangalore
Thanks for sharing, this is a fantastic article post. Keep writing.
SI select vibrator
Major thanks for the post.Really thank you! Will read on…
vegan
Woah! I’m really enjoying the template/theme of this blog. It’s simple, yet effective. A lot of times it’s hard to get that “perfect balance” between superb usability and visual appeal. I must say you have done a amazing job with this. Additionally, the blog loads super quick for me on Chrome. Exceptional Blog!
zahnärzte düsseldorf
Excellent goods from you, man. I’ve understand your stuff previous to and you’re just too fantastic. I really like what you’ve acquired here, really like what you’re saying and the way in which you say it. You make it enjoyable and you still take care of to keep it sensible. I can’t wait to read far more from you. This is really a wonderful website.
Stream Complet
hi!,I love your writing very much! proportion we keep up a correspondence more approximately your post on AOL? I need an expert in this area to unravel my problem. May be that’s you! Looking forward to see you.
Laurel hair salon
Good day very nice blog!! Man .. Beautiful .. Wonderful .. I’ll bookmark your site and take the feeds also…I’m happy to find so many helpful information right here in the submit, we want develop extra strategies on this regard, thank you for sharing.
agen qq online terbaik dan terpercaya
Hey there! I’m at work browsing your blog from my new apple iphone! Just wanted to say I love reading your blog and look forward to all your posts! Carry on the excellent work!
Swing set assembly
whoah this weblog is excellent i like studying your articles. Keep up the good paintings! You understand, lots of persons are looking around for this info, you can help them greatly.
buy cbd capsules
I loved your post.Thanks Again. Keep writing.
메이저놀이터
Very good blog.Really thank you!
DC lash extensions
You have brought up a very wonderful points , appreciate it for the post.
Bunk bed assembly service
Awsome post and right to the point. I don’t know if this is in fact the best place to ask but do you folks have any ideea where to get some professional writers? Thanks in advance 🙂
Elliptical assembly service
you’re in reality a good webmaster. The web site loading pace is incredible. It seems that you are doing any distinctive trick. Furthermore, The contents are masterwork. you’ve done a magnificent job on this matter!
buy hacklink
free porn
Serco-Syr
After looking over a number of the blog articles on your site, I honestly like your way of writing a blog. I bookmarked it to my bookmark webpage list and will be checking back soon. Please visit my web site as well and let me know what you think.
아동미술학원
Thanks for the article post.Really looking forward to read more. Awesome.
bd-exp
Howdy, I do think your web site might be having web browser compatibility issues. When I take a look at your web site in Safari, it looks fine however, if opening in I.E., it has some overlapping issues. I merely wanted to give you a quick heads up! Aside from that, wonderful blog.
먹튀폴리스
I value the article post. Really Great.
licensed money lender bras basah
Nice blog here! Also your web site loads up fast! What web host are you using? Can I get your affiliate link to your host? I wish my site loaded up as quickly as yours lol
useful content
Thanks a bunch for sharing this with all of us you really know what you’re talking about! Bookmarked. Please also visit my site =). We could have a link exchange contract between us!
best cbd capsules
That is a good tip particularly to those new to the blogosphere. Simple but very precise information… Thank you for sharing this one. A must read post.
industry
Some genuinely quality posts on this internet site , bookmarked .
Anxiety
You are my intake , I own few blogs and infrequently run out from to brand.
Free share tips
Wow, awesome blog structure! How long have you ever been running a blog for? you made running a blog look easy. The entire look of your site is great, let alone the content material!
Crib assembly service
I simply couldn’t leave your website prior to suggesting that I actually loved the standard information an individual supply in your visitors? Is going to be again frequently to check up on new posts
먹튀검증 사이트
I loved your article.Much thanks again.
Katlyn Viramontes
Hi, I do think this is a great website. I stumbledupon it 😉 I may return yet again since I book-marked it. Money and freedom is the best way to change, may you be rich and continue to guide other people.
먹튀다자바
I think this is a real great post.Really looking forward to read more. Great.
우리카지노
Spot on with this write-up, I honestly feel this site needs much more attention. I’ll
probably be back again to read more, thanks for the information!
toddler bouncy castle hire Greenwich
Great, thanks for sharing this article post.Really thank you! Really Great.
메이저토토
Thank you for your blog article.Really thank you! Fantastic.
먹튀사이트
I cannot thank you enough for the article.Really looking forward to read more. Cool.
cbd store
Hi, I do think this is an excellent site. I stumbledupon it 😉 I am going to come back once again since I book marked it. Money and freedom is the best way to change, may you be rich and continue to help other people.
swan wand massager
Major thanks for the blog post. Really Great.
eichhorn holzeisenbahn
It’s really a cool and useful piece of information. I am satisfied that you simply shared this useful information with us. Please stay us up to date like this. Thank you for sharing.
packages
Does your website have a contact page? I’m having a tough time locating it but, I’d like to send you an email. I’ve got some ideas for your blog you might be interested in hearing. Either way, great blog and I look forward to seeing it improve over time.
아동미술학원
Hey, thanks for the article post.Really thank you! Will read on…
porno izle
porno sikiş izle viagra hacklink satın al.
you can look here
I just want to mention I’m very new to blogging and site-building and definitely savored you’re web page. More than likely I’m likely to bookmark your blog post . You definitely come with amazing well written articles. Thanks a bunch for sharing with us your website.
먹튀폴리스 사이트
Thanks for sharing, this is a fantastic article post.Much thanks again. Really Great.
child porn
my web free porn site
High Point rental property inspection
great issues altogether, you just received a new reader. What may you recommend in regards to your post that you simply made some days in the past? Any positive?
office furniture assemblers
Fantastic goods from you, man. I’ve keep in mind your stuff prior to and you are just too great. I actually like what you have obtained right here, really like what you’re saying and the way during which you assert it. You’re making it entertaining and you still take care of to keep it sensible. I can’t wait to read far more from you. That is really a great website.
Pool table installation
I have been surfing online greater than three hours these days, yet I by no means discovered any attention-grabbing article like yours. It is lovely value sufficient for me. In my opinion, if all web owners and bloggers made excellent content material as you did, the internet can be a lot more useful than ever before.
Table assembly service
I have recently started a web site, the info you offer on this website has helped me tremendously. Thanks for all of your time & work. “A creative man is motivated by the desire to achieve, not by the desire to beat others.” by Ayn Rand.
Geek Vibes Nation
Right here is the right blog for everyone who really wants to find out about this topic. You understand a whole lot its almost tough to argue with you (not that I actually will need to…HaHa). You certainly put a new spin on a subject which has been discussed for many years. Wonderful stuff, just great.
먹튀검증
Great, thanks for sharing this blog article.Much thanks again. Want more.
Life Insurance Surrey
Wow, great blog article.Much thanks again. Great.
Medical
WONDERFUL Post.thanks for share..extra wait .. …
league of legends runas
Some truly excellent info , Gladiolus I found this. “The past is a guide post, not a hitching post.” by L. Thomas Holdcroft.
website development costs
I have learn several excellent stuff here. Definitely price bookmarking for revisiting. I wonder how much attempt you place to create this sort of magnificent informative web site.
best online pharmacy
online drugstore
3d house design service
I really appreciate this post. I have been looking all over for this! Thank goodness I found it on Bing. You have made my day! Thank you again
메이저놀이터
Fantastic article. Much obliged.
Watch batteries
Greetings! Very helpful advice within this article! It’s the little changes that make the most significant changes. Many thanks for sharing!
how to compost with worms
There is visibly a bunch to know about this. I consider you made certain good points in features also.
help to write
This design is steller! You obviously know how to keep a reader amused. Between your wit and your videos, I was almost moved to start my own blog (well, almost…HaHa!) Fantastic job. I really loved what you had to say, and more than that, how you presented it. Too cool!
Zebra Partner
I am so happy to read this. This is the kind of manual that needs to be given and not the random misinformation that’s at the other blogs. Appreciate your sharing this greatest doc.
메이저놀이터
A big thank you for your article.Much thanks again. Awesome.
Tik Tok Girl
Hot tiktok girls https://bit.ly/31vCij2
John Deere Technical Manuals
Hey – great blog, simply looking around some blogs, seems a really nice platform you may be using. I???m currently using WordPress for a couple of of my blogs but aiming to change at least one over to a platform like yours to be a trial run. Anything specifically you will recommend over it?
scannable fake id
Im obliged for the blog.Thanks Again. Much obliged.
TOEFL VS IELTS
Perfectly indited content material, Really enjoyed reading.
메이저토토
Muchos Gracias for your post.Really looking forward to read more. Fantastic.
토토사이트
I do consider all the ideas you’ve introduced to your post. They’re very convincing and will definitely work. Still, the posts are too short for beginners. May just you please extend them a bit from next time? Thanks for the post.
at ahmaya.com
I truly appreciate this blog.Much thanks again. Really Great.
peliculas online
hey there and thank you for your info – I have certainly picked up something new from right here. I did however expertise some technical points using this website, as I experienced to reload the web site lots of times previous to I could get it to load correctly. I had been wondering if your web host is OK? Not that I’m complaining, but slow loading instances times will often affect your placement in google and can damage your quality score if advertising and marketing with Adwords. Anyway I am adding this RSS to my email and could look out for much more of your respective fascinating content. Make sure you update this again soon..
themed bouncy castles
Very informative blog.Really thank you! Great.
เช่าโต๊ะ
Some genuinely nice and utilitarian info on this site, besides I conceive the design contains good features.
먹튀 검증
It’s really a nice and helpful piece of information. I am glad that you shared this helpful information with us. Please keep us informed like this. Thanks for sharing.
먹튀사이트
I appreciate you sharing this article.Much thanks again. Fantastic.
write filmmaking articles
Hello, i feel that i noticed you visited my blog so i got here to “return the choose”.I’m attempting to to find things to improve my website!I assume its adequate to make use of some of your concepts!!
CBD
of course like your website but you have to take a look at the spelling on quite a few of your posts. Several of them are rife with spelling problems and I to find it very troublesome to tell the reality however I’ll certainly come again again.
satta king online result
Thank you for every other informative web site. Where else could I am getting that kind of info written in such a perfect approach? I’ve a project that I am simply now working on, and I’ve been on the look out for such information.
먹튀검증 사이트
Very nice post and straight to the point. I am not sure if this is actually the best place to ask but do you people have any ideea where to employ some professional writers? Thx 🙂
ahmaya@ahmaya.com
ahmaya@ahmaya.com
릴게임 야마토
Really appreciate you sharing this post.Thanks Again.
Daina Slaght
Really nice style and design and wonderful content , nothing else we require : D.
다잡아
I’ve been browsing on-line greater than 3 hours as of late, but I by no means found any interesting article like yours. It is beautiful value sufficient for me. In my opinion, if all web owners and bloggers made good content as you probably did, the web might be much more useful than ever before.
먹튀검증
Great, thanks for sharing this article.Really thank you! Keep writing.
Shavonne Fergusson
hi!,I like your writing so much! share we communicate more about your post on AOL? I require a specialist on this area to solve my problem. May be that’s you! Looking forward to see you.
Lai Buzhardt
Persevere! I’m guessing you’ll won’t worry if I browse around your website a tad more. “You cannot do a kindness too soon, for you never know how soon it will be too late.” by Ralph Waldo Emerson..
Height adjustable office desks
I like what you guys are up too. Such clever work and reporting! Keep up the superb works guys I have incorporated you guys to my blogroll. I think it will improve the value of my website :).
Watch National Finals Rodeo 2019 online
Wow, amazing blog layout! How long have you been blogging for? you make blogging look easy. The overall look of your web site is excellent, let alone the content!
senorita chords
I was just looking for this info for some time. After six hours of continuous Googleing, finally I got it in your web site. I wonder what is the lack of Google strategy that do not rank this type of informative websites in top of the list. Usually the top websites are full of garbage.
먹튀검증
This is one awesome article.Really looking forward to read more. Awesome.
confetti
Thanks for revealing your ideas. Something is that pupils have an option between fed student loan along with a private student loan where it truly is easier to select student loan online debt consolidation than over the federal student loan.
เช่ารถตู้ Alphard
obviously like your web-site but you have to check the spelling on several of your posts. Several of them are rife with spelling problems and I to find it very bothersome to tell the reality on the other hand I will surely come again again.
เกมส์เป่ายิ้งฉุบแก้ผ้า apk
I intended to create you one very little word just to thank you very much yet again relating to the great principles you’ve featured here. It has been shockingly open-handed with people like you to convey extensively exactly what many individuals would have marketed as an e book to generate some money on their own, and in particular given that you could have tried it in the event you considered necessary. The basics also acted to become fantastic way to be aware that most people have the identical zeal just as my very own to figure out a good deal more with regard to this matter. I am certain there are several more pleasurable occasions in the future for individuals that scan your site.
web site
Hello Thank you good by
검증사이트
Really enjoyed this blog.Thanks Again. Really Great.
Portia Bulland
very nice post, i definitely really like this site, persist in it
scholarships for international students abroad
Thanks so much for the article.Thanks Again. Cool.
snow management
There are actually a lot of details like that to take into consideration. That may be a nice point to bring up. I provide the ideas above as common inspiration but clearly there are questions like the one you deliver up the place crucial thing will likely be working in sincere good faith. I don?t know if finest practices have emerged round things like that, but I’m positive that your job is clearly recognized as a good game. Both girls and boys feel the influence of only a moment’s pleasure, for the remainder of their lives.
massey ferguson pdf manual
You are a very smart person!
Boxing
With havin so much written content do you ever run into any problems of plagorism or copyright violation? My blog has a lot of exclusive content I’ve either written myself or outsourced but it seems a lot of it is popping it up all over the web without my authorization. Do you know any techniques to help stop content from being stolen? I’d truly appreciate it.
cheap hair salon belsize park
I loved your article. Keep writing.
women
Im thankful for the post. Want more.
how to jailbreak a Firestick
Really appreciate you sharing this post.Much thanks again. Really Cool.
goal indonesia
What’s Happening i’m new to this, I stumbled upon this I’ve found It positively helpful and it has aided me out loads. I hope to contribute & assist other users like its helped me. Good job.
زي مابدكو
Thank you for the sensible critique. Me and my neighbor were just preparing to do a little research on this. We got a grab a book from our local library but I think I learned more from this post. I’m very glad to see such great information being shared freely out there.
ไฮโล
Valuable info. Lucky me I found your site by accident, and I’m shocked why this accident did not happened earlier! I bookmarked it.
Lucia Schrum
I?ve been exploring for a little bit for any high-quality articles or blog posts in this kind of area . Exploring in Yahoo I at last stumbled upon this website. Reading this info So i?m happy to exhibit that I have a very good uncanny feeling I discovered exactly what I needed. I such a lot indubitably will make sure to don?t forget this web site and provides it a look a relentless basis.
Francisco Leray
I’m really enjoying the design and layout of your blog. It’s a very easy on the eyes which makes it much more pleasant for me to come here and visit more often. Did you hire out a developer to create your theme? Great work!
릴게임다운로드
Great article post.Really looking forward to read more. Great.
Escort girl Paris
you are in point of fact a excellent webmaster. The website loading speed is incredible. It sort of feels that you’re doing any unique trick. Also, The contents are masterwork. you have performed a great process in this subject!
sbobet bola online
I was just looking for this information for a while. After six hours of continuous Googleing, finally I got it in your web site. I wonder what is the lack of Google strategy that do not rank this kind of informative sites in top of the list. Normally the top websites are full of garbage.
jumper rentals san diego
I do not even know how I ended up here, but I thought this post was good. I don’t know who you are but certainly you are going to a famous blogger if you aren’t already 😉 Cheers!
Neetish Sarda
I could not resist commenting. Perfectly written.
Samuel Mighty
e. Lead something that would benefit readers. Most likely you are able to help many others reap the benefits of your activities. Certainly it is easy to inspire visitors in certain way. Do not be scared to expose a little something about your self that lets visitors know alot more about who you are. It is not nearly running a blog for organization. Blogging is intended to become like pleasurable conversation.
검증사이트
Thanks a lot for the blog article.Really looking forward to read more.
Rob Lemoine
Or he almost accidentally wins a Darwin award, can’t tell.
lone tree spa
A round of applause for your article.Much thanks again. Will read on…
เช่าเก้าอี้
I’m impressed, I must say. Really rarely do I encounter a weblog that’s both educative and entertaining, and let me tell you, you may have hit the nail on the head. Your thought is outstanding; the issue is one thing that not sufficient people are talking intelligently about. I am very happy that I stumbled across this in my seek for something regarding this.
สมัครเล่นบาคาร่า w88
It is the best time to make some plans for the future and it’s time to be happy. I’ve read this post and if I could I wish to suggest you few interesting things or advice. Perhaps you could write next articles referring to this article. I wish to read more things about it!
thai driving license
Hi there! I could have sworn I’ve been to this website before but after looking at a few of the articles I realized it’s new to me. Anyways, I’m certainly pleased I came across it and I’ll be book-marking it and checking back regularly!
cheap id card
Really informative blog article.Much thanks again. Awesome.
Sabina Debien
Very nice post. I just stumbled upon your blog and wanted to say that I’ve really enjoyed browsing your blog posts. In any case I’ll be subscribing to your rss feed and I hope you write again soon!
bifold screen door
Pretty nice post. I just stumbled upon your blog and wanted to say that I’ve really enjoyed surfing around your blog posts. After all I’ll be subscribing to your feed and I hope you write again soon!
Alternative Zenware crystal necklaces
Excellent blog here! Also your web site loads up very fast! What host are you using? Can I get your affiliate link to your host? I wish my web site loaded up as quickly as yours lol
judi bola online
It’s best to take part in a contest for probably the greatest blogs on the web. I’ll recommend this website!
unicorn bouncy castles
Thanks for sharing, this is a fantastic blog post.Thanks Again. Great.
nuhairink.com
Thanks a lot for sharing this with all folks you really recognise what you’re speaking approximately! Bookmarked. Kindly additionally discuss with my website =). We will have a link alternate arrangement among us!
abc bouncy castle hire
Thank you for your blog article.Thanks Again. Will read on…
John Deere Service Manuals
Substantially, the post is really the sweetest on that precious topic. I fit in with your conclusions and will eagerly look forward to your coming updates. Just saying thanks will not just be enough, for the amazing lucidity in your writing. I will at once grab your rss feed to stay abreast of any kind of updates. Genuine work and also much success in your business efforts!
YouVive
I really like it when people get together and share thoughts. Great site, keep it up!
walk in hairdressers hampstead
Muchos Gracias for your article.Really thank you! Much obliged.
German Shepherd dog
Appreciate you sharing, great blog post.Much thanks again. Much obliged.
state
Your style is so unique in comparison to other folks I have read stuff from. Thank you for posting when you ave got the opportunity, Guess I will just book mark this web site.
dildo blowjob
Enjoyed every bit of your post.Really thank you! Awesome.
German Shepherd
Thanks for the blog post. Keep writing.
Armitage
I’ve included this post to my bookmarks
YouVive
Very good info. Lucky me I discovered your website by chance (stumbleupon). I have book marked it for later!
YouVive
I could not refrain from commenting. Very well written!
Mesothelioma
Im obliged for the blog post.Much thanks again. Fantastic.
Tryot
I was able to find good advice from your blog posts.
Tryot
Aw, this was an extremely nice post. Spending some time and actual effort to make a good article… but what can I say… I hesitate a whole lot and never seem to get anything done.
restaurant menus
wow, awesome post.Much thanks again. Awesome.
바다이야기
Major thanks for the blog post.Really thank you! Will read on…
먹튀업체
Enjoyed every bit of your blog article.Thanks Again.
PhenQ
I couldn’t resist commenting. Perfectly written.
안전공원
Fantastic blog article.Much thanks again. Much obliged.
sikiş izle
animal porn izle buy google hacklin satın al.
site
I visited several web sites except the audio feature for
audio songs existing at this web page is truly superb.
먹튀업체
Major thanks for the article.Really looking forward to read more. Much obliged.
forex trading software
One more thing. I think that there are several travel insurance web sites of respectable companies that let you enter your holiday details and acquire you the insurance quotes. You can also purchase the actual international travel insurance policy online by using the credit card. Everything you should do should be to enter your own travel particulars and you can see the plans side-by-side. You only need to find the package that suits your finances and needs and then use your credit card to buy it. Travel insurance on the internet is a good way to do investigation for a trustworthy company regarding international holiday insurance. Thanks for discussing your ideas.
avengers
I really appreciate this post. I have been looking all over for this! Thank goodness I found it on Bing. You’ve made my day! Thanks again!
Bondage pornography
Thank you for the auspicious writeup. It in reality used to be a leisure account it. Glance complicated to more added agreeable from you! However, how could we communicate?
Gerry Stack
Hi, I believe your website could possibly be having web browser compatibility problems. Whenever I take a look at your site in Safari, it looks fine however, when opening in Internet Explorer, it’s got some overlapping issues. I just wanted to provide you with a quick heads up! Aside from that, excellent site!
SAEF
Im thankful for the article.Much thanks again. Much obliged.
free porn
free porn
Floy Hupf
http://genki365.net/gnka01/common/redirect.php?url=https://anon-v.com
토토사이트
Thank you ever so for you blog post. Awesome.
buy hacklins
free porn watch
Wilmer Kennet
I enjoy reading through a post that will make people think. Also, thank you for allowing for me to comment.
silk flower arrangements
Only wanna comment on few general things, The website design and style is perfect, the articles is real good : D.
카지노사이트
Major thanks for the article post. Will read on…
useful content
“wow, awesome blog post.Thanks Again. Great.”
Catharine Roesner
Everything is very open with a really clear clarification of the issues. It was really informative. Your site is extremely helpful. Thanks for sharing!
buy haclinks
animal porn watch
fr.behappyfamily.com
It is appropriate time to make some plans for the longer term and it’s time to be happy. I have read this put up and if I may just I want to suggest you some fascinating issues or tips. Maybe you can write next articles referring to this article. I desire to read more things about it!
Angebote
Thanks for your own effort on this blog. Debby delights in carrying out investigations and it’s really easy to see why. All of us learn all concerning the dynamic ways you present sensible tips via the web site and as well cause contribution from other individuals on the issue then my princess is now learning a lot of things. Have fun with the remaining portion of the new year. You have been conducting a great job.
Gwenn Kirtner
http://www.force10networks.com/news/inthenews/exit.asp?link=https://anon-v.com
Situs Judi Online
Definitely believe that which you stated. Your favorite reason seemed to be on the internet the simplest thing to be aware of. I say to you, I definitely get annoyed while people consider worries that they just do not know about. You managed to hit the nail upon the top and defined out the whole thing without having side-effects , people can take a signal. Will probably be back to get more. Thanks
taruhan online
I gotta bookmark this internet site it seems extremely helpful extremely helpful
buy haclinks
buy haclinks
Rachelle Duplessis
I love looking through an article that will make men and women think. Also, many thanks for permitting me to comment.
Tractor Workshop Manuals
Isn’t it entertaining if we always talk about topics like that.:;-:~
W88 ดีไหม
Thanks for your ideas. One thing I have noticed is the fact that banks along with financial institutions really know the spending behaviors of consumers while also understand that most of the people max out there their real credit cards around the holidays. They smartly take advantage of this kind of fact and then start flooding the inbox as well as snail-mail box with hundreds of no-interest APR credit card offers soon after the holiday season concludes. Knowing that if you’re like 98 of the American general public, you’ll hop at the opportunity to consolidate credit debt and shift balances for 0 apr interest rates credit cards.
Aluminum Bi Folding Door
I’ll immediately grab your rss as I can’t find your email subscription link or e-newsletter service. Do you’ve any? Please let me know in order that I could subscribe. Thanks.
how many clients do life coaches have
I like this site so much, saved to fav. “I don’t care what is written about me so long as it isn’t true.” by Dorothy Parker.
Organicana
I have read some excellent stuff here. Definitely price bookmarking for revisiting. I surprise how so much attempt you set to create this kind of excellent informative web site.
Bud Zapata
Way cool! Some extremely valid points! I appreciate you writing this article and the rest of the website is also really good.
animal porn watch
porn watch
an sang ngon q3
I’ve learn several good stuff here. Certainly worth bookmarking for revisiting. I surprise how much attempt you place to make such a magnificent informative site.
Tien Mcshan
bookmarked!!, I like your blog.
jumper rentals san diego
I’m so happy to read this. This is the kind of manual that needs to be given and not the random misinformation that is at the other blogs. Appreciate your sharing this greatest doc.
waste audits and analysis
Thanks again for the blog.Much thanks again. Will read on…
5fmdmb2201
Appreciate you sharing, great blog post.Really thank you! Really Cool.
Poker Online Terbesar
I was suggested this blog by my cousin. I am not sure whether this post is written by him as no one else know such detailed about my trouble. You’re amazing! Thanks!
poker online
I’ll right away grab your rss feed as I can’t find your email subscription link or newsletter service. Do you’ve any? Kindly let me know in order that I could subscribe. Thanks.
메이저놀이터
Thanks for the post.Thanks Again. Great.
Lash Stuff
Your style is unique in comparison to other people I’ve read stuff from. Thank you for posting when you have the opportunity, Guess I will just book mark this web site.
NBA Stream
Hi there, i read your blog from time to time and i own a similar one and i was just curious if you get a lot of spam remarks? If so how do you prevent it, any plugin or anything you can suggest? I get so much lately it’s driving me crazy so any assistance is very much appreciated.
BTS Hoodie
Only a smiling visitor here to share the love (:, btw great style and design .
Furniture assembly handyman
Fantastic items from you, man. I have take into accout your stuff previous to and you are just extremely magnificent. I really like what you have acquired here, really like what you’re stating and the way in which wherein you assert it. You’re making it entertaining and you continue to care for to stay it sensible. I can’t wait to learn much more from you. That is really a great site.
shopclues tata safari winner list 2019
Your posts provide a clear, concise description of the issues.
먹튀사이트
Really informative post.Really looking forward to read more. Much obliged.
Senamasasandalye
Good article. I will be dealing with many of these issues as well..
yo gotti
I have read a few good stuff here. Definitely worth bookmarking for revisiting. I surprise how a lot attempt you set to make this type of wonderful informative web site.
forced scat porn
Say, you got a nice post.Really looking forward to read more. Keep writing.
secret 6 keys to success
excellent points altogether, you simply received a emblem new reader. What would you recommend about your submit that you simply made a few days in the past? Any sure?
TV stand
Excellent read, I just passed this onto a colleague who was doing some research on that. And he actually bought me lunch since I found it for him smile So let me rephrase that: Thanks for lunch!
Ahmaya
Ahmaya Johannesen, 1/60 Bronte Road, Bondi Junction NSW 2022 Australia, Phone: 02 9386 9610, Mobile: 0401 848 742, Email: ahmaya@ahmaya.com
boudi xvideo
Im grateful for the post.Thanks Again. Awesome.
garden bouncy castle bexley
Major thankies for the article post.Thanks Again. Keep writing.
bistro masa
Hey, thanks for the blog.Really looking forward to read more. Fantastic.
apkcloud
I have been curious about these trends, and you have really helped me. I have just told a few of my friends about this on FaceBook and they love your content just as much as I do.
childrens bouncy castle hire in hackney
Really informative article post. Fantastic.
mofasse.me
Glad to be one of many visitants on this amazing site : D.
confetti
Heya i am for the first time here. I found this board and I to find It truly useful & it helped me out a lot. I’m hoping to provide one thing again and help others like you aided me.
funtime bouncy castles bexley
I loved your article.Really thank you! Cool.
bouncy slide
I think this is a real great blog article.Thanks Again. Really Cool.
먹튀업체
Appreciating the time and energy you put into your website and in depth information you present. It’s great to come across a blog every once in a while that isn’t the same outdated rehashed material. Great read! I’ve bookmarked your site and I’m adding your RSS feeds to my Google account.
office furniture assembly
I was very pleased to find this internet-site.I needed to thanks to your time for this glorious read!! I definitely enjoying every little little bit of it and I have you bookmarked to take a look at new stuff you weblog post.
Karagiannis
Hi there, just became alert to your blog through Google, and found that it’s really informative. I am gonna watch out for brussels. I will be grateful if you continue this in future. A lot of people will be benefited from your writing. Cheers!
Furniture Outlet
You made some clear points there. I did a search on the topic and found most persons will agree with your site.
Furniture Assembly service
Simply a smiling visitor here to share the love (:, btw outstanding pattern. “Treat the other man’s faith gently it is all he has to believe with.” by Athenus.
Top Websites
http://hundred-dollar.com/__media__/js/netsoltrademark.php?d=aulaporn.com
야마토
We are a group of volunteers and opening a new scheme in our community. Your web site offered us with valuable info to work on. You have done a formidable job and our whole community will be grateful to you.
world's most sexiest SEO
Wow, great article.Much thanks again. Will read on…
Nesava Store
I’m more than happy to uncover this site. I wanted to thank you for ones time for this particularly fantastic read!! I definitely really liked every bit of it and i also have you saved to fav to look at new things in your web site.
best cannabidiol oil
Very good post.Really thank you! Awesome.
cambodian money
I’m very pleased to find this page. I wanted to thank you for your time for this particularly fantastic read!! I definitely really liked every little bit of it and i also have you saved as a favorite to see new stuff in your site.
Premium Sites
http://you-are-hired.net/__media__/js/netsoltrademark.php?d=aulaporn.com
토토메이저
You could certainly see your enthusiasm in the work you write. The arena hopes for even more passionate writers like you who aren’t afraid to mention how they believe. At all times go after your heart.
Agen Poker
Major thankies for the blog post.Much thanks again. Fantastic.
@newbeginnings410reps
Just wish to say your article is as astonishing. The clearness in your post is just spectacular and i can assume you’re an expert on this subject. Fine with your permission allow me to grab your RSS feed to keep updated with forthcoming post. Thanks a million and please continue the gratifying work.
먹튀사이트 팬더
Thanks-a-mundo for the post. Will read on…
메이저놀이터
I loved your article post.Much thanks again. Fantastic.
sky Scannings
This web site certainly has all the information I needed concerning this subject and didn’t know who to ask.
릴게임사이트
Very informative blog post.Much thanks again. Will read on…
Kacy Manford
My spouse and i got so joyful that Ervin managed to carry out his studies via the ideas he got while using the web page. It’s not at all simplistic to simply happen to be freely giving guidance which often the rest might have been making money from. And we all discover we have got you to be grateful to for that. All the illustrations you’ve made, the simple web site menu, the friendships your site give support to promote – it is mostly sensational, and it’s really letting our son and us know that this situation is brilliant, which is especially indispensable. Thanks for all!
토토웹
Fantastic blog.Really thank you! Fantastic.
วิธี เล่น ไฮโล ออนไลน์ ให้ ได้ เงิน
I am curious to find out what blog platform you happen to be working with? I’m having some minor security issues with my latest site and I’d like to find something more secure. Do you have any solutions?
สล็อตเครดิตฟรี 100 ไม่ต้องแชร์
Greetings I am so delighted I found your web site, I really found you by error, while I was looking on Aol for something else, Anyways I am here now and would just like to say cheers for a incredible post and a all round enjoyable blog (I also love the theme/design), I don’t have time to browse it all at the moment but I have saved it and also included your RSS feeds, so when I have time I will be back to read a lot more, Please do keep up the superb job.
จัดงานแต่งงาน
Hello! I know this is somewhat off topic but I was wondering if you knew where I could find a captcha plugin for my comment form? I’m using the same blog platform as yours and I’m having problems finding one? Thanks a lot!
Leigh Villerreal
Hi there! This article could not be written much better! Looking at this post reminds me of my previous roommate! He always kept preaching about this. I’ll forward this post to him. Pretty sure he will have a great read. I appreciate you for sharing!
Venus Hair Restoration
I always read your articles carefully. I’m also interested in bitcoin price, perhaps you might write about this sometimes. See you.
Wilbur Aben
You really make it seem really easy along with your presentation however I find this topic to be actually somethingthat I think I might never understand. It sort of feels too complex and extremely vastfor me. I’m taking a look ahead on your subsequent publish, I’ll try to get thedangle of it!
Premium Sites
http://bart-stewart.com/__media__/js/netsoltrademark.php?d=www.fairporn.net
Lenora Blakeslee
Great article. I will be dealing with a few of these issues as well..
polka dot maxi dress
wow, awesome post.
https://google.cn/search?source=hp&ei=8Ma7Xa3EJMv6wQOlrL-QBQ&q=https3A2F2Fvanmiubeauty.com2Fnghe-trang-diem-co-kiem-duoc-nhieu-tien-khong-co-de-khong2F&oq=https3A2F2Fvanmiubeauty.com2Fnghe-trang-diem-co-kiem-duoc-nhieu-tien-khong-co-de-khong2F
I do trust all of the ideas you’ve offered on your post. They are really convincing and will definitely work. Still, the posts are very short for starters. Could you please prolong them a little from subsequent time? Thanks for the post.
doorwin windows and doors
Great tremendous issues here. I am very glad to peer your post. Thank you a lot and i am looking ahead to contact you. Will you kindly drop me a e-mail?
cannabidiol pills
Unquestionably believe that which you stated. Your favorite justification seemed to be on the web the easiest thing to be aware of. I say to you, I definitely get irked while people think about worries that they just do not know about. You managed to hit the nail upon the top and defined out the whole thing without having side-effects , people could take a signal. Will probably be back to get more. Thanks
cannabidiol
Thanks a bunch for sharing this with all of us you really know what you’re talking about! Bookmarked. Kindly also visit my site =). We could have a link exchange agreement between us!
Venice Maaske
I really appreciate this post. I’ve been looking everywhere for this! Thank goodness I found it on Bing. You’ve made my day! Thanks again!
Paysites List
http://alloysurfcaesinc.info/__media__/js/netsoltrademark.php?d=www.fairporn.net
Click Here
Appreciate you sharing, great blog.Really thank you! Great.
Top Premium Sites
http://climatecommons.com/__media__/js/netsoltrademark.php?d=www.fairporn.net
wtfast 4.13.3.1828 Crack
A round of applause for your blog post.Really thank you! Really Cool.
Top Websites
http://otdix-u-mory.ru/sql.php?=www.fairporn.net/
สมัคร แทง บอล ฟรี 200
I’ll right away take hold of your rss as I can’t to find your e-mail subscription link or newsletter service. Do you’ve any? Please let me recognize so that I may just subscribe. Thanks.
ไพ่ป๊อกเด้ง ฟรี
I really like your writing style, superb information, thanks for posting : D.
Asha Buschmann
This is a topic that’s close to my heart… Cheers! Exactly where are your contact details though?
Click here
Amazing blog! Is your theme custom made or did you download it from somewhere? A theme like yours with a few simple adjustements would really make my blog jump out. Please let me know where you got your design. Many thanks
สยามสมาคม ราคา
My brother recommended I might like this blog. He was totally right. This post truly made my day. You cann’t imagine simply how much time I had spent for this info! Thanks!
เช่า เต็นท์ โต๊ะ เก้าอี้ ภูเก็ต
fantastic points altogether, you simply received a new reader. What could you recommend about your put up that you made a few days in the past? Any certain?
plenty of fish dating site
What’s up, after reading this remarkable article i am also cheerful to share my knowledge here with friends.
web designing course
Im grateful for the article.Thanks Again. Will read on…
Laureen Carmichael
I’d like to thank you for the efforts you have put in writing this site. I’m hoping to check out the same high-grade content by you in the future as well. In truth, your creative writing abilities has inspired me to get my own, personal blog now 😉
King Buysse
I was very happy to find this website. I wanted to thank you for your time just for this fantastic read!! I definitely really liked every part of it and i also have you saved as a favorite to see new things on your website.
야마토
Im grateful for the blog post. Want more.
satta king
Excellent read, I just passed this onto a friend who was doing a little research on that. And he just bought me lunch because I found it for him smile Therefore let me rephrase that: Thanks for lunch!
메이저놀이터
Hey, thanks for the blog.Thanks Again. Cool.
Super Bowl 2020
That is very interesting, You’re an excessively professional blogger. I’ve joined your rss feed and look forward to searching for more of your fantastic post. Additionally, I have shared your web site in my social networks!
먹튀폴리스
Very good blog. Really Great.
먹튀사이트 웹툰
A big thank you for your blog.Really looking forward to read more. Want more.
Charlesfug
does sam’s club sell cialis or viagra
Charlesfug
vardenafil 10 mg
Michaelvar
blink health generic sildenafil
Charlesfug
buy allopurinol
Stewartniz
tadalafil
Jospeh Corseri
I really like it when folks come together and share views. Great site, keep it up.
anturamuotti
Thanks so much for the article post.Really looking forward to read more. Really Cool.
cheats
Its like you read my mind! You seem to know so much about this, like you wrote the book in it or something. I think that you could do with some pics to drive the message home a bit, but instead of that, this is magnificent blog. A great read. I’ll definitely be back.
windräder ratingen
A person necessarily help to make seriously posts I’d state. This is the very first time I frequented your web page and so far? I amazed with the analysis you made to create this actual post amazing. Fantastic process!
wintergarten düsseldorf
One thing I’d like to reply to is that weightloss program fast can be performed by the perfect diet and exercise. Ones size not merely affects appearance, but also the quality of life. Self-esteem, melancholy, health risks, and physical skills are damaged in an increase in weight. It is possible to do everything right whilst still having a gain. Should this happen, a medical problem may be the perpetrator. While a lot food rather than enough exercising are usually at fault, common health conditions and key prescriptions might greatly add to size. I am grateful for your post in this article.
bouncy castle hire in bexley
Thanks for sharing, this is a fantastic blog article. Will read on…
Nga Belangia
This is a topic that’s near to my heart… Take care! Where can I find the contact details for questions?
Relationship Advice
Thank you ever so for you post.Thanks Again.
Michaelvar
http://www.tadalafila1c.com
Charlesfug
cheap tadalafil
Charlesfug
who buys albuterol sulfate for nebulizers
Charlesfug
i take remicade infusions, is it ok to take 20 mg of prednisone while on remicade?
Charlesfug
canadian sildenafil citrate suppliers
Dating Coach London
Major thankies for the blog article.Really thank you! Much obliged.
relationship advice for men
Appreciate you sharing, great blog post.Much thanks again.
Dimple Terando
Wonderful job on the post. Learned tons.
bandar bola
I¡¦ve been exploring for a little for any high quality articles or blog posts on this kind of area . Exploring in Yahoo I ultimately stumbled upon this website. Reading this information So i am glad to show that I’ve an incredibly just right uncanny feeling I came upon just what I needed. I most definitely will make sure to do not fail to remember this website and give it a glance regularly.
agen judi online
It’s laborious to search out educated people on this matter, but you sound like you understand what you’re speaking about! Thanks
Amendola
There are definitely a variety of details like that to take into consideration. That may be a great level to bring up. I supply the thoughts above as general inspiration but clearly there are questions like the one you bring up where crucial thing can be working in sincere good faith. I don?t know if greatest practices have emerged round issues like that, however I am certain that your job is clearly identified as a fair game. Each girls and boys feel the affect of just a moment’s pleasure, for the rest of their lives.
Michaelvar
http://tadalafila1c.com
shopier instagram
instagram takipçi google buy hacklink sosyopal.
사설토토
Major thanks for the post.Really thank you!
먹튀사이트 조회
Looking forward to reading more. Great post.Thanks Again. Fantastic.
Charlesfug
cialis without a prescription…safe?
Charlesfug
chest pain advers effect to albuterol
Charlesfug
http://1stbaclofen.com
Charlesfug
kamagra price in mumbai
Zee Tv
Really informative blog article.Much thanks again. Want more.
Michaelvar
prednisolone 5mg tablets to buy
Charlesfug
http://www.cialisa1c.com
John Deere Diagnostic and Test Manuals
Can I just say what a aid to seek out someone who really knows what theyre speaking about on the internet. You definitely know the way to carry a difficulty to mild and make it important. More people need to read this and perceive this aspect of the story. I cant imagine youre not more fashionable because you positively have the gift.
Charlesfug
cheap suhagra
Charlesfug
will prednisone correct liver
Charlesfug
prescription 3 times a day
website
bionlukcom backlinkc seri indexleme
메이저사이트 추천
Hey, thanks for the blog article.Much thanks again. Fantastic.
Relationship advice article
Enjoyed every bit of your post.Much thanks again.
coconut oil where
Wow! This blog looks exactly like my old one! It’s on a completely different subject but it has pretty much the
same page layout and design. Superb choice of colors!
Daily News
Tһanks for your marvelouis posting! І truly ennoyed reading іt, yoᥙ
mayy be ɑ great author.I will ensure that I bookmark yoսr blog аnd
will cоme back lаter on. I wаnt to encourage yоu
continue ʏoᥙr great writing, have a nice morning!
วิธีเล่นไพ่เก้าเก
I’m still learning from you, while I’m improving myself. I definitely enjoy reading everything that is written on your blog.Keep the stories coming. I loved it!
Gclub
A big thank you for your article.Really thank you! Keep writing.
Depression Counselling
This is one awesome blog post.Really thank you! Will read on…
Michaelvar
tadalafil generic cost
Charlesfug
cheap cialis
my first time having sex
Im grateful for the article post.Really thank you! Want more.
adam and eve coupons
Appreciate you sharing, great article. Great.
Stewartniz
xenical side effect
Charlesfug
amoxicillin 800 mg tablet
Charlesfug
vardenafil accord 10 mg
Charlesfug
sildenafil citrate tablets 100 mg malegra pro 100
Ranee Votraw
Next time I read a blog, Hopefully it does not fail me as much as this particular one. After all, I know it was my choice to read through, however I genuinely believed you would probably have something helpful to talk about. All I hear is a bunch of whining about something you can fix if you weren’t too busy seeking attention.
Miss Date Doctor
Very good post.Thanks Again. Much obliged.
Miss Date Doctor
I really liked your blog post.Thanks Again. Want more.
Michaelvar
cialis
Charlesfug
http://www.cialis0z.com
메이저토토
I am so grateful for your article post. Want more.
best CBD oil for pain
Thanks for the blog article. Will read on…
Charlesfug
class of meds of sildenafil
Charlesfug
cheap advair
Charlesfug
norman oklahoma pharmacy advertising sildenafil citrate
Michaelvar
http://prednisolone0l1.com
sattakingnow.in
whoah this blog is great i really like reading your posts. Keep up the great work! You realize, lots of people are searching around for this information, you can aid them greatly.
Charlesfug
propecia – finasterida – 1 mg
battery powered socks
One more thing. I really believe that there are a lot of travel insurance websites of dependable companies that allow you to enter your holiday details and find you the quotations. You can also purchase the particular international holiday insurance policy on the web by using your credit card. All that you should do is usually to enter your travel particulars and you can start to see the plans side-by-side. Merely find the program that suits your finances and needs then use your bank credit card to buy it. Travel insurance on the internet is a good way to do investigation for a dependable company to get international travel insurance. Thanks for revealing your ideas.
doorwin windows and doors
I truly appreciate this post. I¡¦ve been looking all over for this! Thank goodness I found it on Bing. You’ve made my day! Thx again
Charlesfug
generic viagra mail order s carolina
Charlesfug
prednisone 20 mg image
Gail Frankum
The next time I read a blog, I hope that it won’t fail me as much as this one. I mean, I know it was my choice to read through, nonetheless I truly thought you’d have something helpful to say. All I hear is a bunch of moaning about something that you could possibly fix if you weren’t too busy seeking attention.
Michaelvar
buy cialis
메이저토토
I am not sure where you are getting your info, but good topic. I needs to spend some time learning more or understanding more. Thanks for magnificent information I was looking for this info for my mission.
먹튀검증
This is one awesome article post. Great.
메이저놀이터
Looking forward to reading more. Great blog article.Really thank you! Awesome.
Charlesfug
prednisone 5 mg tab dose pack 21
Charlesfug
vardenafil prices
Charlesfug
tadalafil manufacturer quality comparisons
Charlesfug
best deals on generic levitra
먹튀 사이트 검색 기
Very neat blog post.Really looking forward to read more. Will read on…
메이저놀이터
Thanks so much for the blog post.Really looking forward to read more. Cool.
instagram takipçi satın al
begeni satin al
BrentBaiotto
I truly appreciate this blog.Really thank you! Really Great.
double ended strap on harness
Very neat article post. Cool.
Stewartniz
adcirca price
Sexo Viagra
Pretty! This was an incredibly wonderful article. Many thanks for providing this info.
Michaelvar
generic allopurinol
유아미술학원
Fantastic article. Really Great.
Charlesfug
http://www.prednisone0l1.com
Charlesfug
how often to take albuterol
Dewayne Mascorro
Very good post. I’m facing a few of these issues as well..
pppttrreee
Let’s go
Charlesfug
http://buymobic.us.com
Charlesfug
http://www.crestor.us.com
Michaelvar
does cialis help with low testosterone
Elbert Zacher
This page certainly has all of the information I needed concerning this subject and didn’t know who to ask.
Charlesfug
how stronag are 5mg prednisone tablets?
Charlesfug
http://www.tadacip.us.com
imp source
I loved your article post. Keep writing.
microwave panasonic
If you wish for to obtain much from this
article then you have to apply such techniques to your won website.
Stewartniz
http://viagran1p.com
사설토토
I loved your blog.Really thank you! Fantastic.
Charlesfug
generic mobic
Charlesfug
consumer health watch kamagra
Michaelvar
buy allopurinol
Charlesfug
allentown pharmacy viagra price
Like
Photo Liker, ZFN Liker, Increase Likes, Status Liker, Photo Auto Liker, Auto Liker, Status Auto Liker, autolike, Autoliker, Auto Like, Autoliker, Autolike International, auto like, Working Auto Liker, auto liker, Autolike, autoliker
Charlesfug
generic baclofen
Super Bowl 2020 Live Streaming
I cling on to listening to the rumor lecture about getting free online grant applications so I have been looking around for the finest site to get one. Could you advise me please, where could i acquire some?
สมัคร w88 ไม่ได้
F*ckin’ amazing things here. I am very glad to see your post. Thanks a lot and i’m looking forward to contact you. Will you kindly drop me a mail?
best CBD oil for pain
I like what you guys are up too. Such smart work and reporting! Carry on the superb works guys I have incorporated you guys to my blogroll. I think it will improve the value of my web site :).
Michaelvar
tadalafil and psa levels
Charlesfug
overdose lexapro and aderal mixed
Charlesfug
buy propecia
Petluvshop
Saved as a favorite, I love your web site!
Kadenang Ginto Replay Episode
A big thank you for your post.Thanks Again. Really Great.
Charlesfug
lisinopril
Petluvshop
This is a really good tip particularly to those fresh to the blogosphere. Short but very precise info… Thank you for sharing this one. A must read post!
Starla Replay Episode
Great blog.Much thanks again. Will read on…
Charlesfug
chewable tadalafil
Clash Of Clans Crack full version free download
Say, you got a nice blog post.Really looking forward to read more. Really Great.
Michaelvar
cheap cialis daily india
Theodore Wetz
Everything is very open with a very clear explanation of the challenges. It was really informative. Your website is very helpful. Thank you for sharing.
More info
Amazing blog! Is your theme custom made or did you download it from somewhere? A theme like yours with a few simple adjustements would really make my blog jump out. Please let me know where you got your design. Many thanks
Charlesfug
womenra sildenafil 100mg
Charlesfug
generic male enhancement pills
Stefan Cockerill
Excellent post. I will be facing a few of these issues as well..
immigration canada
I will right away take hold of your rss feed as I can’t find your e-mail subscription hyperlink or e-newsletter service. Do you’ve any? Please let me recognise in order that I may subscribe. Thanks.
Charlesfug
get zithromax without a prescription
Furniture Assembly DC
I just like the helpful information you supply in your articles. I’ll bookmark your weblog and test once more here regularly. I’m rather sure I’ll be informed a lot of new stuff right here! Best of luck for the following!
greg bahnsen apologetic
Excellent read, I just passed this onto a colleague who was doing some research on that. And he just bought me lunch since I found it for him smile Thus let me rephrase that: Thanks for lunch!
tinyurl.com
I used to be suggested this web site by way of my cousin. I am not
sure whether or not this submit is written by way
of him as nobody else recognise such targeted approximately my problem.
You’re incredible! Thanks!
Charlesfug
levitra 20 mg para que sirve
Ishq Subhan Allah Episode
Thank you for your blog article.Really looking forward to read more. Keep writing.
bondage handcuffs
Great article. Keep writing.
instagram 1 milyon takipçi hilesi
instagram takipçi satın al ucuz ve hızlı sizde hemen fenomen olun
Michaelvar
http://www.sildenafild9z.com
Stewartniz
what is the generic brand for lexapro
http://tinyurl.com/r4qb4sz
Hi there to every , because I am genuinely eager of reading this weblog’s post to be updated daily.
It includes pleasant data.
best g spot vibrator
I truly appreciate this blog article.Really looking forward to read more. Want more.
Charlesfug
metformin 2000 mg pcos weight loss
Furniture assembly DC
Awesome blog! Do you have any helpful hints for aspiring writers? I’m planning to start my own site soon but I’m a little lost on everything. Would you advise starting with a free platform like WordPress or go for a paid option? There are so many options out there that I’m completely confused .. Any tips? Cheers!
EuroWarsztat
Excellent blog right here! Also your website a lot up fast! What web host are you using? Can I am getting your associate link to your host? I desire my website loaded up as fast as yours lol
Charlesfug
http://www.allopurinol0l1.com
tightening gel
Im thankful for the blog article.Thanks Again. Keep writing.
Furniture assembly DC
What’s Happening i am new to this, I stumbled upon this I’ve found It absolutely helpful and it has aided me out loads. I hope to contribute & help other users like its helped me. Great job.
Charlesfug
cheap crestor
whatsapp bulk web based panel
wow, awesome article.Really thank you! Fantastic.
Charlesfug
is it safe to take 2000 mg of metformin at once
Michaelvar
cheap prednisone
토토사이트
Im thankful for the blog post.Much thanks again. Want more.
Cannabidiol
Great article.Much thanks again. Will read on…
4fadb
wow, awesome article post.Really thank you! Much obliged.
диски r15 4x100
hi!,I love your writing very much! proportion we communicate extra approximately
your post on AOL? I need an expert in this
house to resolve my problem. Maybe that is you! Taking a look ahead
to peer you.
Charlesfug
cialis from canadian pharmacy
Charlesfug
kamagra gel order
Charlesfug
tadalafil 5mg – erectafil-5 – marley generic sildenafil
Charlesfug
buy crestor
Michaelvar
purchase prescriptions online
web site
instagram takipçi satın al ucuz ve hızlı sizde hemen fenomen olun
Easter Watford
Greetings! Very useful advice within this article! It’s the little changes that make the most significant changes. Thanks for sharing!
Charlesfug
side effects of metformin 500 mg for metabolic syndrome
Free Porn Videos -JavMama
Great blog you’ve got here.. It’s hard to find quality writing like yours these days.
I honestly appreciate people like you! Take care!!
hds
Découvrez le catalogue complet des films et séries les plus attendu par
les cinéphiles. Un accès illimité et gratuit avec qualité full HD et Vf et Vostfr.
klempner
very good submit, i definitely love this web site, keep on it
Baltimore Picture hanging
This actually answered my drawback, thank you!
Charlesfug
generic stromectol
Charlesfug
http://suhagra.us.com
Charlesfug
cheap suhagra
Michaelvar
sildenafil directions
best CBD oil for pain
Hey, thanks for the blog post. Much obliged.
Stewartniz
warfarin and viagra interaction
Situs Domino QQ
Hi there, just wanted to tell you, I loved this blog post.
It was helpful. Keep on posting!
Charlesfug
sildenafil
Best cbd oil for pain
I love it whenever people come together and share opinions. Great website, continue the good work.
Michaelvar
propecia
Charlesfug
metformin was is the pregnancy rate
Charlesfug
can i get viagra at a pharmacy with out a perscription in ixtapa mexico
Charlesfug
metformin er 1000mg price
DC picture hanging service
Hello there! This post could not be written any better! Reading this post reminds me of my good old room mate! He always kept talking about this. I will forward this write-up to him. Fairly certain he will have a good read. Thanks for sharing!
pc games full version download
I simply couldn’t go away your web site prior to suggesting that I really enjoyed the standard info a person provide for your guests? Is going to be back regularly in order to check out new posts
Charlesfug
viagra is government funded
Michaelvar
http://www.lisinopril0l1.com
먹튀폴리스 카톡
Pretty part of content. I just stumbled upon your weblog and in accession capital to assert that I get actually loved account your blog posts. Any way I’ll be subscribing to your feeds or even I achievement you get right of entry to persistently fast.
메이저놀이터
Great amazing things here. I am very happy to see your article. Thank you so much and i am looking forward to contact you. Will you please drop me a e-mail?
Charlesfug
cheap mobic
Charlesfug
vardenafil 40 mg med rx
Charlesfug
best place to buy cialis in canada
http://tinyurl.com/sr39tj3
Hello! This post couldn’t be written any better! Reading this post reminds
me of my old room mate! He always kept talking about this.
I will forward this page to him. Pretty sure he will have a good read.
Many thanks for sharing!
Hotmail iniciar sesion
I’d like to thank you for the efforts you have put in penning this blog. I really hope to view the same high-grade blog posts from you later on as well. In fact, your creative writing abilities has motivated me to get my own, personal website now 😉
Charlesfug
potential side effects of the drug deltasone or prednisone
anchor
Really appreciate you sharing this article post.Really thank you! Want more.
Michaelvar
xenical still used
Senior Care
I could not resist commenting. Exceptionally well written!
pc games for windows xp
It is my belief that mesothelioma is definitely the most dangerous cancer. It has unusual qualities. The more I look at it the more I am convinced it does not work like a real solid cells cancer. If perhaps mesothelioma is really a rogue viral infection, in that case there is the probability of developing a vaccine plus offering vaccination to asbestos subjected people who are at high risk connected with developing long run asbestos relevant malignancies. Thanks for giving your ideas about this important ailment.
Charlesfug
buy kamagra fast delivery los angeles ca.
릴게임 다운로드
I have realized some points through your website post. One other stuff I would like to express is that there are several games available and which are designed specifically for preschool age kids. They consist of pattern acknowledgement, colors, dogs, and styles. These commonly focus on familiarization in lieu of memorization. This keeps little ones engaged without having the experience like they are learning. Thanks
가족놀이터
I was just searching for this info for a while. After 6 hours of continuous Googleing, finally I got it in your web site. I wonder what is the lack of Google strategy that don’t rank this type of informative websites in top of the list. Normally the top websites are full of garbage.
Charlesfug
vardenafil side effects
Charlesfug
levitra usa price
porn watch
silver porn
카지노사이트
Please let me know if you’re looking for a writer for your site.
You have some really good posts and I believe I would be a good asset.
If you ever want to take some of the load off, I’d really like to write some
articles for your blog in exchange for a link back to
mine. Please send me an e-mail if interested. Many thanks! https://woori88.com
murder short story
Major thanks for the blog article.Much thanks again. Really Great.
Charlesfug
cheap viagra
google buy hacklink
sopsosyal hacklink satın al ve 1 numara ol google.
Stewartniz
tadalafil greensboro nc
Michaelvar
how does prozac change your personality
Japanese porn
I got this web site from my buddy who told me on the topic of this web site and
at the moment this time I am visiting this web page and reading very informative
posts here.
there coconut oil
Thanks very nice blog!
Charlesfug
buy viagra
토토메이저
Very interesting points you have remarked, thankyou for posting . “Oh, what a tangled web we weave, When first we practice to deceive” by Sir Walter Scott.
Charlesfug
http://buymobic.us.com
Charlesfug
kamagra 100 mg
male masturbation
This is one awesome post.Really looking forward to read more. Much obliged.
Charlesfug
lisinopril 10mg, hctz 25 mg daily, bp 97/64
free app for pc download
I needed to compose you that very small word so as to thank you over again regarding the marvelous things you’ve discussed above. It is remarkably open-handed with you to supply extensively what many individuals might have offered for sale for an electronic book in making some dough for themselves, certainly seeing that you might have tried it if you ever decided. Those inspiring ideas as well served to be the good way to be sure that someone else have the identical eagerness the same as my very own to grasp many more on the topic of this matter. I think there are a lot more pleasurable occasions up front for many who looked at your blog.
Best Product Review
I got this web site from my friend who told me on the
topic of this web site and at the moment this time I am
browsing this web site and reading very informative articles or reviews at this time.
Michaelvar
zithromax for fish
HCG in Plains
Hi, Neat post. There is an issue with your web site in web explorer,
would test this? IE nonetheless is the marketplace chief and a big
part of folks will pass over your great writing because
of this problem.
Whitney
Hi, I check your blog on a regular basis. Your humoristic style is
awesome, keep up the good work!
plenty of fish dating site
What’s up Dear, are you in fact visiting this web site on a regular basis, if so after that you will without doubt
take good know-how.
Towel Bars
Awesome post.Really looking forward to read more. Really Great.
电影资讯
This info is worth everyone’s attention. Where can I find out more?
Charlesfug
tadalafil patient copay assistance
Senior Care
Hi friends, fastidious paragraph and fastidious urging commented at this
place, I am actually enjoying by these.
anal porn
sopsosyal hacklink satın al ve 1 numara ol google.
knowledge
That is a good tip especially to those fresh to the blogosphere.
Brief but very precise information… Thanks for sharing this one.
A must read post!
Charlesfug
can you buy ventolin over the counter in queensland
Charlesfug
cheap xenical
Charlesfug
ventolin et breo
pc games full version download
I’ve read some good stuff here. Definitely worth bookmarking for revisiting. I wonder how much effort you put to create such a great informative site.
Michaelvar
generic skelaxin
Charlesfug
skelaxin
릴게임
I just like the helpful info you supply for your articles. I will bookmark your blog and test again here frequently. I am slightly certain I’ll be told many new stuff proper here! Best of luck for the following!
scaffolding companies service london
When I originally commented I clicked the “Notify me when new comments are added” checkbox and now each time a
comment is added I get several emails with the same
comment. Is there any way you can remove people
from that service? Thanks!
Charlesfug
http://www.cleocingel.us.com
apk for pc
I have been browsing online more than 3 hours today, but I by no means discovered any interesting article like yours. It¡¦s lovely value enough for me. In my opinion, if all web owners and bloggers made just right content as you probably did, the net will likely be much more useful than ever before.
ให้ เช่า รถ ตู้ toyota alphard บริการ
I wanted to write a quick word to be able to say thanks to you for all of the unique advice you are posting at this site. My extensive internet investigation has at the end of the day been compensated with useful facts to exchange with my partners. I would declare that we site visitors actually are quite blessed to be in a useful website with very many marvellous people with useful techniques. I feel pretty fortunate to have seen the weblog and look forward to many more exciting times reading here. Thanks a lot once more for all the details.
Charlesfug
http://buymobic.us.com
Michaelvar
cheap fluoxetine
free games download for windows 8
I am so happy to read this. This is the type of manual that needs to be given and not the random misinformation that is at the other blogs. Appreciate your sharing this greatest doc.
Stewartniz
bitch stepmom gives stepson viagra
vibrating anal sex toy
Thanks so much for the blog article.Really looking forward to read more.
Charlesfug
http://www.genericmedrol.com
Furniture Assembly DC
Thanks a lot for sharing this with all of us you actually realize what you’re speaking about! Bookmarked. Kindly additionally visit my site =). We will have a link alternate arrangement between us!
buy instagram followers
famoid buy instagram followers and hacklink.
tạp chí doanh nghiệp và thương hiệu
tạp chí doanh nghiệp và thương hiệu la tap chi TOp 1 hang dau viet nam
happy new year Wishes
Im obliged for the article. Keep writing.
Charlesfug
first time cialis review
Darrell
Howdy I am so excited I found your site, I really found you by error,
while I was searching on Askjeeve for something else, Nonetheless I am here now and would just like to say thanks
a lot for a marvelous post and a all round enjoyable
blog (I also love the theme/design), I don’t have time to go through it all at the minute but I have saved it and also added
your RSS feeds, so when I have time I will be back to read a lot
more, Please do keep up the excellent work.
Michaelvar
http://www.buytoprolxl.team
Reparacion de tejados en Bilbao
Thanks for the article.Really thank you! Fantastic.
mobile valeting
Mobile valeting Swindon, mobile valet, Mobile valeting, mobile valet, Mobile valeting, mobile valet
impermeabilizaciones en Vitoria
I really like and appreciate your article post.Much thanks again. Awesome.
best cbd oil for pain
Can I simply say what a comfort to uncover somebody that actually understands what they are discussing over the internet. You definitely understand how to bring a problem to light and make it important. More people need to check this out and understand this side of the story. I can’t believe you are not more popular because you definitely possess the gift.
Charlesfug
http://zofran.us.com
money for lasik surgery
Hi, possibly i’m being a little off topic here, but I was browsing your site and it looks stimulating. I’m writing a blog and trying to make it look neat, but everytime I touch it I mess something up. Did you design the blog yourself?
Charlesfug
http://orderdiflucan.us.com
target ugly sweater
Hello my friend! I wish to say that this article is awesome, great written and
include almost all vital infos. I would like to peer extra posts like
this .
Michaelvar
what is zithromax and why is it perscribed
anal porn
vox buy instagram followers and hacklink.
ps4 games
Great beat ! I would like to apprentice whilst you amend your web site, how could i subscribe for a
weblog web site? The account aided me a acceptable deal.
I have been a little bit familiar of this your broadcast provided shiny
clear idea
부산출장샵
Hello there, You have done a fantastic job. I will certainly
digg it and personally recommend to my friends. I’m confident they’ll be benefited
from this site.
Furniture Assembly DC
I really like your writing style, excellent information, thanks for posting :D. “In every affair consider what precedes and what follows, and then undertake it.” by Epictetus.
instagram pornosu
buzzoid buy instagram followers and hacklink.
Www.Ctco.Ru
Howdy! This is kind of off topic but I need some advice
from an established blog. Is it hard to set up your own blog?
I’m not very techincal but I can figure things out pretty
fast. I’m thinking about making my own but I’m not sure where to begin. Do
you have any ideas or suggestions? With thanks
kids bouncy castle croydon
Very good blog post.Really looking forward to read more. Great.
dewapokerqq
Very good article. I will be experiencing some of these issues as well..
Charlesfug
glucophage
legitimate canadian mail order pharmacies
online pharmacy no prescription
viagra without a doctor prescription
real viagra without a doctor prescription
Michaelvar
generic tadalis
Mittie
I was excited to discover this website. I need to to thank you for ones time for this particularly wonderful read!!
I definitely loved every little bit of it and i also have you bookmarked to
see new information on your website.
Charlesfug
http://valtrex.us.com
İstanbul ankara nakliyat
WOC Coffee – World of Coffee açılımıyla 2018 yılında kahve kavurumu ile başlayan marka hayatına, internetten kahve satış ile devam eden bir kuruluştur (woccoffee.com).
Kendin için bir iyilik yap – kahve satın al sloganıyla nitelikli kahve, çekirdek kahve, filtre kahve, espresso kahve ve makine
– ekipman konusunda kaliteli ürünler satan WOC Coffee, sizler için uygun fiyatlarla online satış
sunuyor. Özenle kavurduğu kahve çekirdeklerini dünya kahvelerini; espresso kahve, kahve, nitelikli kahve ve
Türk kahvesi olarak gruplayabiliriz. Yüzünüzde tebessüm oluşturan filtre kahve ve diğer kahve
çeşitlerimizle vazgeçilmez online kahve satış siteniz haline geleceğiz.
İnternetten taptaze kahve satın almak isteyen değerli kahve severler için siparişlerinizi
kredi kartı ile ödeyerek verebilir ertesi gün ücretsiz kargo ile kapınıza gönderilmesini sağlayabilirsiniz.
Birçok dünya ülkesinin yöresel kahvelerini sizler için kavuruyoruz.
Büyük bir aşkla kavurduğumu birinci kalite kahve çekirdeklerimizi kokusu üzerinde ve taptaze olarak sizlere gönderiyoruz.
Hala ne bekliyorsunuz? Kahvem bitti diye üzülmeyin. WOC Coffee size internetten nitelikli ve filtre kahve sipariş imkanı sunuyor.
Kahve kalitemizi tadınca başka bir marka tercih etmeyeceksiniz.
Bunun garantisini sunduğumuz kaliteli ürünlerimizle belgeliyoruz.
İnternetten kahve ve kahve makine ekipman siparişi hiç bu
kadar kolay olmamıştı.
Türk kahvesi için alışılagelmiş markaların çekirdek kalitesi düşük kahveleri
yerine özenle kavrulan birinci kalite çekirdeklerle ürettiğimiz Türk kahvesi
vazgeçilmez tercihiniz olacak. Perakende satış yapmamızın yanı sıra toptan kahve satış imkanımız da bulunmaktadır.
Toptan kahve satışı için bizi aramanız yeterlidir.
Müşteri hizmetlerimiz kafeler için toptan kahve satışı konusunda size en uygun fiyatlarla kaliteyi sunacaktır.
best cbd oil for anxiety
Fantastic article post.Really thank you!
zburlea01
I am extremely inspired along with your writing talents as neatly as with the
layout to your blog. Is this a paid subject matter or did
you modify it your self? Either way keep up the nice high quality writing, it is uncommon to see a nice blog like
this one nowadays..
Stewartniz
buy ventolin
animal porn
famoid buy instagram followers and hacklink.
TV stand assembly service
Good – I should definitely pronounce, impressed with your website. I had no trouble navigating through all tabs as well as related info ended up being truly easy to do to access. I recently found what I hoped for before you know it at all. Quite unusual. Is likely to appreciate it for those who add forums or something, website theme . a tones way for your customer to communicate. Excellent task.
Charlesfug
buy cafergot
Michaelvar
cheap citalopram
armenian tv serials
Enjoyed every bit of your post. Want more.
Charlesfug
http://plavix.us.com
Maryland furniture assembly
Thank you for sharing excellent informations. Your website is so cool. I am impressed by the details that you have on this website. It reveals how nicely you understand this subject. Bookmarked this web page, will come back for extra articles. You, my pal, ROCK! I found simply the info I already searched all over the place and simply could not come across. What a perfect web site.
online pharmacies canada
online pharmacies
생방송경마
Its like you read my mind! You appear to know a lot about this, like you
wrote the book in it or something. I think that you could do with a few pics to drive the message home a bit, but instead of
that, this is great blog. An excellent read. I will certainly be back.
Radio Worldwide
Your style is unique in comparison to other folks I’ve read stuff from.
Many thanks for posting when you’ve got the opportunity,
Guess I’ll just bookmark this site.
Niesha Giraldo
Very good info. Lucky me I came across your website by accident (stumbleupon). I have book marked it for later.
Michaelvar
http://www.retinanorxprice.com
Charlesfug
cheap tadalafil
Charlesfug
cheap tadalafil
sleutel in slot laten zitten
When I initially commented I clicked the “Notify me when new comments are added” checkbox and now each time a comment is added I get several emails with the same comment. Is there any way you can remove me from that service? Thank you!
먹튀검증업체
I savor, lead to I discovered exactly what I was looking for. You’ve ended my 4 day lengthy hunt! God Bless you man. Have a nice day. Bye
quest bars cheap
Hi there, after reading this remarkable paragraph i am also happy to share my experience here
with colleagues.
social media e business
Great post. I used to be checking continuously this weblog and I am impressed!
Extremely useful info particularly the ultimate section 🙂 I deal with such information a lot.
I was seeking this particular info for a very lengthy
time. Thanks and best of luck.
http://tabletki-na-stawy2020.eu/flexa-plus.html
Extremely enlightening….look onward to coming back. http://tabletki-na-stawy2020.eu/flexa-plus.html
Michaelvar
http://zoloft.wtf
Charlesfug
http://www.buyclomid.us.org
Charlesfug
generic diclofenac
nios
My programmer is trying to persuade me to move to .net
from PHP. I have always disliked the idea because of the expenses.
But he’s tryiong none the less. I’ve been using
WordPress on numerous websites for about a year and am worried about switching to another platform.
I have heard good things about blogengine.net. Is
there a way I can transfer all my wordpress posts into it?
Any help would be greatly appreciated!
http://autohome.best/
You really make it seem so easy with your presentation but I find this matter to be actually something which I think
I would never understand. It seems too complicated
and very broad for me. I’m looking forward for your next post, I will try to
get the hang of it!
SPAM COMPANY!
An impressive share! I’ve just forwarded this onto a colleague who had been doing a little homework on this. And he actually bought me breakfast simply because I found it for him… lol. So allow me to reword this…. Thanks for the meal!! But yeah, thanx for spending some time to discuss this subject here on your web page.
her explanation
It’s amazing for me to have a web site, which is good in favor of my know-how. thanks admin
Stewartniz
kamagra buy india
Michaelvar
http://albendazole.us.org
Charlesfug
http://www.lipitor.golf
Charlesfug
generic furosemide
bursamobiljogja
Attractive section of content. I just stumbled upon your weblog and in accession capital to assert that I acquire in fact enjoyed account your blog posts.
Anyway I will be subscribing to your augment and even I achievement
you access consistently quickly.
Tracy
Hey there! This is my 1st comment here so I just wanted to give a quick shout
out and tell you I really enjoy reading through your
articles. Can you recommend any other blogs/websites/forums that cover the same topics?
Appreciate it!
Parbriz ALFA ROMEO SPIDER,
Its like you learn my mind! You appear to understand
so much about this, like you wrote the guide in it or
something. I think that you could do with a few
p.c. to pressure the message home a bit, however other than that, this is magnificent blog.
A fantastic read. I’ll definitely be back.
Kinox
Enjoyed every bit of your blog.Really looking forward to read more. Want more.
cbd for anxiety
This is a topic that is close to my heart… Best wishes! Exactly where can I find the contact details for questions?
Michaelvar
http://anafranil.us.com
Parbriz BMW i8,
Today, while I was at work, my sister stole my iphone
and tested to see if it can survive a 30 foot drop, just
so she can be a youtube sensation. My apple ipad is now broken and she has 83 views.
I know this is completely off topic but I had to share it with someone!
365 kiu kiu
Appreciate the recommendation. Will try it out.
静岡県のビジネスフラワー※突っ込んで知りたい
静岡県のビジネスフラワーの真っすぐのところは?引合すします。静岡県のビジネスフラワーの労働者が教えるワザ。色々あまりのと思います。
Mortgage Broker Calgary
certainlу like уoᥙr website bbut уou haνe to takе a look att the
spelling ⲟn several of your posts. Տeveral oof tһem ɑre rife with spelling proƄlems аnd I
in finding itt vеry troublesome tߋ inform thee reality һowever I will defіnitely ckme agaіn agаin.
Charlesfug
http://buyvermox.us.org
best cbd for sleep
Howdy! This article could not be written much better! Looking through this article reminds me of my previous roommate! He constantly kept preaching about this. I am going to forward this post to him. Pretty sure he will have a very good read. I appreciate you for sharing!
Chelsea
Why people still make use of to read news
papers when in this technological globe all is available on web?
Milan
Thanks for any other excellent post. The place else could anyone get that type of information in such a perfect method of writing?
I have a presentation subsequent week, and I’m at the look for such info.
Charlesfug
hydrochlorothiazide difference to lasix
find more info
Appreciate you sharing, great blog article.Really thank you! Want more.
เช่าโต๊ะ เก้าอี้ โคราช
Hello. excellent job. I did not anticipate this. This is a excellent story. Thanks!
เช่า เต็นท์ ผ้าใบ ปทุมธานี
Great blog you have here but I was wanting to know if you knew of any forums that cover the same topics discussed in this article? I’d really love to be a part of online community where I can get responses from other knowledgeable individuals that share the same interest. If you have any recommendations, please let me know. Thank you!
quest bars cheap
WOW just what I was looking for. Came here by searching for quest bars
cheap
Michaelvar
lisinopril
online blackjack australia
us accepted player casino
online casino mastercard deposit
bingo bonus on slots
Jani
Hey there would you mind sharing which blog platform you’re using?
I’m planning to start my own blog in the near future but I’m
having a tough time deciding between BlogEngine/Wordpress/B2evolution and Drupal.
The reason I ask is because your design and style seems different then most blogs and
I’m looking for something unique.
P.S Apologies for getting off-topic but I had to ask!
Charlesfug
generic clozaril
hack
famoid buy instagram followers and hacklink.
Minnesota
I’m now not positive where you are getting your information, but great topic.
I must spend a while learning much more or figuring
out more. Thank you for excellent information I used to be
searching for this information for my mission.
orospu
Fantastic blog article.Really thank you! Really Cool.
Charlesfug
buy torsemide
Charlesfug
sildenafil buy
Charlesfug
cheap acyclovir
Michaelvar
buy valtrex
Maryland furniture assembly
Hello there, just was aware of your weblog via Google, and found that it’s really informative. I’m going to be careful for brussels. I will be grateful if you happen to proceed this in future. Lots of folks will be benefited out of your writing. Cheers!
Baltimore furniture installers
As soon as I discovered this website I went on reddit to share some of the love with them.
best work from home jobs
Hello i am kavin, its my first time to commenting anyplace, when i read this piece of writing i thought
i could also make comment due to this brilliant article.
Mother Porn
Hey! I know this is somewhat off topic but I was wondering if you knew where I could
locate a captcha plugin for my comment form? I’m using the same blog platform as yours and
I’m having difficulty finding one? Thanks a lot!
سایت بازی انفجار معتبر
I seriously love your site.. Pleasant colors & theme. Did you develop this web site yourself?
Please reply back as I’m attempting to create my very own website and want
to find out where you got this from or what the theme is called.
Thank you!
سایت بازی انفجار معتبر
WOW just what I was searching for. Came here by searching for بازی انفجار
famoid hacklink
famoid viagra hacklink buy instagram.
mumbai chart
Hi there! This is kind of off topic but I need some help from an established blog.
Is it tough to set up your own blog? I’m not very techincal but I can figure things
out pretty quick. I’m thinking about setting up my own but I’m not sure where to begin. Do you
have any ideas or suggestions? Appreciate it
matka chart
Very nice article. I certainly appreciate this
website. Keep writing!
Stewartniz
buy amoxicillin
MILF Porn
Thanks to my father who informed me concerning this website, this web site is genuinely remarkable.
Click Here
Very good blog article.Thanks Again. Awesome.
Son and mother porn
I will right away clutch your rss as I can’t find your e-mail subscription link or e-newsletter service.
Do you have any? Kindly let me recognize in order that I may just subscribe.
Thanks.
Rayman Legend
This is a topic that’s close to my heart… Thank you!
Exactly where are your contact details though?
MILF Porn
Hey! Would you mind if I share your blog with
my myspace group? There’s a lot of folks that I think would
really appreciate your content. Please let me know.
Many thanks
Agen Judi Maxbet
Thanks for your marvelous posting! I definitely enjoyed reading it, you will be a great author.
I will be sure to bookmark your blog and may come back in the foreseeable future.
I want to encourage you to continue your great job,
have a nice day!
Www.Cafeaverde.Greencoffee.Ro
Great post. I was checking constantly this blog and I’m impressed!
Extremely helpful info specially the last part 🙂 I care for such info much.
I was looking for this particular information for a long time.
Thank you and best of luck.
Free Robux Generator
Great article.
hitmusicstation.net
WOW just ѡhat I was looking fⲟr. Came һere by searching fоr mortgage rates
porumba
A round of applause for your article.Much thanks again. Will read on…
4f-adb
Great, thanks for sharing this post.Really thank you! Great.
quest bars cheap coupon twitter
Incredible points. Great arguments. Keep up the great effort.
i99bet
Great post. I’m going through many of these issues as well..
doorwin windows and doors
I was looking through some of your blog posts on this site and I conceive this website is real informative! Continue posting.
ราคาบอลไหล
I’m not sure why but this blog is loading incredibly slow for me. Is anyone else having this problem or is it a issue on my end? I’ll check back later and see if the problem still exists.
Charlesfug
buy tetracycline 500 mg
psicoterapeuti italiani a Londra
I am continually looking online for articles that can aid me. Thanks!
cashmere scarf
Thank you for this article. I would also like to talk about the fact that it can often be hard while you are in school and merely starting out to establish a long credit score. There are many learners who are simply just trying to live and have long or beneficial credit history can sometimes be a difficult element to have.
buy instagram followers
famoid viagra hacklink buy instagram.
Nursing Essays
Terrific work! This is the kind of info that are meant to be shared
across the internet. Disgrace on the search engines
for not positioning this submit higher! Come on over
and seek advice from my website . Thanks =)
Research Paper Writing
An outstanding share! I’ve just forwarded this onto a coworker who has been doing a little
homework on this. And he actually bought me breakfast due to the fact that I discovered it for him…
lol. So let me reword this…. Thanks for the meal!!
But yeah, thanks for spending some time to talk about this subject here
on your internet site.
adult bouncy castle hire
Thanks a lot for the blog article.Much thanks again. Fantastic.
bondage sex
I loved your blog.Really thank you! Fantastic.
mujer
Incredible quest there. What occurred after?
Take care!
http://instaladordepisos.com.br/?option=com_k2&view=itemlist&task=user&id=27654
Greetings from California! I’m bored to death at work so I decided to check out your blog on my iphone during lunch break.
I enjoy the info you present here and can’t
wait to take a look when I get home. I’m amazed at how
quick your blog loaded on my mobile .. I’m not even using WIFI, just 3G ..
Anyways, excellent blog!
Best CBD Oil
Genuinely when someone doesn’t be aware of afterward its
up to other viewers that they will help, so here it takes place.
CBD Oil
Hello There. I found your blog using msn. This is a very
well written article. I will be sure to bookmark it and come back
to read more of your useful information. Thanks for the post.
I’ll certainly return.
http://baraita.net/green-coffee-5000mg/
Wow because this is excellent work! Congrats and keep
it up. http://baraita.net/green-coffee-5000mg/
http://tw.junpus.com/?option=com_k2&view=itemlist&task=user&id=4426
After checking out a number of the blog articles on your web site, I truly like your technique of writing a blog.
I saved as a favorite it to my bookmark site list and will be checking
back in the near future. Take a look at my web site as well
and let me know your opinion.
http://63.250.38.86/
I’m not sure where you are getting your info, but good topic.
I needs to spend some time learning more or understanding more.
Thanks for wonderful information I was looking for this information for my mission.
Dissertation and Thesis writing
I all the time used to read post in news papers but now as I am a user of internet
so from now I am using net for posts, thanks to web.
pokerqq
Thank you for any other informative site. Where else may just I
get that type of info written in such an ideal manner? I
have a challenge that I’m just now running on, and I’ve been on the glance out for such information.
copy and paste ads for money
Hi this is kinda of off topic but I was wanting to know if blogs
use WYSIWYG editors or if you have to manually code with HTML.
I’m starting a blog soon but have no coding knowledge so I wanted to get guidance from someone with
experience. Any help would be enormously appreciated!
desaparecidos
Hello! I know this is kinda off topic however , I’d figured I’d ask.
Would you be interested in exchanging links or maybe guest authoring
a blog post or vice-versa? My website covers a lot of the same subjects as yours and I
believe we could greatly benefit from each other.
If you’re interested feel free to shoot me an e-mail.
I look forward to hearing from you! Wonderful blog by the way!
http://sdsn.develop.cinfores.com/index.php/component/k2/itemlist/user/2079654
Hello I am so grateful I found your site, I really found you
by error, while I was researching on Digg for something else, Anyways I am here now and would
just like to say cheers for a fantastic post and a all round entertaining
blog (I also love the theme/design), I don’t have time to browse it all at the
minute but I have saved it and also added your RSS feeds, so
when I have time I will be back to read a lot
more, Please do keep up the fantastic job.
Best CBD Oil
Its like you read my thoughts! You appear to understand a lot about this, such as you wrote the guide in it or something.
I feel that you just could do with some % to pressure
the message house a little bit, but instead of that, this
is fantastic blog. A fantastic read. I will definitely be back.
CBD Oil for pain
Someone essentially assist to make significantly articles I’d state.
This is the very first time I frequented your web page and to this point?
I surprised with the research you made to make this particular put up incredible.
Wonderful process!
web site
glu glu bam bam
go to this site
Your writing taste has been surprised me. Thank you, quite nice post.
discount code
I appreciate you sharing this post. Great.
i99bet
Greetings! Very helpful advice in this particular article! It is the little changes that produce the biggest changes. Thanks a lot for sharing!
DMV furniture assembly
I do agree with all of the ideas you’ve presented in your post. They are really convincing and will certainly work. Still, the posts are too short for newbies. Could you please extend them a little from next time? Thanks for the post.
Charlesfug
http://www.cialisd9z.com
Porn in Malaysia
I blog frequently and I seriously appreciate your
information. This article has really peaked my
interest. I will take a note of your website and keep checking for new information about once
per week. I subscribed to your Feed too.
Charlesfug
buy metformin
Roadies Audition 2020
It’s awesome in favor of me to have a web site, which is
useful in favor of my knowledge. thanks admin
Roadies Audition 2019
You are so interesting! I don’t suppose I’ve read through something like this before.
So good to find somebody with genuine thoughts
on this subject. Really.. thanks for starting this up.
This web site is one thing that is needed on the web,
someone with a little originality!
parbrize ieftine
Appreciate the recommendation. Let me try it out.
佐賀県のビジネスフラワーを解説
佐賀県のビジネスフラワーの後列を言まえします。果たしてです。佐賀県のビジネスフラワーを理屈で言いきかすします。年譜を覚え書。
quest bars cheap
Hello, i think that i saw you visited my site thus i
came to “return the favor”.I’m trying to find things
to enhance my web site!I suppose its ok to use
some of your ideas!!
quest bars cheap
I’m really loving the theme/design of your site.
Do you ever run into any internet browser compatibility problems?
A couple of my blog visitors have complained about my site not working correctly in Explorer but looks great
in Chrome. Do you have any recommendations to help fix this issue?
Michaelvar
cheap tetracycline
quest bars cheap
you are in point of fact a excellent webmaster. The website
loading pace is amazing. It kind of feels that you’re doing any distinctive trick.
In addition, The contents are masterpiece. you have performed a excellent job on this subject!
Michaelvar
buy viagra online
DMV furniture assembly
I have been exploring for a little bit for any high quality articles or blog posts in this kind of space . Exploring in Yahoo I ultimately stumbled upon this website. Studying this info So i’m glad to convey that I have a very just right uncanny feeling I found out exactly what I needed. I such a lot indubitably will make certain to don’t disregard this web site and give it a glance on a relentless basis.
quest bars cheap
It’s great that you are getting ideas from this piece of
writing as well as from our dialogue made here.
BennyLOORA
tadalafil buy
phone headphones
Very informative article.Thanks Again. Great.
i99bet
Howdy, i read your blog from time to time and i own a similar one and i was just wondering if you get a lot of spam feedback? If so how do you reduce it, any plugin or anything you can advise? I get so much lately it’s driving me crazy so any help is very much appreciated.
i99bet
Thanks for revealing your ideas right here. The other matter is that if a problem takes place with a computer motherboard, folks should not consider the risk involving repairing that themselves because if it is not done right it can lead to irreparable damage to the complete laptop. It is almost always safe to approach a dealer of that laptop for that repair of motherboard. They’ve got technicians who’ve an skills in dealing with mobile computer motherboard difficulties and can have the right diagnosis and conduct repairs.
Charlesfug
doe cipla in india manufacture kamagra
buy vyvanse
Howdy! This is my first visit to your blog! We are a team of
volunteers and starting a new project in a community in the same niche.
Your blog provided us useful information to work on. You have
done a wonderful job!
ソフトヤミ金
Simply desire to say your article is as amazing.
The clarity in your post is simply excellent and i could assume
you are an expert on this subject. Well with your permission let me to grab your RSS
feed to keep up to date with forthcoming post. Thanks a million and please carry on the enjoyable work.
hdss
Film streaming gratuit HD/4K en VF HDss, Film en streaming,
Regarder meilleurs Films sur hdss.to GRATUIT.
Best CBD Oil
What’s up, I want to subscribe for this webpage to obtain latest updates, therefore where can i do it please help.
CBD Oil
I was excited to discover this website. I wanted to thank you for your time for this
particularly fantastic read!! I definitely loved every little bit of
it and i also have you saved as a favorite to see new stuff
on your website.
CBD Oil for anxiety
great points altogether, you just gained a brand new reader.
What may you recommend about your publish that you just made some days ago?
Any certain?
ソフトヤミ金
A person necessarily lend a hand to make critically posts I would state.
That is the first time I frequented your web page and to this point?
I surprised with the analysis you made to create
this actual put up amazing. Excellent task!
CBD Oil
I visited many blogs however the audio feature for audio songs current
at this website is in fact superb.
Charlesfug
cialis
Parbriz Auto La Domiciliu
With havin so much written content do you ever run into any problems of
plagorism or copyright infringement? My site has a lot of
completely unique content I’ve either written myself or outsourced but it seems a lot of it is popping it up all over the internet without my authorization. Do you know any ways to help protect against content from being ripped off?
I’d genuinely appreciate it.
http://georiskafric.org/index.php/component/k2/itemlist/user/177457
Hi there, I found your website by the use of Google at the same time as searching for a
comparable subject, your site got here up,
it appears to be like good. I have bookmarked it
in my google bookmarks.
Hello there, just turned into aware of your
blog thru Google, and found that it is really informative.
I am going to watch out for brussels. I will appreciate if you continue this in future.
Many other folks will probably be benefited out of your writing.
Cheers!
Charlesfug
cheap prednisolone
Best CBD Oil
Quality posts is the secret to attract the users to go to see the site, that’s
what this web site is providing.
Stewartniz
super kamagra buy
KennethGaf
albuterol
Michaelvar
cheap cialis
ps4 games
Wonderful article! That is the kind of info that are meant to be shared across the net.
Disgrace on the search engines for no longer positioning
this put up upper! Come on over and seek advice from my site .
Thank you =)
Juliana
Thanks for sharing your info. I really appreciate your efforts and I am waiting for your further write ups thanks once
again.
Charlesfug
correlation between appendicitis and synthroid
endoderm slobbery
I was pretty pleased to uncover this page.
I want to to thank you for your time for this particularly wonderful read!!
I definitely appreciated every bit of it
and I have you saved as a favorite to look at new stuff on your website.
Charlesfug
buy wellbutrin
먹튀검증업체
fantastic issues altogether, you simply gained a new reader. What could you recommend in regards to your submit that you just made some days in the past? Any sure?
Divan Beds Cheadle Hulme
I will right away grasp your rss as I can not to find your e-mail subscription link or e-newsletter
service. Do you’ve any? Kindly let me recognise in order that I may subscribe.
Thanks.
CBD Oil for insomnia
Hello great blog! Does running a blog similar to this require
a large amount of work? I’ve absolutely no knowledge of coding however I was hoping to start my own blog soon. Anyhow, if you have
any recommendations or tips for new blog owners please share.
I know this is off topic however I simply had to ask.
Thank you!
Locksmiths Barlow Moor
Hi, always i used to check web site posts here in the early hours in the break of day, because i love to find out more and more.
useful source
I truly appreciate this article post.Thanks Again. Great.
Dave Song
It’s the best time to make some plans for the future and it is time to be happy. I’ve read this post and if I could I want to suggest you few interesting things or tips. Perhaps you can write next articles referring to this article. I desire to read more things about it!
defect reports
Howdy very cool website!! Guy .. Beautiful .. Wonderful .. I will bookmark your web site and take the feeds also?
I’m glad to seek out a lot of useful information right here in the publish, we’d
like develop extra strategies in this regard, thank you
for sharing. . . . . .
Bellaire
Very great post. I simply stumbled upon your weblog and wanted to mention that I’ve truly loved surfing around your blog posts. After all I’ll be subscribing to your rss feed and I hope you write once more very soon!
你想看看颶風嗎?
Thanks again for the post.Much thanks again. Will read on…
CBD Oil
Hello there! I know this is kinda off topic nevertheless I’d figured I’d ask.
Would you be interested in exchanging links or maybe
guest writing a blog post or vice-versa? My site addresses a lot of
the same topics as yours and I think we could greatly benefit from
each other. If you happen to be interested feel free to shoot me an email.
I look forward to hearing from you! Wonderful blog by the way!
CBD Oil
Awesome! Its really awesome article, I have got much clear
idea concerning from this article.
animal porn
It’s an awesome post in support of all the internet viewers; they will obtain benefit from it I am sure.
CBD Oil
obviously like your website but you have to test
the spelling on several of your posts. Many of them are rife with spelling issues and I
to find it very bothersome to tell the reality however I’ll definitely come back again.
Best CBD Oil
Hmm is anyone else experiencing problems with the pictures on this blog loading?
I’m trying to determine if its a problem on my
end or if it’s the blog. Any suggestions would
be greatly appreciated.
Locksmiths Mottram
I have been surfing online more than 3 hours today, yet I never found any interesting article like yours.
It’s pretty worth enough for me. Personally, if all site owners and bloggers made good content as you did,
the net will be a lot more useful than ever before.
John Deere Repair Manuals
It??s good site, I became seeking a product like this
Brenda
Từ lúc sử dụng dịch vụ bên LADIGI Agency mình thấy dịch vụ SEO và duy trì Digital Marketing
sau đó khá tốt. Chúc công ty ngày càng phát triển trong tương lai nhé!
Trải nghiệm Dịch vụ SEO tại LADIGI Agency khá tuyệt vời.
Thái độ của nhân viên rất tốt. Chọn LADIGI
Agency là quyết định đúng đắn nhất từ trước đến nay
của tôi khi làm Digital Marketing. Bạn La Trọng Nhơn vừa là người
tài giỏi và có đam mê ai cũng biết, nhưng chưa thấy ai vừa tốt
vừa dễ thương vậy luôn. #ladigi #ladigivn
test management tools
Hello there, You’ve done an incredible job. I will definitely digg it and personally recommend to my friends.
I’m sure they’ll be benefited from this site.
Charlesfug
generic cialis
Best CBD Oil
Good write-up. I absolutely love this site. Keep it up!
Locksmiths Bowdon
Hello i am kavin, its my first time to commenting anyplace, when i read
this piece of writing i thought i could also make
comment due to this brilliant paragraph.
prink malaga
Good day! Do you use Twitter? I’d like to follow you if
that would be okay. I’m absolutely enjoying your blog and look
forward to new posts.
post office near me
Thanks for sharing, this is a fantastic article post.
www.storeholidayhours.org
Appreciate you sharing, great post.Really looking forward to read more. Cool.
togel online
I have been surfing on-line more than three hours today, yet I by no means found any attention-grabbing article like yours. It’s lovely worth enough for me. Personally, if all webmasters and bloggers made excellent content material as you did, the net can be a lot more helpful than ever before. “Now I see the secret of the making of the best persons.” by Walt Whitman.
CBD Oil for pain
I don’t even know the way I stopped up right here, however
I assumed this publish was great. I do not recognise who you are however definitely you are going
to a well-known blogger when you aren’t already. Cheers!
betgratis
great points altogether, you simply received a new reader.
What would you suggest in regards to your put up that you made a
few days in the past? Any positive?
CBD Oil
This is my first time go to see at here and i am in fact impressed to read everthing at one place.
Charlesfug
buy valtrex
Free Porn Videos -JavMama
With havin so much content and articles do you ever run into any
issues of plagorism or copyright violation? My blog has a lot of exclusive
content I’ve either written myself or outsourced but it appears
a lot of it is popping it up all over the internet without my agreement.
Do you know any solutions to help stop content from being stolen?
I’d certainly appreciate it.
Connor
Superb blog you have here but I was curious about if you knew of any discussion boards that cover the same topics talked about in this article?
I’d really like to be a part of online community where I can get feedback from other experienced individuals that share the same interest.
If you have any suggestions, please let me know. Bless you!
glacis feria
What’s up Dear, are you in fact visiting this web site on a regular basis, if so
afterward you will absolutely obtain good know-how.
Michaelvar
sildenafil
restaurant menus
wow, awesome blog.Much thanks again. Awesome.
walmartone login
This is one awesome article.Thanks Again. Great.
udaipur call girls
I really like your blog.. very nice colors & theme. Did you make this website yourself or did you hire someone to do it for you? Plz answer back as I’m looking to design my own blog and would like to know where u got this from. thank you
Logo Designer
Good write-up, I am regular visitor of one’s website, maintain up the excellent operate, and It is going to be a regular visitor for a long time.
สูตร ตู้ม้าออนไลน์
Regards for helping out, great info .
Charlesfug
buy cialis
Free Robux Generator
I have read so many articles regarding the blogger lovers but this article is genuinely a pleasant
piece of writing, keep it up.
monolith finite
My programmer is trying to persuade me to move
to .net from PHP. I have always disliked the idea because of the
expenses. But he’s tryiong none the less. I’ve been using Movable-type on a number of websites for about a year and am nervous about
switching to another platform. I have heard good
things about blogengine.net. Is there a way I can transfer all my wordpress posts into it?
Any kind of help would be greatly appreciated!
school mascot costumes
Hi there, I log on to your new stuff regularly. Your story-telling style is witty,
keep it up!
Vacation Rentals in Santa Cruz CA
It’s actually very complex in this active life to
listen news on Television, thus I simply use world
wide web for that reason, and take the most recent news.
ps4 games
Nice blog right here! Also your site so much up very fast!
What host are you using? Can I am getting your affiliate link in your host?
I want my site loaded up as fast as yours lol
school mascot costumes
I like the valuable information you provide in your articles.
I will bookmark your weblog and check again here frequently.
I’m quite sure I’ll learn many new stuff right here!
Best of luck for the next!
Santa Cruz Gardening Services
Saved as a favorite, I like your site!
CBD Oil for pain
Excellent weblog right here! Also your site
lots up very fast! What host are you using? Can I am getting your affiliate hyperlink on your host?
I wish my website loaded up as quickly as yours
lol
assemblers incorporated
Great post right here. One thing I’d like to say is that often most professional job areas consider the Bachelor Degree as the entry level standard for an online diploma. While Associate Qualifications are a great way to begin, completing a person’s Bachelors presents you with many entrances to various jobs, there are numerous internet Bachelor Course Programs available coming from institutions like The University of Phoenix, Intercontinental University Online and Kaplan. Another thing is that many brick and mortar institutions provide Online editions of their qualifications but usually for a extensively higher charge than the organizations that specialize in online college diploma plans.
USA research chemical supplier
A round of applause for your article.Really thank you! Really Great.
skodeng tumblr
Looking forward to reading more. Great article post.Really thank you! Great.
Beach House Rentals in Santa Cruz
Undeniably consider that which you stated. Your favorite reason seemed to be
at the net the simplest factor to have in mind of. I say
to you, I certainly get irked even as other people consider
worries that they plainly do not know about.
You controlled to hit the nail upon the top as neatly as outlined out the
entire thing without having side-effects , other people can take a signal.
Will probably be back to get more. Thank you
CBD Oil
WOW just what I was looking for. Came here by searching for CBD Oil
Santa Cruz Vacation Rentals
Great article.
CBD Oil
Do you have any video of that? I’d love to find out some additional information.
web site
web site all the best one.
Santa Cruz Landscaping Services
Heya! I’m at work surfing around your blog from my new iphone
4! Just wanted to say I love reading through your blog and look forward to all your posts!
Keep up the excellent work!
indian xxx video daunlod
Very informative blog post. Really Cool.
www.reportehosting.com
Appreciate you sharing, great blog article.Much thanks again. Want more.
Vacation Rentals in Santa Cruz CA
Hello! Would you mind if I share your blog with my myspace group?
There’s a lot of folks that I think would really enjoy your
content. Please let me know. Thank you
Best CBD Oil
I’m gone to say to my little brother, that he should also pay a visit this webpage on regular basis to take updated from latest
gossip.
CBD Oil for insomnia
I am really loving the theme/design of your site. Do you ever run into any web browser compatibility problems?
A handful of my blog readers have complained
about my blog not working correctly in Explorer but looks great in Safari.
Do you have any suggestions to help fix this issue?
Santa Cruz County Landscaping
An impressive share! I have just forwarded this onto a co-worker who has been doing a little homework on this.
And he actually ordered me breakfast due to the fact that I stumbled upon it for him…
lol. So let me reword this…. Thanks for the meal!! But yeah, thanks for spending some
time to talk about this subject here on your site.
CBD Oil for insomnia
You really make it seem so easy with your presentation but I find this topic to
be actually something which I think I would never understand.
It seems too complicated and very broad for me.
I am looking forward for your next post, I’ll try to get the hang of
it!
buy instagram likes
buy instagram likes and comment.
ps4 games
I think this is among the most significant information for me.
And i’m satisfied reading your article. However want to remark on some basic things, The web site style
is wonderful, the articles is in point of fact nice : D.
Good job, cheers
Charlesfug
generic sildenafil
escort
Say, you got a nice article post.Much thanks again. Really Great.
Stewartniz
price of ventolin hfa inhaler
Charlesfug
buy acyclovir
https://www.nithiyamotors.com/
Looking forward to reading more. Great article post.
Free Fortnite Skins Generator
Useful information. Fortunate me I discovered your site by chance, and I am stunned why this accident didn’t took place in advance!
I bookmarked it.
Claudette
Thanks for the auspicious writeup. It in truth was a enjoyment
account it. Glance complicated to far added agreeable from you!
However, how can we be in contact?
ps4 games
Hey there would you mind sharing which blog platform you’re
working with? I’m going to start my own blog in the near future
but I’m having a tough time choosing between BlogEngine/Wordpress/B2evolution and Drupal.
The reason I ask is because your design seems different then most blogs and I’m looking for something completely
unique. P.S Sorry for being
off-topic but I had to ask!
Brettthesk
prednisone generic
Charlesfug
ventolin online
Charlesfug
buy amoxicillin
Best CBD Oil
great publish, very informative. I’m wondering why the other experts of this sector do not realize
this. You must continue your writing. I’m sure, you’ve a great readers’ base already!
bändi pikkujouluihin
Hi there! Someone in my Myspace group shared this site with us so I came to give it
a look. I’m definitely enjoying the information. I’m bookmarking and will be tweeting this to my followers!
Fantastic blog and outstanding design.
CBD Oil
No matter if some one searches for his necessary thing, so he/she needs to be
available that in detail, therefore that thing is maintained over here.
Elvia
continuously i used to read smaller posts that
as well clear their motive, and that is also happening with
this article which I am reading now.
allconsultingsenegal.com
Hiya very nice blog!! Man .. Excellent .. Superb
.. I’ll bookmark your site and take the feeds also?
I’m satisfied to search out numerous helpful information here in the put
up, we want work out more techniques on this regard,
thank you for sharing. . . . . .
Best CBD Oil
Amazing! Its in fact awesome article, I have got much clear idea regarding from
this article.
quest bars cheap
I blog frequently and I really thank you for your content. This great
article has really peaked my interest. I’m going to bookmark your website and keep
checking for new information about once a week.
I opted in for your RSS feed too.
Best CBD Oil
Wow! In the end I got a website from where I can actually obtain helpful facts concerning my study and knowledge.
Chelsea
Link exchange is nothing else but it is simply placing the
other person’s website link on your page at appropriate place and other person will also do similar in support of
you.
allconsultingsenegal.com
It’s the best time to make some plans for the future and it’s time to be happy.
I’ve read this post and if I could I wish to suggest you few interesting things
or suggestions. Maybe you could write next articles referring to this article.
I desire to read more things about it!
Catharine
Hello to every one, it’s truly a good for me to pay a quick visit this
web site, it contains priceless Information.
Selma
We are a bunch of volunteers and starting a brand
new scheme in our community. Your site provided us with useful info
to work on. You’ve done a formidable job and our entire group can be
grateful to you.
Charlesfug
lisinopril generic
Michaelvar
buy tetracycline
CBD Oil
I really like your blog.. very nice colors & theme. Did you design this website yourself or did you
hire someone to do it for you? Plz answer back as I’m looking to create my own blog and would like to find out where
u got this from. thanks
KennethGaf
cheap wellbutrin
UFABET
Hi, I do think this is an excellent blog. I stumbledupon it 😉 I may come back once again since I book marked it. Money and freedom is the greatest way to change, may you be rich and continue to help others.
metro installation
Do you mind if I quote a few of your posts as long as I provide credit and sources back to your webpage? My blog site is in the very same niche as yours and my visitors would genuinely benefit from a lot of the information you provide here. Please let me know if this alright with you. Thanks!
ultimate installation
I’ll right away grab your rss feed as I can’t find your email subscription link or e-newsletter service. Do you’ve any? Please let me know in order that I could subscribe. Thanks.
reduceritv4k.Freshsoftware.info
Spot on with this write-up, I actually believe this website needs far more attention. I’ll probably be returning to read more, thanks for the info!
Julio
I was wondering if you ever considered changing the layout of your
website? Its very well written; I love what youve got to say.
But maybe you could a little more in the way of content so
people could connect with it better. Youve got an awful lot of
text for only having 1 or 2 images. Maybe you could space it out better?
tv4Kieftin.freshsoftware.info
I couldn’t resist commenting. Exceptionally well written!
Www.toptv4k.Freshsoftware.info
I really like your blog.. very nice colors & theme.
Did you create this website yourself or did you hire someone to do it for you?
Plz reply as I’m looking to design my own blog and would like
to find out where u got this from. many thanks
Sang
Asking questions are really pleasant thing if you are
not understanding something completely, but this paragraph presents good understanding even.
Http://Televizoare4K.freshsoftware.Info
It’s awesome in favor of me to have a web page, which is helpful in support
of my knowledge. thanks admin
Charlesfug
cheap sildenafil
CBD Oil for pain
You could definitely see your skills within the
article you write. The arena hopes for more passionate writers like
you who are not afraid to say how they believe.
At all times follow your heart.
CBD Oil for insomnia
I all the time emailed this web site post page to all my friends, for the reason that if like
to read it after that my friends will too.
CBD Oil for anxiety
Thank you for every other fantastic article. Where else
may anyone get that kind of info in such an ideal manner of writing?
I’ve a presentation subsequent week, and I am on the look for such info.
Situs Agen Taruhan Judi Bola Online Terpercaya
If some one wants to be updated with most recent technologies therefore he must
be pay a quick visit this web site and be up to date all the
time.
CBD Oil for insomnia
I like the helpful info you provide in your articles.
I’ll bookmark your blog and check again here frequently.
I am quite certain I will learn lots of new stuff right here!
Good luck for the next!
waist training
Hey there, I think your site might be having browser compatibility issues.
When I look at your blog site in Opera, it looks fine but when opening in Internet Explorer, it has some overlapping.
I just wanted to give you a quick heads up! Other then that,
fantastic blog!
CBD Oil for pain
It’s awesome designed for me to have a web site, which is valuable designed for my know-how.
thanks admin
Michaelvar
cheap prozac
best waist trainer
Hi are using WordPress for your blog platform?
I’m new to the blog world but I’m trying to get started and create my own. Do you need any html
coding knowledge to make your own blog? Any help would be
greatly appreciated!
Charlesfug
robaxin generic
Michaelvar
levitra generic
Furniture installers
Just wish to say your article is as surprising. The clearness in your post is just great and i could assume you’re an expert on this subject. Well with your permission let me to grab your feed to keep updated with forthcoming post. Thanks a million and please keep up the enjoyable work.
Furniture assembly handyman
F*ckin’ remarkable things here. I’m very happy to look your article. Thanks so much and i’m looking forward to contact you. Will you please drop me a mail?
best waist trainer
If some one wishes expert view about blogging and site-building then i suggest him/her to visit this weblog,
Keep up the pleasant job.
CBD Oil for insomnia
Quality articles or reviews is the secret to invite the users to go to see the web site, that’s
what this web page is providing.
Pub 71
Appreciate you sharing, great post.Really thank you! Much obliged.
Charlesfug
vardenafil
rdw
I was suggested this web site by means of my cousin. I’m no longer sure whether this put up is written by way of him as nobody else realize such targeted approximately my problem.
You are wonderful! Thanks!
women sex shop cyprus
Very nice article, totally what I was looking for.
sexshop cy
Very nice blog post. I certainly appreciate this site. Continue the good work!
6 figure partner program
I know this if off topic but I’m looking
into starting my own weblog and was curious what all is required to get set up?
I’m assuming having a blog like yours would cost a pretty
penny? I’m not very web smart so I’m not 100% sure.
Any suggestions or advice would be greatly appreciated.
Cheers
women sex shop cyprus
An impressive share! I’ve just forwarded this onto a coworker who has been doing a little homework on this.
And he actually ordered me breakfast because I discovered it for him…
lol. So let me reword this…. Thank YOU for the meal!!
But yeah, thanx for spending time to discuss this issue here on your internet
site.
making money with YouTube
Amazing things here. I am very glad to look your article.
Thanks a lot and I’m taking a look ahead to contact you. Will you
please drop me a e-mail?
i99BET
I could not resist commenting. Perfectly written!
vibrators sex shop cyprus
Hey there! Do you know if they make any plugins to assist with Search Engine Optimization?
I’m trying to get my blog to rank for some targeted keywords but I’m not seeing very good results.
If you know of any please share. Kudos!
qq slot Terbaru
Hello, I enjoy reading all of your post. I wanted to write a little comment to support you.
aventinesf.com
This is one awesome article.Much thanks again. Will read on…
sbobet
Does your website have a contact page? I’m having problems locating it but, I’d like to send you an e-mail. I’ve got some creative ideas for your blog you might be interested in hearing. Either way, great site and I look forward to seeing it expand over time.
i99BET
I really love your website.. Very nice colors & theme. Did you develop this amazing site yourself? Please reply back as I’m planning to create my own personal site and would love to find out where you got this from or exactly what the theme is called. Kudos.
Free Robux Generator
Hi I am so glad I found your blog page, I really found you by error, while I was browsing on Aol for something else, Anyhow I am here now and would just like to say cheers for a marvelous
post and a all round exciting blog (I also love the theme/design),
I don’t have time to look over it all at the moment but I have bookmarked it and also added your
RSS feeds, so when I have time I will be back to read a great deal more, Please do keep up the awesome b.
Charlesfug
http://www.sildenafil0l1.com
Free Robux
Wow, awesome blog layout! How long have you
been blogging for? you made blogging look easy.
The overall look of your web site is great, as well as the content!
another one
Hello There. I found your weblog the use of msn. This is a very neatly written article.
I will make sure to bookmark it and return to learn more
of your helpful info. Thank you for the post. I will certainly comeback.
quest bars cheap
Hi there! I just would like to offer you a big thumbs up for the excellent info you’ve got
right here on this post. I will be returning to your web
site for more soon.
Furniture assembly help
I truly appreciate this post. I have been looking everywhere for this! Thank goodness I found it on Bing. You’ve made my day! Thank you again!
Pool table assembly service
I have been absent for some time, but now I remember why I used to love this web site. Thank you, I’ll try and check back more frequently. How frequently you update your web site?
web site
microsoft web site good this one best.
Stewartniz
does synthroid effect bone density
Charlesfug
prednisolone online
nonpneumatic
Hello, I think your website might be having browser compatibility issues.
When I look at your blog site in Ie, it looks fine but when opening in Internet
Explorer, it has some overlapping. I just wanted to give you a
quick heads up! Other then that, amazing blog!
buy hacklink famoid
famoid buy viagra and hackllink services.
Charlesfug
http://ventolin0l1.com
avcilar gunluk daire
Sweet blog! I found it while searching on Yahoo News. Do you have any suggestions
on how to get listed in Yahoo News? I’ve been trying for a while
but I never seem to get there! Many thanks
milf story
Hey there! I know this is kinda off topic but I was wondering if you knew where I could locate a captcha plugin for my comment form?
I’m using the same blog platform as yours and I’m having difficulty finding one?
Thanks a lot!
crypto currency
An intriguing discussion is worth comment. I believe that you
ought to publish more on this issue, it might not be a taboo matter but usually people do not talk about such subjects.
To the next! Best wishes!!
Airport Parking Luton
I’m still learning from you, while I’m trying to achieve my goals. I definitely enjoy reading everything that is posted on your blog.Keep the posts coming. I loved it!
lottovip
It is appropriate time to make some plans for the future and
it’s time to be happy. I’ve read this post and if I could I wish to
suggest you few interesting things or suggestions.
Perhaps you could write next articles referring to this article.
I desire to read more things about it!
bushurov
Hello there! I simply wish to give you a big thumbs up for your excellent info you’ve got here
on this post. I am returning to your web site for more soon.
Charlesfug
levitra 500 mg
คาสิโนออนไลน์
This is the right webpage for anyone who wants to
find out about this topic. You realize so much its almost hard to argue with you (not that I actually will need to…HaHa).
You definitely put a fresh spin on a topic that’s been discussed for years.
Wonderful stuff, just wonderful!
quest bars cheap
Wonderful article! That is the type of information that should be
shared across the internet. Disgrace on Google for now not positioning
this publish higher! Come on over and consult with my site .
Thanks =)
dresser assembly service
Hello. fantastic job. I did not anticipate this. This is a splendid story. Thanks!
Desk assembly service
Many thanks for this article. I’d also like to state that it can often be hard if you find yourself in school and starting out to establish a long credit standing. There are many pupils who are simply just trying to live and have a long or favourable credit history are often a difficult point to have.
Compliance and Identity verification
Hello There. I found your blog using msn. This is a really well written article.
I’ll be sure to bookmark it and return to read more of your useful information. Thanks for the post.
I will certainly comeback.
Sugar CRM
Thanks in support of sharing such a nice thought, post is good,
thats why i have read it entirely
KennethGaf
buy wellbutrin
Suite CRM implementation and customization
I like it whenever people come together and share views.
Great website, stick with it!
cashmere wrap
Very well written story. It will be supportive to anyone who utilizes it, including yours truly :). Keep up the good work – looking forward to more posts.
Your Domain Name
I love your blog.. very nice colors & theme.
Did you design this website yourself or did you hire someone to do it
for you? Plz answer back as I’m looking to create my own blog and would like to know where
u got this from. thank you
pawnshopslouky.com
What a stuff of un-ambiguity and preserveness of precious know-how on the topic of unexpected feelings.
Book Printing
Hello, of course this paragraph is actually fastidious and I have learned lot of things from it on the topic of blogging.
thanks.
Demir Leather
Thank you for your blog. Really Great.
DỊCH TIẾNG HÀ LAN
You’ve made some decent points there. I checked on the
web to find out more about the issue and found most people will
go along with your views on this site.
uTorrent
uTorrent
TV stand assembly service
Definitely believe that that you stated. Your favorite justification seemed to be at the net the easiest thing to take into accout of. I say to you, I certainly get annoyed whilst folks think about concerns that they just don’t recognise about. You managed to hit the nail upon the highest and defined out the whole thing with no need side-effects , other people could take a signal. Will probably be back to get more. Thanks
Chinese MassageBeauty
With havin so much content and articles do you ever run into any problems of plagorism or copyright infringement? My website has a lot of exclusive content I’ve either written myself or outsourced but it looks like a lot of it is popping it up all over the web without my authorization. Do you know any techniques to help reduce content from being stolen? I’d certainly appreciate it.
UProxy
Hello to every body, it’s my first go to see of this weblog; this blog includes awesome and in fact good stuff in favor of readers.
Michaelvar
cheap prozac
Charlesfug
http://tetracycline0l1.com
rechargeable thrusting rabbit
Thanks-a-mundo for the blog.Much thanks again. Will read on…
Blouse
Hiya very nice site!! Man .. Beautiful .. Wonderful .. I will bookmark your web site and take the feeds additionally…I am glad to seek out a lot of helpful info here in the put up, we want develop extra techniques on this regard, thank you for sharing.
Soul of Healing Trust
Excellent beat ! I would like to apprentice whilst you
amend your website, how could i subscribe for a weblog website?
The account aided me a applicable deal. I have been a little bit familiar of
this your broadcast offered brilliant transparent idea
roblox music codes 2017
Today, while I was at work, my cousin stole my apple ipad and tested to see if it can survive a twenty five foot drop, just so she can be a youtube sensation. My apple ipad
is now destroyed and she has 83 views. I know this is totally off topic but I had to share
it with someone!
SEO
Thank you for the sensible critique. Me and my neighbor were just preparing to do a little research about this. We got a grab a book from our local library but I think I learned more clear from this post. I’m very glad to see such fantastic info being shared freely out there.
Gay Porn
I’m not sure exactly why but this blog is loading extremely slow for me. Is anyone else having this issue or is it a issue on my end? I’ll check back later and see if the problem still exists.
Charlesfug
how to use dsmo with viagra
Kickass Torrents
I enjoy, result in I found just what I was having a look for.
You have ended my four day long hunt! God Bless you man. Have a
nice day. Bye
Free Roblox Robux
I just like the helpful information you provide in your articles.
I’ll bookmark your weblog and take a look at once more right here regularly.
I’m fairly certain I’ll be informed many new stuff
proper here! Best of luck for the following!
Free Roblox Robux
I’m curious to find out what blog platform you happen to be working with?
I’m having some small security problems with
my latest blog and I’d like to find something more risk-free.
Do you have any recommendations?
http://certifiersbureau.com
Thanks-a-mundo for the article. Much obliged.
Free Roblox Robux
Good day! Do you know if they make any plugins to safeguard against hackers?
I’m kinda paranoid about losing everything I’ve worked hard on.
Any tips?
W88
What a data of un-ambiguity and preserveness of valuable know-how about unpredicted
emotions.
water dispenser
I’m not sure exactly why but this weblog is loading incredibly slow for me.
Is anyone else having this problem or is it a issue on my end?
I’ll check back later on and see if the problem still exists.
Charlesfug
buy acyclovir online
malatya seo
Merhaba saygı değer Malatya’lı hemşerilerim, Malatya SEO hizmeti olarak sizlere kısaca birkaç şey söylemek istiyorum.
11 yıldır aktif olarak SEO algoritma ve Google başda olmak üzere bir SEO hayatı serüvenim
bulunmaktadır. Kurumsal firmalar, mağazalar, dükkanlar,
ticari toptan alım satım kısacası iş yerleri olmak üzere başlıca
kişisel SEO işlerinizi halen aktif olarak yapmaktayım.
11 yıllık bu serüvenimde 7 yıldır profesyonel anlamda Seo Bayi yani Malatya SEO olarak
hizmet veriyorum. Günümüz internet çılgınlığı devam
eden bu süreç de herkesin cebinde olan telefonlar ile dünya parmaklarımızın ucunda olduğunu bütün insanlar
kabul görüyor. Google’ da hizmet verdiğiniz iş yeriniz ile alakalı SEO çalışmalarını gerçekleştirebilirim.
Lafı uzatmak istemiyorum, kısaca Google aramalarında istediğiniz aranan kelimeyi ilk sayfaya getiriyor ve sizin ticari gelirlerinizi bu
sayede arttırıyorum.
Örnek vericek olursak; Kayısı satan bir dükkanınız var;
” Arkadaş gün teknoloji devri bende
kullanmalıyım satışlarımı artırmalıyım.” diyorsanız Google aramalarında Malatya Kayısı, Malatya toptan kayısı kelimeleri yazıldığında sizin web sitenizi ilk
sayfalara getiriyor ve bu sayede herkes tarafından kolayca bulunup tanınıyorsunuz.
Genelleme olarak doğal gaz tamiratı, cafe,
asansör firmanız, evden eve nakliyat, rent a car, boya badana, halı yıkama, ürün satışı kısaca aklınıza gelicek herşeyi
Malatya SEO ile istenilen sonuçları elde edebilirsiniz.
Furniture assembly help
hello!,I really like your writing very so much! percentage we keep up a correspondence more about your post on AOL? I need an expert on this area to solve my problem. Maybe that is you! Having a look ahead to see you.
کاشت مو
Hi there, after reading this awesome paragraph i am as well cheerful to share my experience
here with colleagues.
sex
Not too tight but still good enough to stay on.
After finishing the last movie I took a cushion off the couch and I put it right next
to the wall and I got in position so I was supporting myself with
my shoulders and my heels on the wall so I was close to vertical with my penis pointed straight for my face.
Well I must say that it turned me on to know that I
wasn’t going to miss ejaculating on my face that it
only took like 30 seconds before I felt the imminent feeling.
With the cock ring firmly in place the first 8 shots jetted out all over place most of it landing near my eyes
and then It was followed up with about 6 more shots.
Oh man, I walked over to the bathroom mirror and looked at myself and
it looked all right. However, it was a mistake to open my eyes
with semen in them.
ps4 games
I like it when individuals come together and share opinions.
Great blog, stick with it!
pool table assembly
F*ckin’ amazing things here. I am very happy to see your post. Thanks a lot and i am taking a look ahead to contact you. Will you please drop me a mail?
funny things kids say compilation
hey there and thank you for your information –
I have definitely picked up something new from right here.
I did however expertise a few technical issues
using this web site, since I experienced to reload
the site a lot of times previous to I could get it to load properly.
I had been wondering if your hosting is OK?
Not that I’m complaining, but sluggish loading instances times will often affect
your placement in google and can damage your high quality score if ads and marketing with Adwords.
Anyway I’m adding this RSS to my e-mail and could look out for a lot
more of your respective exciting content. Make sure you update this
again very soon.
http://pillole-per-pene-it.eu/eroxel.html
Really wished to state I’m just lucky I came in your web page! http://pillole-per-pene-it.eu/eroxel.html
milf
Hello! Quick question that’s entirely off topic.
Do you know how to make your site mobile friendly?
My website looks weird when viewing from my iphone4. I’m trying to find a theme or plugin that might
be able to correct this problem. If you have any suggestions,
please share. Many thanks!
ขายชิปไพ่เท็กซัส ราคาถูก
I would like to thnkx for the efforts you’ve put in writing this blog. I am hoping the same high-grade web site post from you in the upcoming also. In fact your creative writing skills has encouraged me to get my own website now. Really the blogging is spreading its wings rapidly. Your write up is a good example of it.
Kathryn
Your method of telling all in this piece of writing is actually fastidious,
all be capable of effortlessly be aware of it, Thanks a lot.
Pool table assembly
I really appreciate this post. I have been looking everywhere for this! Thank goodness I found it on Bing. You have made my day! Thx again!
Bed assembly service
There is obviously a lot to know about this. I think you made some good points in features also.
essay writing
I was very pleased to find this website. I wanted to thank
you for your time for this fantastic read!! I definitely appreciated every part of it and
I have you saved as a favorite to check out new stuff in your blog.
highclasswriters
Appreciate this post. Will try it out.
Pressure Washers
Incredible story there. What occurred after? Take care!
bribe
Thanks so much for the blog.Really thank you! Really Cool.
รับจัดบุฟเฟ่ต์
You actually make it appear so easy along with your presentation however I in finding this
matter to be actually one thing that I feel I might by no means understand.
It seems too complicated and extremely wide for me.
I am having a look ahead for your next publish, I’ll
attempt to get the hang of it!
W88
you’re actually a good webmaster. The web site loading pace is incredible.
It kind of feels that you’re doing any unique trick.
Moreover, The contents are masterwork. you’ve performed a magnificent task on this topic!
รับจัดบุฟเฟ่ต์
My developer is trying to convince me to move to .net from PHP.
I have always disliked the idea because of the expenses. But
he’s tryiong none the less. I’ve been using WordPress on numerous websites for about a year and am nervous about switching to another platform.
I have heard excellent things about blogengine.net.
Is there a way I can import all my wordpress content into it?
Any help would be greatly appreciated!
ไพ่ 9 เก ภาษาอังกฤษ
I’ve been absent for some time, but now I remember why I used to love this web site. Thank you, I will try and check back more frequently. How frequently you update your site?
Free Roblox Robux
We absolutely love your blog and find almost all of your
post’s to be precisely what I’m looking for.
Does one offer guest writers to write content for yourself?
I wouldn’t mind creating a post or elaborating on a few
of the subjects you write regarding here. Again, awesome weblog!
Damon Pavlov
You’re the best, I enjoyed – Gulvafslibning | Kurt Gulvmand. It was good. View my blog sometime, it all about Longwood, FL Real Estate.
Jimmy Lanteigne
https://healthproducts.doodlekit.com/blog/entry/6080658/recreational-cannabis-could-become-legal-in-new-mexico
doorwin windows and doors
I’ve been exploring for a bit for any high quality articles or blog posts on this sort of area . Exploring in Yahoo I at last stumbled upon this website. Reading this info So i’m happy to convey that I’ve an incredibly good uncanny feeling I discovered just what I needed. I most certainly will make sure to do not forget this site and give it a look regularly.
http://lazifrigorifice.santaswordshop.com
Right here is the right blog for anybody who really wants
to understand this topic. You realize so much its almost hard to argue
with you (not that I personally would want to…HaHa).
You certainly put a fresh spin on a subject that has been discussed for ages.
Great stuff, just great!
ps4 games
It’s an awesome piece of writing for all the web people;
they will obtain benefit from it I am sure.
เว็บแทงบอลออนไลน์ ถูกกฎหมาย
My spouse and I stumbled over here coming from a different page and thought I may as well check things out. I like what I see so i am just following you. Look forward to looking into your web page for a second time.
Judi Online
I blog often and I truly appreciate your content.
This article has truly peaked my interest. I will take a note of your site and keep checking for new information about once a week.
I subscribed to your RSS feed too. http://bwsi-racecar.com/wiki/index.php/User:ErnieSlocum883
animal porn
the best hacklink services famoid.
hack dragon city
Very informative blog post.Thanks Again. Great.
Furniture installation team
Good – I should definitely pronounce, impressed with your web site. I had no trouble navigating through all tabs as well as related information ended up being truly simple to do to access. I recently found what I hoped for before you know it in the least. Quite unusual. Is likely to appreciate it for those who add forums or something, website theme . a tones way for your customer to communicate. Nice task..
cialis prices
especially great cialis off church
cialis generic
seriously term tadalafil pretty ride
[url=http://cialislet.com/#buy cialis usa]cialis buy[/url]
finally man cialis initially lock http://cialislet.com/
รถเช่าหาดใหญ่
You really make it seem so easy with your presentation but I find this matter to
be actually something which I think I would never understand.
It seems too complicated and extremely broad for me.
I’m looking forward for your next post, I will try to get the hang of it!
Włodzimierz
I’ve been browsing online greater than 3 hours today, yet I by
no means discovered any interesting article like yours.
It is pretty worth sufficient for me. Personally, if all webmasters
and bloggers made good content as you probably did, the internet will probably be a lot more
useful than ever before.
avcilar butik otel
Hey there! This is my first visit to your blog!
We are a group of volunteers and starting a new project in a community in the same niche.
Your blog provided us useful information to work on. You have done a extraordinary job!
Miami Movers
Hi there! Someone in my Myspace group shared this site with us so I came to check it out. I’m definitely enjoying the information. I’m bookmarking and will be tweeting this to my followers! Great blog and wonderful design and style.
Cliff
What’s up, its nice post on the topic of media print, we all know media is a great
source of data.
sikiş izle
Say, you got a nice article post.Much thanks again. Great.
privacy-policy
Howdy! This is my first visit to your blog! We are a group of volunteers and
starting a new project in a community in the same niche.
Your blog provided us useful information to work on. You have done
a outstanding job!
ps4 games
Great article, totally what I was looking for.
대전 안마
Awesome article.
Kiara
Thank you, I’ve just been looking for info about this topic for a while and yours is the greatest I have discovered till now.
However, what concerning the conclusion? Are you sure in regards to the supply?
whose number is this
Wonderful article! We will be linking to this great article on our website.
Keep up the good writing.
app android
Hello are using WordPress for your blog platform? I’m new to the blog world but I’m trying to get started and create my own. Do
you need any html coding expertise to make your own blog? Any help would
be really appreciated!
Couchtuner
I am not certain where you’re getting your info, however great topic.
I needs to spend some time finding out much more or working out more.
Thanks for fantastic info I was on the lookout for this info for my mission.
Video & Audio
I really liked your blog post.Thanks Again.
Raf Sistemleri
Raf Sistemleri
anal sex
Sex,anal sex,porn,animal porn,teen sex,blowjob
who is this number registered to
Hi there, I desire to subscribe for this blog to get latest
updates, therefore where can i do it please help out.
teen sex
Sex,anal sex,porn,animal porn,teen sex,blowjob
whose number is this mobile
If you wish for to obtain a good deal from
this article then you have to apply such methods
to your won weblog.
who is this number registered to
Just desire to say your article is as astonishing.
The clarity in your post is just spectacular and i could assume you’re an expert on this
subject. Fine with your permission let me to grab your RSS feed to keep updated with forthcoming post.
Thanks a million and please carry on the rewarding work.
سنگسابی
Awesome website you have here but I was curious if you knew of any
community forums that cover the same topics discussed
in this article? I’d really like to be a part of community where I can get suggestions from other experienced
people that share the same interest. If you have any suggestions, please
let me know. Kudos!
สยามสมาคมอโศก
Of course, what a fantastic blog and enlightening posts, I will bookmark your site.All the Best!
business writing consultant
Hi colleagues, fastidious paragraph and nice arguments commented at this
place, I am actually enjoying by these.
app android
Hi to all, how is all, I think every one is getting more from this website, and your views are
fastidious for new people.
W88
We are a bunch of volunteers and opening a new scheme
in our community. Your site offered us with useful info to work on. You’ve performed an impressive task and our entire community shall be thankful to you.
W88
We stumbled over here coming from a different web page and thought I might as well check things out.
I like what I see so i am just following you. Look forward to looking into your web page for a
second time.
Game slot online terbaik
It is appropriate time to make some plans
for the future and it is time to be happy. I have learn this post and if I may I wish
to suggest you some attention-grabbing things or suggestions.
Maybe you could write next articles relating to this article.
I wish to learn even more issues about it!
W88
Yesterday, while I was at work, my cousin stole my iphone and tested to
see if it can survive a 40 foot drop, just so she can be a youtube sensation. My iPad is now broken and she has
83 views. I know this is totally off topic but I had to share it with someone!
W88
Great post. I was checking constantly this blog and I am impressed!
Very useful information particularly the last part 🙂 I care for such info a lot.
I was seeking this certain information for a very long time.
Thank you and good luck.
seo price malaysia
WOW just what I was searching for. Came here by searching for seo malaysia
insta
I simply couldn’t depart your web site before suggesting that I extremely enjoyed the usual info an individual provide for your visitors? Is gonna be back often to check up on new posts
ituVip bandar bola piala uefa
Thanks-a-mundo for the blog article.Much thanks again. Much obliged.
Treadmill assembly
I was just searching for this info for a while. After 6 hours of continuous Googleing, finally I got it in your site. I wonder what’s the lack of Google strategy that do not rank this type of informative websites in top of the list. Normally the top sites are full of garbage.
Free Robux Generator
Hi there! This post couldn’t be written much better!
Reading through this article reminds me of my previous roommate!
He always kept talking about this. I most certainly will
forward this post to him. Fairly certain he will have a great read.
Thanks for sharing!
https://coralisland.wiki/index.php?title=User:GemmaCarlson4
Hello, I enjoy reading through your article. I like to write a
little comment to support you. https://coralisland.wiki/index.php?title=User:GemmaCarlson4
increase domain authority
Im grateful for the blog. Much obliged.
web site
bionlukcombacklinkc indexletme
auto kaufen wien
I believe this site contains some very wonderful info for everyone :D. “Morality, like art, means a drawing a line someplace.” by Oscar Wilde.
coconut oil
Hurrah! In the end I got a web site from where I know how
to actually get valuable facts regarding my study and knowledge.
Learn More
Very good post. Keep writing.
dịch vụ seo
Howdy! I know this is kind of off topic but I was wondering if you knew where I could find a captcha plugin for my comment form?
I’m using the same blog platform as yours and I’m having trouble finding one?
Thanks a lot!
Google Torrent
You made some decent points there. I looked on the web to find out more
about the issue and found most individuals will go along with your views
on this web site.
Charlesfug
generic viagra
John Deere Service Manuals
why do people call Lebron James “King James”. Because Kings rule & have thrones, Lebron hasn’t even won a title, who is Lebron ruling over ?,IAmBobbyDrake,
전주 마사지
I’m extremely inspired with your writing abilities and also with the format to your blog.
Is that this a paid subject matter or did you customize it
yourself? Anyway keep up the nice high quality writing, it’s
rare to look a nice weblog like this one nowadays..
http://cialisico.com/
Hi there to all, how is the whole thing, I think every one is getting more from this site, and
your views are pleasant designed for new people.
Baltimore furniture assembly
I am really impressed with your writing skills and also with the layout on your weblog. Is this a paid theme or did you customize it yourself? Either way keep up the excellent quality writing, it is rare to see a nice blog like this one today..
slot
you’re in point of fact a just right webmaster. The
web site loading pace is incredible. It kind of feels that you are doing any unique trick.
Furthermore, The contents are masterpiece. you have done
a great activity on this subject!
auto kaufen wien
Hi are using WordPress for your site platform? I’m new to the blog world but I’m trying to get started and create my own. Do you need any coding expertise to make your own blog? Any help would be really appreciated!
Pikkujoulubändi
You really make it appear really easy together with your
presentation however I in finding this matter to be
really something which I believe I might never understand.
It seems too complicated and very extensive for me.
I am having a look ahead to your next post, I’ll attempt to get the dangle of it!
DC furniture assembly
Awesome blog you have here but I was wondering if you knew of any community forums that cover the same topics discussed here? I’d really love to be a part of online community where I can get responses from other knowledgeable people that share the same interest. If you have any recommendations, please let me know. Appreciate it!
อาหาร กล่อง เซ เว่ น ปลอดภัย ไหม
Hi there! I could have sworn I’ve been to this blog before but after reading through some of the post I realized it’s new to me. Anyhow, I’m definitely glad I found it and I’ll be book-marking and checking back frequently!
Michaelvar
generic lisinopril
slotxo
Aw, this was an extremely good post. Finding the
time and actual effort to generate a top notch article… but what can I say… I hesitate a lot and never manage
to get anything done.
chocolate latte
I just couldn’t leave your web site before suggesting that I extremely loved the standard info an individual supply for your
visitors? Is going to be again continuously to
inspect new posts
slotxo
hi!,I like your writing very much! share we communicate more about your post on AOL?
I require an expert in this area to unravel my problem. Maybe that
is you! Having a look ahead to see you.
wordpress 90s template
What’s up, yeah this post is genuinely fastidious and I have learned lot of things from it on the topic of blogging.
thanks.
rohrreinigung köln preise
F*ckin’ amazing issues here. I am very happy to look your post. Thanks a lot and i’m having a look ahead to touch you. Will you kindly drop me a e-mail?
coconut oil
I am regular visitor, how are you everybody? This paragraph posted at this website is genuinely pleasant.
BennyLOORA
lasix buy
slotxo
I’m extremely impressed with your writing abilities as
neatly as with the format for your weblog. Is that this a paid theme or did you modify it your
self? Anyway keep up the excellent high quality writing,
it’s rare to peer a nice weblog like this one today..
Charlesfug
tetracycline 500mg adult dosage
1GOM - Link vào M88 mới nhất khi web M88.Com bị chặn
certainly like your web site but you need to
test the spelling on several of your posts. Several of
them are rife with spelling issues and I to find it very
bothersome to inform the truth on the other hand I
will surely come back again.
>> Link vào M88 mới nhất khi web M88.Com bị chặn <<
no more jewish victims
Hmm is anyone else encountering problems with the
images on this blog loading? I’m trying to figure out if
its a problem on my end or if it’s the blog.
Any feed-back would be greatly appreciated.
tanzania safari
I every time used to read post in news papers but now as I am a user of net so from now
I am using net for posts, thanks to web.
slot
I’m curious to find out what blog platform you have been working with?
I’m experiencing some small security problems with my latest site and I’d like
to find something more safeguarded. Do you have any solutions?
Loveland Window Cleaners
Helpful information. Fortunate me I found your web site by chance, and I am surprised why this twist of fate didn’t took place in advance! I bookmarked it.
erectile dysfunction
Needed to draft you that little bit of word to help give thanks over again for those nice methods you have discussed here. This is quite extremely open-handed of people like you to supply unreservedly precisely what a number of us would’ve offered as an ebook in making some cash for their own end, certainly considering the fact that you might have done it in the event you considered necessary. Those ideas likewise acted as the easy way to fully grasp that the rest have the identical passion really like my personal own to find out a good deal more related to this condition. I am certain there are lots of more enjoyable moments up front for folks who check out your website.
Gclub
Thanks-a-mundo for the blog article.Thanks Again. Fantastic.
Furniture installation
I was just seeking this information for some time. After six hours of continuous Googleing, at last I got it in your site. I wonder what is the lack of Google strategy that don’t rank this type of informative websites in top of the list. Normally the top websites are full of garbage.
Judi Online
It’s nearly impossible to find experienced people for this subject, however,
you seem like you know what you’re talking about! Thanks http://tribuneazad.com/index.php?title=User:Hattie2755
free porn
Im thankful for the blog.Really looking forward to read more. Really Cool.
Stewartniz
generic albuterol
Charlesfug
cheap ventolin
Charlesfug
wellbutrin online
ziola powiekszajace biust
Thanks really helpful. Will certainly share site with my buddies. http://machinalansu.pl/ziola-powiekszajace-biust/
Charlesfug
weaning off lexapro 20 mg
SMT Reflow Oven
Hello there, just became aware of your blog through Google, and found that it is truly informative. I’m going to watch out for brussels. I will be grateful if you continue this in future. Lots of people will be benefited from your writing. Cheers!
http://laboratoriogiganti.it/
Much thanks! This a remarkable internet site! http://laboratoriogiganti.it/
http://www.aracne.biz
This is really attention-grabbing, You are a very professional
blogger. I’ve joined your rss feed and sit up for in quest of extra of your wonderful post.
Also, I’ve shared your website in my social networks
Brettthesk
cheap valtrex
website
Everything is very open with a clear explanation of the challenges.
It was truly informative. Your site is very helpful.
Many thanks for sharing!
free Robux Generator
I was curious if you ever considered changing the structure of your blog?
Its very well written; I love what youve got to say.
But maybe you could a little more in the way of content so people could connect with it
better. Youve got an awful lot of text for only having 1 or 2 images.
Maybe you could space it out better?
Furniture Assembly DC
You have brought up a very great points , regards for the post.
Free V Bucks
Howdy! This article could not be written any better! Going through this post reminds me of my previous roommate!
He continually kept talking about this. I am going to forward this post
to him. Fairly certain he will have a great read. I appreciate you for sharing!
Lyn
You actually make it appear really easy along with your presentation but I in finding this matter
to be really one thing which I think I might by no means understand.
It seems too complex and very large for me.
I am looking forward on your subsequent post, I’ll try to get the dangle of it!
web site
web site good services.
Rick
An impressive share! I’ve just forwarded this onto a co-worker who has been conducting a little research on this.
And he actually bought me lunch simply because I discovered it for him…
lol. So allow me to reword this…. Thanks for
the meal!! But yeah, thanks for spending some time to discuss this
topic here on your site.
www.Novelanswer.com
If some one needs to be updated with hottest technologies then he must be visit this web site and be up to date daily.
141257842
Köpek Eğitimi
İstanbul’da güvenilir ve kaliteli eğitimleri hayat felsefesi edinen uzman kadro ile sayısız
hizmetimizden yararlanan binlerce kişi bulunmaktadır.
Köpek eğitimi sabır ve disiplin ile gerçekleşen bir zaman sürecine sahiptir.
Köpeklerde eğitim kulvarları ve eğitim süreçlerimiz keyifli ve eğlenceli geçmektedir.
İstanbul merkezli köpek eğitimi başlıca akıllara gelen ilk soru köpek tuvalet eğitimi ile başlanmaktadır.
Bir çok kişinin sorusu genelde yavru köpek eğitimi ile beraber yetişkin hayvanlarımızın eğitime ne kadar uyumlu olup
olmadığıdır. Gelin hep beraber hayat yoldaşlarımıza yol gösterelim.
Unutmayın ki eğitim hayatımızın her yerinde bulunmaktadır.
Köpek eğitim fiyatları denildiğinde lükse kaçıyor düşüncesi ile
insanların aklına kazınmıştır, lakin biz siz değerli
köpek severlerimize kolaylık ve uygun fiyatlar sunuyoruz.
Eğitimlerimizin yanı sıra seyehat sırasında akraba, eş dost, komşularımız gibi yakın gördüklerimize bu tatlı can arkadaşlarımızı emanet
edip gidiyoruz, aman birşey mi oldu ?, acaba yemek yedi mi
?, hasta mı ? vb.. bir çok soru aklımıza geliyor.
Biz sizler için köpek eğitimi hizmetinin yanı sıra köpek oteli olarak da hizmet veriyoruz.
köpek eğitim merkezi
İstanbul’da istediğiniz gibi tesislerimizi gezebilir,görebilir
ve konaklama sağlıyabilirsiniz. Kalite, Güven, Huzur,
Temizlik köpek eğitim merkezimizin başlıca kurallarıdır.
Huzur veren bu canlıları sevmek, korumak, sahiplenmek biz hayvan severler olarak mutluluğa işte bukadar yakınız.
Metropol hayatının bize vermiş olduğu bu stresli günlerin sonunda eve geldiğimizde bize doğru koşan ya da bahçemizde
sizi gördüğünde üstünüze atlayıp sizi seven hayat ortaklarımıza eğitim konusunda sonuna kadar sizlerin arkasındayız.
Hayat boyu eğitim, hayat boyu disiplin diyelim ve sizleri İstanbul köpek eğitimi merkezine davet edelim.
Köpek Eğitim Fiyatları
Fiyatlarımız vermiş olduğumuz hizm ile karşılaştığında cok küçük rakamlar haline
geliyor neden peki ?, çünkü istiyoruz ki duyarlı ve hayvan dostu insanların bu konuda elimizden geldiğince kolaylık sağlamak.
Yüzlerce eğitim programlarımız bulunmaktadır. Sizin için en ideal olanları uzman arkadaşlarımız ile gelin beraber belirliyelim ve mutlu bir sıcak yuva ortamı ile
köpeğiniz ile güzel günler geçirin.
Sitemiz de sizler için aktif bir şekilde köpek eğitimleri ve diğer
bütün bilgi içeriklerini sizler ile paylaşıyoruz.
Uzman yazarlarımız ve Veteriner hekimlerimiz desteği ile sizlere gerçek,
doğru, saf bilgiyi verme hedefindeyiz.
İstiyoruz ki gerçek anlamda bilgilenin ve yazılarımızı okurken yüzünüzde bir tebessüm belirsin. Genel bloglarımız ve kimi zaman güldüren kimi zaman düşündüren yazılarımız sizler için bilgi kaynağı olucaktır.
movers near me
Good – I should certainly pronounce, impressed with your site. I had no trouble navigating through all the tabs as well as related information ended up being truly easy to do to access. I recently found what I hoped for before you know it at all. Quite unusual. Is likely to appreciate it for those who add forums or anything, website theme . a tones way for your customer to communicate. Nice task.
suction cup dildo
Hey, thanks for the post.Really thank you! Keep writing.
메이저사이트 추천
Hi, Neat post. There is a problem along with your web site in internet explorer, would test this… IE still is the marketplace chief and a huge part of folks will leave out your wonderful writing due to this problem.
Charlesfug
how long is a cialis pill potent
sbobet mobile
WONDERFUL Post.thanks for share..extra wait .. …
coconut oil
Hi, I would like to subscribe for this weblog to take latest
updates, thus where can i do it please assist.
141262048
Merhaba saygı değer Malatya’lı hemşerilerim,
Malatya SEO hizmeti olarak sizlere kısaca birkaç şey söylemek istiyorum.
11 yıldır aktif olarak SEO algoritma ve Google başda olmak üzere bir SEO hayatı serüvenim bulunmaktadır.
Kurumsal firmalar, mağazalar, dükkanlar, ticari
toptan alım satım kısacası iş yerleri olmak
üzere başlıca kişisel SEO işlerinizi halen aktif olarak
yapmaktayım.
11 yıllık bu serüvenimde 7 yıldır profesyonel anlamda Seo Bayi yani
Malatya SEO olarak hizmet veriyorum. Günümüz internet çılgınlığı devam eden bu süreç de herkesin cebinde olan telefonlar ile dünya
parmaklarımızın ucunda olduğunu bütün insanlar kabul görüyor.
Google’ da hizmet verdiğiniz iş yeriniz ile alakalı SEO çalışmalarını gerçekleştirebilirim.
Lafı uzatmak istemiyorum, kısaca Google aramalarında istediğiniz aranan kelimeyi ilk sayfaya getiriyor ve sizin ticari gelirlerinizi bu sayede arttırıyorum.
Örnek vericek olursak; Kayısı satan bir dükkanınız var; ” Arkadaş gün teknoloji devri bende kullanmalıyım satışlarımı artırmalıyım.” diyorsanız Google aramalarında Malatya Kayısı, Malatya
toptan kayısı kelimeleri yazıldığında sizin web sitenizi ilk sayfalara getiriyor ve bu
sayede herkes tarafından kolayca bulunup tanınıyorsunuz.
Genelleme olarak doğal gaz tamiratı, cafe, asansör firmanız, evden eve
nakliyat, rent a car, boya badana, halı yıkama, ürün satışı kısaca aklınıza
gelicek herşeyi Malatya SEO ile istenilen sonuçları
elde edebilirsiniz.
search engine optimization landing page
Amazing! Its genuinely remarkable paragraph, I have got
much clear idea concerning from this post.
logo
Hi! Do you know if they make any plugins to assist with SEO? I’m trying to get my blog to rank for some targeted keywords but I’m not seeing very good success. If you know of any please share. Appreciate it!
Baltimore furniture assembly
It is really a nice and useful piece of info. I’m satisfied that you just shared this useful information with us. Please keep us informed like this. Thanks for sharing.
http://portassicurazioni.it/
You have got one of the best internet websites. http://portassicurazioni.it/site-map/
Rockville furniture assembly
Whats Happening i’m new to this, I stumbled upon this I have found It absolutely helpful and it has helped me out loads. I hope to give a contribution & assist different users like its aided me. Great job.
Ina
I’m extremely impressed together with your writing talents and also with the layout for your
weblog. Is this a paid theme or did you modify it yourself?
Anyway keep up the nice high quality writing, it is uncommon to see
a nice blog like this one nowadays..
cancer breast care memphis tn
It’s actually very complicated in this busy life to listen news on Television, so I only use web for that
reason, and get the newest news.
fibre select dzialanie
Thanks pertaining to giving these sort of substantial knowledge. http://machinalansu.pl/fibre-select/
Charlesfug
http://www.levitra0l1.com
jakie skladniki powinny zawierac preparaty na odchudzanie
Great looking internet site. Presume you did a great
deal of your very own html coding. http://machinalansu.pl/jakie-skladniki-powinny-zawierac-preparaty-na-odchudzanie/
메이저토토사이트
Thank you for some other wonderful post. The place else may just anyone get that type of info in such a perfect approach of writing? I have a presentation next week, and I’m on the search for such info.
Online Video Converter
My spouse and I stumbled over here different web address
and thought I should check things out. I like what I see so i am just following you.
Look forward to going over your web page repeatedly.
sposoby na skuteczne odchudzanie
I like looking at your web site. Thanks for your time! http://machinalansu.pl/sposoby-na-skuteczne-odchudzanie/
teflon tape
Howdy! This is my first visit to your blog! We are a collection of volunteers
and starting a new project in a community in the same niche.
Your blog provided us valuable information to work on. You have done a outstanding job!
Construct Blog
This is one awesome article.Really thank you! Will read on…
Healthcare recruiting firms
Hi! Do you use Twitter? I’d like to follow you if that would be okay.
I’m absolutely enjoying your blog and look forward to new
posts.
free shipping
Thanks for a marvelous posting! I truly enjoyed reading it,
you can be a great author. I will be sure to bookmark your blog and will come back later in life.
I want to encourage you to ultimately continue your great writing,
have a nice evening!
Amazon FBA fee calculator
Hey! This post couldn’t be written any better! Reading this post reminds
me of my previous room mate! He always kept talking about this.
I will forward this article to him. Fairly certain he will have a good read.
Thank you for sharing!
disposisi elektronik
If some one wishes expert view on the topic of blogging
and site-building after that i suggest him/her to pay a visit this website,
Keep up the nice job.
Lime Green Kitty Cat Hoodie
I am not sure where you’re getting your info, but great topic.
I needs to spend some time learning more or understanding more.
Thanks for wonderful information I was looking for this
information for my mission.
Amazon revenue calculator
Whoa! This blog looks exactly like my old one! It’s on a entirely different
topic but it has pretty much the same layout and design. Wonderful choice of colors!
cancun airport car rental
Great blog right here! Additionally your website lots up fast!
What web host are you the usage of? Can I am getting your
associate link on your host? I want my site loaded up
as quickly as yours lol
teflon tape
Hi there everyone, it’s my first visit at this website, and paragraph is
actually fruitful designed for me, keep up posting these content.
Easy Bread Recipes for Beginners
Excellent blog right here! Additionally your web site so much up
fast! What web host are you the use of? Can I am getting
your affiliate hyperlink to your host? I desire
my site loaded up as quickly as yours lol
Nonalcoholic Steatohepatitis (NASH) solutions
I used to be able to find good advice from your blog articles.
desk assembly service
Wow! Thank you! I continuously needed to write on my site something like that. Can I implement a fragment of your post to my website?
see nude galleries of Pammie Lee
I’m also commenting to let you know what a impressive experience my friend’s daughter found viewing your web site. She even learned several issues, which include what it’s like to have a very effective coaching mindset to let the rest smoothly know just exactly a number of complicated matters. You really did more than our own expectations. Thanks for imparting these essential, trustworthy, educational and as well as unique thoughts on the topic to Gloria.
online pharmacy canada
Good – I should definitely pronounce, impressed with your site. I had no trouble navigating through all the tabs as well as related info ended up being truly easy to do to access. I recently found what I hoped for before you know it at all. Reasonably unusual. Is likely to appreciate it for those who add forums or something, site theme . a tones way for your customer to communicate. Excellent task.
Sa casino
What’s up, the whole thing is going sound here
and ofcourse every one is sharing facts, that’s genuinely excellent, keep up writing.
Welch
This is a topic that’s close to my heart… Best wishes!
Exactly where are your contact details though?
Charlesfug
buy generic tadalafil
먹튀검증 슈어맨
I’m impressed, I need to say. Actually not often do I encounter a weblog that’s both educative and entertaining, and let me tell you, you may have hit the nail on the head. Your thought is excellent; the difficulty is something that not sufficient persons are talking intelligently about. I’m very happy that I stumbled throughout this in my seek for one thing regarding this.
USA research chemicals supplier
I really like and appreciate your blog post. Much obliged.
tabletki powiekszajace biust
You’re a really helpful web site; couldn’t make it without
ya! http://machinalansu.pl/tabletki-powiekszajace-biust/
Charlesfug
cialis
dlaczego najskuteczniejsze tabletki na odchudzanie sa takie drogie
So enlightening….look onward to coming back. http://machinalansu.pl/dlaczego-najskuteczniejsze-tabletki-na-odchudzanie-sa-takie-drogie/
tài chính
Hmm it seems like your blog ate my first
comment (it was super long) so I guess I’ll just sum it up what I
submitted and say, I’m thoroughly enjoying your blog.
I too am an aspiring blog blogger but I’m still new to the whole thing.
Do you have any suggestions for inexperienced blog writers?
I’d really appreciate it.
Michaelvar
xenical generic
leespawn
Hello, i feel that i saw you visited my weblog so i got here to return the choose?.I am trying
to find issues to enhance my web site!I suppose
its good enough to make use of a few of your ideas!!
pbn backlinks
I simply had to thank you so much yet again. I do not know what I would have made to happen without the actual smart ideas provided by you regarding this situation. It previously was a very fearsome problem for me personally, nevertheless taking note of the specialized style you processed it took me to weep over happiness. Now i am happy for the work and in addition trust you comprehend what an amazing job you happen to be getting into educating many people all through your site. More than likely you have never got to know all of us.
Baltimore furniture installation
Hi would you mind letting me know which webhost you’re using? I’ve loaded your blog in 3 different browsers and I must say this blog loads a lot quicker then most. Can you recommend a good web hosting provider at a honest price? Thank you, I appreciate it!
Richmond furniture assembly
Hmm is anyone else having problems with the images on this blog loading? I’m trying to figure out if its a problem on my end or if it’s the blog. Any feedback would be greatly appreciated.
Virginia furniture assembly
My programmer is trying to persuade me to move to .net from PHP. I have always disliked the idea because of the expenses. But he’s tryiong none the less. I’ve been using WordPress on several websites for about a year and am worried about switching to another platform. I have heard fantastic things about blogengine.net. Is there a way I can transfer all my wordpress posts into it? Any kind of help would be greatly appreciated!
Annett
Hi there, just wanted to tell you, I loved this article. It
was inspiring. Keep on posting! http://wiki.strat-o-matic.com/index.php/User:UteCarvalho3825
free twitter followers
Hurrah, that’s what I was searching for, what a data!
present here at this web site, thanks admin of this website.
windows 7 loader download youtube
My partner and I stumbled over here coming from a different
web address and thought I might as well check things out. I like what I see so now i am following you.
Look forward to going over your web page
yet again.
Charlesfug
buy sildenafil
Stewartniz
http://www.viagran1p.com
Charlesfug
effects of lasix on eye sight
Jonelle
Hi, after reading this remarkable post i am as well delighted to share my know-how here with colleagues.
Charlesfug
prednisolone generic
free twitter followers
Hello, Neat post. There is a problem with your web site in web explorer,
might check this? IE nonetheless is the market chief and a big component of other folks
will leave out your excellent writing due to this problem.
roblox music codes rap
Generally I do not read article on blogs, but I wish to say that this write-up
very pressured me to try and do so! Your writing taste has been surprised me.
Thanks, quite nice article.
https:www.sandeepgaonkar.com
Im thankful for the article.Really looking forward to read more. Keep writing.
Charlesfug
how to make homade levitra
Free Fortnite Merry Mint Pickaxe
May I simply say what a relief to uncover someone that truly understands what they are discussing over the internet.
You actually understand how to bring an issue to light and make
it important. More people ought to check this out and understand this
side of the story. It’s surprising you’re not more popular because you definitely
have the gift.
Charlesfug
buy albuterol
Property
Anyone serious about fishing Sterling Lake or close by fishing Lakes ought
to seek the advice of with guides and different native resources earlier than heading out
to fish. A reflective Bill. Maggie girl brings out your soul, and
i adore it. 135/month. The newer the improvements the upper the property tax bill.
Along with permit charges for fishing , day use
and in a single day camping, the Tribe additionally receives lease revenue, and tax revenue.
Funding will come from the quarter-cent transportation tax accredited in the course
of the mass transit “doomsday” disaster of Winter ’08.
In addition, nonetheless, additionally, you will discover the locations of the closest airports.
Any use of the above article or photographs without prior permission,
can be in violation of copyright legal guidelines.
J. W. WatsonSnow: a form of precipitation that normally occurs three weeks
prior to and the morning of your departure out of your ski vacation. Palmer turned an academic business companion with Goodyear in 1885 and bought the college
from him three years later. If you are taking a look at funding properties in Palmer
Rapids, then there are about the same houses for sale than there were
three months ago. https://dorismurray.com/
Brettthesk
buy generic viagra
coconut oil
you are actually a good webmaster. The web site loading speed is
incredible. It kind of feels that you’re doing any unique trick.
Furthermore, The contents are masterwork.
you have performed a wonderful activity
in this matter!
Autoankauf
I love what you guys are up too. Such clever work and exposure!
Keep up the terrific works guys I’ve incorporated
you guys to my personal blogroll.
seo
But wanna say that this is very helpful , Thanks for taking your time to write this.
Best IVF Centers in Delhi
I’ve been absent for a while, but now I remember why I used to love this web site. Thank you, I will try and check back more frequently. How frequently you update your web site?
how to grow your twitter followers
I read this post completely on the topic of the resemblance of hottest
and earlier technologies, it’s awesome article.
Professional teeth whitening
But wanna input on few general things, The website pattern is perfect, the content material is real superb. “The idea of God is the sole wrong for which I cannot forgive mankind.” by Marquis de Sade.
Auto kaufen billig
Helpful information. Fortunate me I discovered your site accidentally, and I’m surprised why this accident didn’t took place in advance! I bookmarked it.
Free Roblox Robux
With havin so much written content do you ever run into
any issues of plagorism or copyright infringement?
My site has a lot of exclusive content I’ve either created myself or outsourced but it looks like a lot of it is popping
it up all over the internet without my permission. Do you know any methods
to help stop content from being ripped off? I’d definitely appreciate
it.
electric gate
Your means of explaining the whole thing in this piece of
writing is genuinely nice, every one be able to effortlessly
understand it, Thanks a lot.
ethereum blockchain
No matter if some one searches for his essential
thing, so he/she desires to be available that in detail, therefore that thing is maintained over here.
Scot
Aw, this was an extremely nice post. Spending some time and actual effort to create a good article… but what can I say… I procrastinate a lot
and don’t manage to get nearly anything done.
office 2019 training
Do you have a spam problem on this website; I also am a
blogger, and I was curious about your situation; we have created some nice procedures and we are looking to trade methods with others, be sure to shoot me an e-mail if
interested.
Are you looking for accounts for sale
Incredible quest there. What happened after? Thanks!
Electric gate repair
Nice weblog right here! Also your site rather a lot up
fast! What host are you the usage of? Can I get your associate
hyperlink for your host? I desire my site loaded up as quickly as yours lol
electric gate
I really like it when folks come together and share views.
Great blog, continue the good work!
samsung a20 cases
First off I want to say terrific blog! I had a quick question that I’d like
to ask if you don’t mind. I was interested to find out how you center yourself and clear your
thoughts prior to writing. I’ve had trouble clearing my thoughts in getting my thoughts out there.
I do take pleasure in writing however it just
seems like the first 10 to 15 minutes are usually lost just trying to
figure out how to begin. Any suggestions or tips? Thank you!
Watch The Irishman online free full movie no sign up quora
Have you ever thought about adding a little bit
more than just your articles? I mean, what you say is valuable and everything.
Nevertheless think about if you added some great images or video clips
to give your posts more, “pop”! Your content is excellent but with pics and video clips,
this website could certainly be one of the best in its field.
Superb blog!
motorola moto e6 cases
Hello friends, how is all, and what you wish for to say about this paragraph, in my view its actually amazing in support of me.
google pixel 3a xl cases
I’m gone to say to my little brother, that he should also pay a visit this
web site on regular basis to take updated from most up-to-date
information.
automatic driveway gates
My family members every time say that I am killing my time
here at net, but I know I am getting familiarity all the time
by reading thes good articles.
free twitter followers
Nice answer back in return of this matter with
genuine arguments and describing everything regarding that.
Power bank
I’m truly enjoying the design and layout of your website.
It’s a very easy on the eyes which makes it much more enjoyable for me to come
here and visit more often. Did you hire out a designer to create your theme?
Great work!
Charlesfug
buy cialis online
Charlesfug
synthroid 150 mg
Oslomuffi amateur nordic norge norsk norway norwegian scandinavia xnxx xhamster beeg ixxx mature tube xnxxx gaymaletube gay tube daftsex oslo tnaflix xporn trannytube xnxc xnxx video gonzo xxx xxxnx kowalskypage mom xxx bergen xnxx gay xxx hd anyporn amateurs gone wild xxx tube desixnxx redwap cum4k hotgaylist xnnxx xhamster gay trondheim strapon defloration milfmovs xnzx stavanger anysex xnxz homemoviestube chaturb sexyandfunny preikestolen tromso xnxxn xnxx hd justporno xnxx arab xnzz bangla xxx worldsex xxnn yes xxx xncc xnxxxx iporntv nxxx xxx pic ncl lesbian strapon gay xxx xhamster xxx ice gay tube isexychat streamsex xxx p gonzoxxxmovies mature xxx sexy sex masterbation xnxx teen pinflix xnxx 2019 molde amateur blogs lillehammer xxx story vidz24 free cams bangla xnxx freporn fsiblog newbienudes tabooporns arab xxx ladyboy tube 321sexchat bodo boxtrucksex xxx hub geiranger narvik xnxx black xnxx lesbian cartoon xxx nxnxx beeg mom xxx film beeg xxx zoo xxx alesund desi mms porrn wetpussygames amateur allure oslo airport 8teenxxx xnxx hot bbw xxx draftsex desi xvideo bergen norway desi xxx hotel sex mia khalifa xnxx amature xxnxxx pournhub lamalinks xnxx massage fresex xnxx new young xxx nxgx sister xxx hammerfest red xxx homemadexxx mporn desperate amateurs menhdv amatures gone wild beeg hd xnxx 18 tubexclips xnxx anime xxx v momoka nishina amateuralbum portube xxx mature xxx cam xnxx bbw iyottube mofosex ncl cruises kirkenes neswangy czech amateurs propertysex ebony xxx softcore69 amateur teen amateurs gone true amateurs pporn xnxx boy family xxx youramateurporn korean xxx tromsö big xxx xxxnxxx larvik nxxxn xnxx film xxx boy bigsex mature amateur sexy cartoon oslo norway xnxx big xxxxnx xxx full hd xnxx 2018 amateur lesbian wild amateur pokemon xxx i xxx xxx 2019 harstad amateurcool xnxx family xnxx school norway fjords sxnxx amateur gone sleeping xxx xxx boobs desipapa xxxnn cartoon xnxx heyzo reddit homemade romantic xxx norwegian encore visit norway horse xxx xxx prono tubsexer flåm northern lights norway amateur tumblr norwegian getaway xxx teens norsk to english hordaland xnxx girl norwegian fjords new xxx kongsvinger xxx six school xxx sex audio xnss xnxxm tromso norway xx video hd xxx tv norway in a nutshell xnxx hard otta akershus amateurvoyeurforum åndalsnes xnxx best xnxx yoga amateurblog xnxx bus bus xxx yoga xxx amatuer bergen airport stavanger norway olden norwegian spirit teacher xxx henningsvær xnxvideo vidxxx kayatan brother and sister xxx gay amateur tamilscandals norwegian breakaway xnxx hd video lingerie babes xvideosex pashto xxx xxx full pure xxx xxxindia gudvangen geirangerfjorden teacher xnxx www xnxx video flam norway doctor xnxx sexyhub mallu hot norwegian escape amateur facial leknes norwegian pearl xnxx vidio xnxx full hd xnxx boobs mallu xnxx desi video bangladeshi xx video norwegian star oslofjord busty amateur norwegian cruise ships xnxx amateur baby xxx desi boobs bbw amateur nxxxx norway airport mallu xxx wwwxnx thai xxx alesund norway norway holidays amature blogs buskerud hdxnxx sexy housewife norwegian jade norwegian joy amateur interracial amatuer wife xxx 2018 amateur boobs vidio xnxx tac amateurs amature allure first time xxx filthy amateur amateur gay wetwap amateur pegging sex dress bodo norway indiansexstories2 emiri suzuhara homemade amateur aurland amateurtube bangla video x lofoten norway xnxx 2017 atlantic road norway stavanger airport amateur pov amateur bondage amateur couple pronhd bangladeshi xxx www xxx hd prontube momxnxx sognefjorden oslo opera chubby amateur aalesund real amateur amateur cfnm tonsberg voss norway norwegian jewel wildamateur alta norway norheimsund wwe xnxx xnxx thai tromso northern lights xxx se amateur ffm cities in norway xnxx v xnxx proxy xxx mp4 mature homemade viking museum oslo indansex bollywood xxx ebony amateur youramateur gay amateur tumblr norwegian dawn anker hotel oslo tripadvisor oslo the thief oslo bangla 3x trondheim norway tamilsax amature teen the well oslo oslo to bergen mallu videos big dick amateur amateur mom amateur pawg hotel ullensvang oslo museum hot sexy sex xnxxx hd amateur lingerie amateur teen lesbians mature amature amateur webcam senja norway amateurity my ncl hairy amateur molde norway reine norway norwegian gem hoodamateurs national gallery oslo trofors munch museum oslo akershus fortress oslo gardermoen airport norwegian sky norges wwwsexcom hotel continental oslo amateur strapon amateur cougar ulvik amateur stockings pride of america skjolden amateur teen tumblr doodhwali glory hole amateur hotel tromso nordnorge amateur casting saga hotel oslo flatanger amateur lapdancer brandnewamateurs amateur wife pics hop on hop off oslo storfjord hotel amateur pantyhose pahubad norway tourism lofoten airport amateur bbc xxnxvideo kristiansand norway olden norway cougar amateur amateur teen webcam hell norway free amateurs lofoten islands norway mangpopoy himkok oslo indinsex amateur wife videos norway mountains trf airport undredal amateur teen couple amateur home videos broke amateurs kaupanger redtube amateur amateur hotwife norwegian sun busty teen amateur sheamateur kims amateurs feral amateurs trans amateur pantyamateur hotel union geiranger norwegian cruises 2020 scandic narvik amateur bikini norway lights homemade interracial ameteur norway hiking ncl getaway xxx h black amateur xxnxhd hdpron homemade pegging ncl encore amateur downblouse malayalamxxx gay teen amateur iprontv amateur girlfriend isfjorden norway travel hot amateur amateur foursome ski norway anker hostel oslo oslo to tromso odda norway amateurcfnm royal palace oslo xxxx video hd northern norway amateur teen videos norsk to engelsk norway holidays 2019 radisson blu plaza oslo places to visit in norway amatuer tumblr midnight sun norway amateur dick pics bergenstest xxx mms oslo torp airport geilo norway amateurlapdancer brand new amateurs oslo shopping facial amateur amateur mature wife bergen fjords amatuer lesbians onlyindianporn visit tromso honefoss nidaros cathedral amateur doggy radisson blu scandinavia hotel oslo drobak amateur housewife amature cool oslo to copenhagen alesund airport tripadvisor bergen oslo winter norway money beeg amateur gamle stavanger amateur homemade videos radisson blu plaza hotel oslo young amateur noreg gamvik blonde amateur hotel geiranger sweden norway norway nature nordic union chubby teen amateur amateur allure videos vossevangen ametuer hurtigruten norway oslo city hall teen99 sexy19 privatephotobox amateur lesbian strapon amateur teen facial no1amateurs christiania oslo oslo sightseeing vigeland park oslo bergen museum the nordic amateur redhead amateur hidden cam huge boobs amateur verified amateurs ncl cruises 2020 narvik norway radisson blu tromso baerum norwegian cruise deals holmenkollen oslo xxxmoves bon jovi cruise homemade bondage amateur ladyboy ss norway drammen norway ncl cruises 2019 wife ffm noresund stave church norway ice bar oslo hammerfest norway hafslo norway winter norway tours bergen to oslo wild amatuer ncl breakaway sandefjord airport minnesund oslo sculpture park tromso northern lights tour fakta om norge oslo fjord tour pantyhose couple norwegian cruises 2019 amatuer twitter northern lights oslo bbw casting oslo park amateur public desperate amateurs full xxx saxy flakstad haugesund norway moss norway thon hotel opera oslo bergen fjord aurora borealis norway amateur feet amateur babes holidays in norway ncl escape christmas in norway norway road trip amateur dick boobs amateur amateur wife tumblr amateur 69 oslo attractions amateur rimming best places to visit in norway norway landscape aurora norway amateur solo radisson oslo hamar norway filthyamateur amateur wife bbc bodo airport amateur teen homemade norway trip amateurs from everywhere norwegian cruise line ships amature girls under norway arendal norway cfnm pictures norway ski resorts skarsvåg 17 may norway norway national day mature amateur xxx matureamateur augustin hotel bergen real amateur lesbians amateur teen casting amateur teen pov atlantic ocean road norway amateur bbw pics bergen fjord tour amateur teen cam oslo ski jump bergen railway spicy amateurs amateur beach amateur mature lesbians solvorn norway country amateurfetishist homemade strapon oslo cathedral national museum oslo homemade bisexual real amateur teen lillehammer norway flam railway tickets reine rorbuer nordic cross amateurs gone wilde ncl jade north cape norway day trips from oslo grand cafe oslo skinny amateur hairy teen amateur amateur xx hot amateur teen freeamateur norway shop bergen to flam amateur trans gay amatuer norway sweden border scandinavia tours amature ffm amatuer xxx amateur snapchat hidden mature amateur brunette clarion hotel the hub oslo radisson blu atlantic hotel stavanger amatuer facial homemade foursome norway area x video amateur amateur teen girls ice bar bergen oslo holmenkollen kristiansand airport google maps norway eidfjord camping ncl spirit amateur straight guys freedome stavanger senja island tumblr gay amateur huge dick amateur polar museum tromso amteur sexy lady sex amateur first time lesbian amateur couple tumblr ncl joy homemade mature wife amateur exhibitionist geilo hotel fishing in norway overdeveloped amateurs andalsnes norway amateur hardcore secy video norwegian ships desperate amateurs full videos oslo ski amatuer pegging roald amundsen ship real amateur wife busty homemade srxy amateur wife interracial norway places to visit suburban amateurs sex sex sexy roros norway amateur mature tumblr lærdalsøyri amateurs g yuvutu videos teen gay amateur pregnant amateur amateur thong best places in norway tromso camping zander k hotel bergen harstad norway homemade mature videos true amateurs chelsea kirkenes norway ncl pearl twitter amature amature homemade lonely planet norway myrdal norway places to visit in oslo bergen northern lights 69 amateur homemade teen lesbian roldal best fjords in norway botanical garden oslo real amateur homemade amateur outdoor ncl star skien norway ebony teen amateur sexy sexy sex loen norway amature bondage bergen to stavanger norway attractions bergen shopping amateut lofoten hiking tromso winter amatuer pov finse norway amatuer meaning big dick homemade blonde teen amateur telemark norway amateursfromeverywhere ria oslo ncl ships skinny hairy teen oslo to stavanger true amateurs videos amateur facial pics amateurdump college amateur kristiansund norway nastynyamateurs asian teen amateur kongsberg norway twitter homemade amateur norway islands interracial casting igloo hotel norway bergen hiking amatuer bbw norway day amateur cleavage gay video amateur black teen amateur norway real estate latex amateur homemade lesbian strapon oslo tourism amateur teen interracial amateur allure free amateur home movies korean amateur nordkapp camping amateur slave bergen city twitter amatuer wife first lesbian dubliner oslo amateur teen boobs historical museum oslo amateur mature women clarion hotel admiral bergen norway sweden finland amateur hd no1 amateurs norway tourist attractions tromso taxi norway northern lights tour saxy girl bergen winter amature wife pics amateur wife xxx young amateur teen scandic solli oslo asker norway sandefjord norway visit senja teen exhibitionist scandinavian holidays sexy movie sex ncl dawn amateursteen tripadvisor tromso amateur teen solo nordic unique travels stavanger to bergen eidsdal norway russia border amatuer interracial oslos ncl jewel xxx sixy petite amateur arab amateur clarion the hub oslo halden norway hairy homemade floibanen bergen drunk amateur holidays in norway 2019 amateur first time norwegian cruise line cruise thon hotel tromso norwegian getaway ship xnxx amature ncl cruise deals foursome amateur trømso amatuer wife videos norway bridge city hall oslo ncl cruise ships gol norway arctic norway places in norway ammateur homemade amateur wife free amateur homemade realamateur polar park norway scandic neptun bergen norway independence day oslo tourist attractions norway abbreviation amateur breasts ssbbw amateur vangsnes norway international airport oslo to trondheim wwoof norway homemade 69 oslo fjords vaeroy chasing lights tromso amateurxxxempire trondheim fjord amatuer girlfriend norway in a nutshell bergen czech amature chelsea true amateurs dale of norway outlet oslo to flam amatuer boobs amateur teen bbc lom norway amature dick pics honningsvag norway trondheim cathedral hairy teen casting real amateur mature norra airlines drobak norway amateur lesbian tumblr amateur wife lesbian amateur teen feet chelsea vegas true amateurs spy amateur real first time lesbian norwegian parliament flam fjord amature casting trondheim northern lights norwegian mountains amateur lingerie tumblr true amature amature webcam amateuramber first hotel millennium oslo geirangerfjord norway oslo christmas folk museum oslo voss ski oslo old town amateur wife pictures lesbian strapon amateur amatuer bbc pics amateur norway independence wife first time lesbian amateur lesbian pics amateurfap amateurgirlshot beeg homemade andenes norway spyamateur amateur allure hd thai amateur lonely planet oslo vadso amateur facial tumblr norway and sweden seafood from norway fjords near oslo kingdom of norway horten norway hertz norway denmark scandinavia oslo trf airport bergen tourist information amareur tromso ice domes oslo castle bergen to tromso amateur allure full videos real amature bbw girlfriend bla oslo stavanger cathedral mia malkova amateur allure karmoy to do in oslo bergen marathon amateur party amateur myvidster oslo reptile park norway church oslo international airport nicole aniston amateur oslo to lofoten norwegian independence day xnxx gay amateur finland scandinavia frogner park oslo tromso norway northern lights tromso tours amateur hub nordberg norwegian outdoor trysil ski resort weekend oslo amateur allure full ncl pride of america oral amateur norway road first hotel marin bergen seaweb ncl floro norway amateur ebony lesbians amateuer reddit amateur lesbian radisson blu hotel tromso oslo palace norway parliament akershus castle amatuer hotwife little norway speak norsk anateur norwegian cruise line 2019 norwegian national day kirkenes snowhotel as norway tromso activities svolvaer norway thick amateur rosendal norway amateur girlfriend pics day trips from bergen stavanger to oslo amature charms amateur black lesbians amature home videos homemade interracial videos london pub oslo homemade wife pics voss ski resort otta norway bbw couple amateur girlfriend videos oslo walking tour scandic vulkan oslo sexy photo sex kon tiki museum oslo arctic cathedral tromso karups hometown amateurs tromso aurora forde norway northern lights holidays norway norway in november oslo tours ncl gem norwegian spirit cruise ship green gold of norway prices in norway go2amateur clarion hotel tromso best place to see northern lights in norway amateur boobs tumblr norway in norwegian bergen attractions flam to bergen places to see in norway amatuer mom true amatuer models busty amatuer busty amateur tumblr dnt norway arctic explorers tromso bergen harbour hotel svolvaer airport amateur clips norway customs union amateur first bbc chubby amatuer holidays norway 2019 oslo day trips hurtigruten terminal bergen oslo travel autumn falls amateur allure busty teen casting ncl excursions bergen festival asian amateur tumblr kiwi norway trysil hotel bergen port avis norway vevang ameatur norwegian star cruise bergen sightseeing amateur college girls amateur taboo oslo city bike stjordal mature wife interracial oslo places to visit bergen pass oslo in november flam railway norway norway sightseeing norwegian joy cruise ship norway vacation amateursdoit dreamamateurs tromso to lofoten norwegian jade cruise ship sixy vido amateaur ebony amatuer amataur oslo concert hall interracial webcam laerdal norway amateur wife facial valldalen hardanger norway crowbar oslo oslo city museum mia khalifa amateur ncl shore excursions oslo port homemadeamateu2 samantha rone amateur allure sexy picture sex vulcan amateurs hot amateur wife end of the world norway tromso accommodation oslo sights amateur gay videos tumblr norwegian museum of science and technology oslo pass price amatuer cougar norwegian lights amaetur norwegian escape cruise vik norway tromso to oslo bergen to alesund norway landmarks accuweather trondheim thon hotel terminus oslo norsk for deg desperate amature amateurpicpost noun norsk bergen tours southern charms amateur homemade hardcore trondheim winter orje oslo city pass amateur wife first bbc radisson plaza oslo norway in may fretheim hotel flam tripadvisor norway hamnoy lofoten hordaland norway norwegian encore ship christiania norway tumblr amateur gay norwegian maritime museum norway northern lights hotel norwegian petroleum museum lapland norway sixt norway redtube homemade hot amateur tumblr korean amature norwegian dream norway scandinavia bodo to lofoten norwegian pearl ship sexy sexy sexy sex amateur arab norwegian folk museum lillestrom norway young bloods oslo amature wife tumblr tyssedal hotel lilyhammer norway norwegian getaway cruise oslo torp to oslo grand hotel oslo by scandic cross country skiing near me about norway grimstad norway bergen to trondheim amatuer teen tumblr sesy video oslo sweden teen selfshot tumblr norway sky nordkapp norway gay tumblr amateur dombas norway states in norway frozen norway oslo country bergen tourism amateur allure pov toyen oslo tjome amaeture nordland norway polish amateur best cities in norway amwf amateur amateur facials tumblr bergenstest 2019 amatier amatur xxx amatuer massage norway continent ncl sun lysaker norway norwegian escape ship norwegian spirit cruise finnmark norway amatuar southern norway norwegian independence sola norway clarion admiral bergen western norway norway village norway honeymoon best of norway lexin norsk tromso lodge and camping places to go in norway ncl sky mandal norge senja island norway czech amateurs 122 ncl norwegian norwegian pride of america desi amateur norwegian sky cruise norway night homemade lesbian tumblr mo i rana norway norwegian jade cruise thon opera oslo norwegian dawn cruise ship adverb norsk czech casting tumblr amateur mom tumblr amateur gay xxx amateur women tumblr amateur pegging videos bergen to voss norway in a nutshell tour oslo to bodo bergen norway airport telemark canal tumblr amateur lesbian lonely planet scandinavia norway denmark sweden gay amatuer tumblr mosjoen norway norwegian pearl cruise pride of america cruise tumblr amateur facial ebony bbw homemade norway tourist places ashly anderson amateur allure pinay amateur xnxx amatur amateur bbw tumblr scandinavia trip latefossen norway kongsberg norge akershus norway poverty in norway bryne norway norwegian dawn ship scandinavia finland college ffm norway to sweden norway tour packages honefoss norway norwegian spirit itinerary northern scandinavia oslo to alesund sweden norway finland sweden scandinavia norway in july real amateur tumblr norge norway amateur interracial tumblr pawg amatuer amateur charms united scandinavia stokke norway norwegian pearl cruise ship norwegian sun cruise ship norway destinations engelsk to norsk pride of america cruise ship bergen to lofoten bergenstest eksempel homemade wife bbc anne madam bergen akershus disney norwegian getaway itinerary norwegian breakaway ship ncl norwegian cruise line oslo norway airport ameture allure amateour list of cities in norway iceland norway norwegian breakaway cruise ship nordic market ncl 2020 cruises kurumi hotta norway sweden denmark os norge tumblr amateur wives scandinavian road trip tumblr mature amateur norwegian getaway cruise ship norway holidays 2018 norway in a nutshell from oslo homemade teen tumblr soldier hollow nordic center scandinavian islands ambiguity norsk gay amature tumblr flåm line norwegian gem ship amateurcharms my norwegian chubby amateur tumblr norway lifestyle glosbe norsk polsk amateur hotwife tumblr amateur homemade tumblr amateur cougar tumblr norwegian sun cruise rick steves norway norwegian breakaway cruise amateur girlfriend tumblr bon jovi cruise 2019 visit scandinavia norwegian jewel cruise ship norwegian c norway natural resources norwegian gem cruise ship pride of america ship denmark sweden norway black amatuer ncl website ncl baltic cruise norway kristiansand finland sweden norway lesbian amateur tumblr amateur panties tumblr scandinavian cross xxx ameteur norwegian joy ship dublin to norway amateor aurora borealis observatory senja amature gay tumblr norwegian gem cruise ncl bahamas ltd nordic scandinavian scandinavia road trip norwegian joy cruise norwegian cruise breakaway norwegian river cruises norwegian star ship norway day and night ncl reservations college pawg norwegian spirit itinerary 2019 sexy sexy sexy sexy sex norwegian cruise excursions amateur bbc tumblr amateur mobi norwegian escape itinerary ncl mediterranean cruise norwegian pearl itinerary eu nordic norway packages vaernes norway norwegian dawn cruise norwegian cruise line getaway norwegian star itinerary norwegian sun ship norwegian joy 2019 norwegian jade itinerary amateur pegging tumblr wiktionary norsk norwegian mediterranean cruise amatuer lesbian tumblr norwegian joy itinerary 2019 norwegian jade itinerary 2019 norwegian pearl itinerary 2019 norwegian cruise line breakaway norwegian cruise line escape norwegian joy itinerary northern lights norway 2018 norwegian cruise line excursions best norwegian cruise ship norwegian cruise mediterranean ncl wifi norwegian dawn itinerary norwegian breakaway itinerary norwegian jewel itinerary norwegian jade ship living in scandinavia best norwegian ship norwegian sky cruise ship delicious by nordic norwegian cruise jade norwegian excursions norwegian cruise line pride of america ncl wifi packages my ncl cruise amateur pawg tumblr breakaway cruise ncl deals norway pantip norwegian star itinerary 2019 getaway cruise norsk meaning norwegian baltic cruise pride of america itinerary norwegian jewel itinerary 2019 norway sweden and denmark scandinavian mall solna scandinavia europe norwegian sun itinerary norwegian escape cruise line norwegian gem itinerary scandinavian states norwegian sky ship norwegian 2019 cruises norwegian shore excursions norwegian escape itinerary 2019 netherlands scandinavia nordic skiing near me norway vacation packages norway sweden and finland norwegian sky itinerary norwegian repositioning cruises norwegian cruise joy norwegian cruise pride of america scandinavia to england norwegian cruise dawn of scandinavia ncl company scandinavia area norwegian cruise sky norway sweden finland trip scandinavia eu norwegian cruise gem scandinavian kingdom norway sweden finland tour bergenstest 2018 2 weeks in scandinavia 10 days in scandinavia bergen scandinavia russia scandinavia dis scandinavia norwegian scandinavian norway and sweden trip scandinavia in chinese norwegian cruise line 2018 rick steves scandinavia tour scandinavia germany norwegian cruises 2018 norwegian jade itinerary 2018 norway sweden denmark trip scandinavia in spanish ncl cruises 2018 globus scandinavia scandinavian in chinese
Keep on writing, great job!
Terra
It’s a shame you don’t have a donate button! I’d certainly donate to this
fantastic blog! I suppose for now i’ll settle for book-marking and adding your RSS feed to my Google account.
I look forward to fresh updates and will talk about this site with my Facebook
group. Talk soon!
전주 안마
This site really has all the information I wanted about this subject and didn’t know
who to ask.
BennyLOORA
cheap prozac
Health Adviser Pro
Your style is so unique compared to other folks I have read stuff from. Many thanks for posting when you’ve got the opportunity, Guess I’ll just bookmark this blog.
Lillie
Ahaa, its nice discussion about this article here at this
webpage, I have read all that, so now me also commenting at this place. http://182.191.119.233/ActivityFeed/MyProfile/tabid/60/userId/188359/Default.aspx
Judi Online
When some one searches for his required thing, therefore he/she desires to be available that
in detail, therefore that thing is maintained over here. http://powermarketing.dothome.co.kr/board_MUWh77/624326
wholesale jerseys from china
Everything is very open with a very clear clarification of the issues.
It was definitely informative. Your website is very helpful.
Thanks for sharing!
강남 안마
I don’t even know how I ended up here, but I thought this post was
good. I do not know who you are but certainly you’re going
to a famous blogger if you are not already 😉 Cheers!
Baltimore furniture assembly
Nice blog here! Also your website loads up fast! What web host are you using? Can I get your affiliate link to your host? I wish my site loaded up as fast as yours lol
DC Furniture assembly
Excellent post. I was checking constantly this blog and I am impressed! Extremely helpful information particularly the last part 🙂 I care for such information much. I was looking for this certain information for a very long time. Thank you and best of luck.
MPHP Crystal
Hello! Do you use Twitter? I’d like to follow you if that would be ok.
I’m undoubtedly enjoying your blog and look forward to new posts.
Charlesfug
http://www.ventolin0l1.com
rent house saint augustine
You can certainly see your expertise within the work you write. The sector hopes for even more passionate writers like you who aren’t afraid to mention how they believe. All the time go after your heart. “The point of quotations is that one can use another’s words to be insulting.” by Amanda Cross.
Cheap Jerseys free shipping
Hi there excellent website! Does running a blog such as this take a great deal of work?
I have no expertise in computer programming however I had been hoping
to start my own blog in the near future. Anyhow, should
you have any suggestions or techniques for new blog owners please share.
I know this is off topic but I simply needed to ask.
Appreciate it!
ghicitoare
Thank you for the auspicious writeup. It in fact was a amusement
account it. Look advanced to more added agreeable from you!
However, how can we communicate?
Slot terbaik
Hey excellent website! Does running a blog like this require a massive amount work?
I have no knowledge of coding however I was hoping to start my own blog soon.
Anyways, should you have any ideas or tips for new blog owners please share.
I know this is off topic however I just had to ask. Thanks!
Commercial Insurance Delta
I loved your blog. Want more.
Commercial Insurance Delta
Major thanks for the blog article.Thanks Again.
vati.vn
Hi there, You’ve done an excellent job. I’ll definitely digg it and
personally suggest to my friends. I am sure they will be benefited from this site.
청주 마사지
Hello mates, how is the whole thing, and what you want to say about this
post, in my view its actually remarkable for me.
cheap diet pills
Thanks-a-mundo for the post.Much thanks again. Awesome.
Charlesfug
tetracycline for acne for sale
Heated Power Yoga
Hello my loved one! I wish to say that this post is amazing, great written and come with almost all important infos. I would like to see more posts like this .
vuwsynbio.club
Your mode of telling the whole thing in this post is genuinely good, all be capable of effortlessly know
it, Thanks a lot. https://www.vuwsynbio.club/wiki/index.php?title=User:ArmandXaa518
martial arts Sacramento
Great – I should definitely pronounce, impressed with your website. I had no trouble navigating through all tabs as well as related info ended up being truly easy to do to access. I recently found what I hoped for before you know it in the least. Reasonably unusual. Is likely to appreciate it for those who add forums or anything, site theme . a tones way for your customer to communicate. Nice task.
Damion
Everything is very open with a precise clarification of the issues.
It was really informative. Your site is very helpful. Thank you for sharing!
jaconn.net
I visited many web pages but the audio feature for audio
songs existing at this web page is really superb.
Free V Bucks
Hi my loved one! I want to say that this article is amazing,
nice written and include almost all vital infos.
I would like to look extra posts like this .
free Roblox robux
Thank you for the good writeup. It in fact was a amusement
account it. Look advanced to more added agreeable from you!
However, how could we communicate?
Stewartniz
buy lexapro
Bitsybon
I blog often and I genuinely thank you for your content. This great article has truly peaked my interest. I will bookmark your blog and keep checking for new details about once per week. I opted in for your Feed too.
wholesale nfl jerseys
I have been exploring for a bit for any high quality articles or weblog posts on this kind of area .
Exploring in Yahoo I finally stumbled upon this website.
Reading this info So i am happy to show that I
have an incredibly good uncanny feeling I found out exactly what
I needed. I so much no doubt will make certain to don?t fail
to remember this website and give it a look regularly.
http://hypnotronstudios.com
Great blog! Is your theme custom made or did you download
it from somewhere? A theme like yours with a few simple adjustements would really make my blog
shine. Please let me know where you got your design. Appreciate
it http://hypnotronstudios.com/simpleForum/index.php?action=profile;u=70736
Johnny Sleiman
Just to let you know, i think this would be great as an article, try Yahoo Articles or ezine, you could get some money for it!
cheap levitra online
Thank you for the good writeup. It in fact was a amusement account it.
Look advanced to more added agreeable from you! However, how can we communicate?
Charlesfug
lexapro online
Free Robux Generator
Hi there! Quick question that’s totally off topic.
Do you know how to make your site mobile friendly?
My web site looks weird when browsing from my iphone4.
I’m trying to find a theme or plugin that might be able to resolve this problem.
If you have any recommendations, please share.
Cheers!
melatonina comprar
Very neat blog. Really Cool.
Charlesfug
cost of generic viagra
salon services at home
Hey there! I know this is kinda off topic but I was wondering if
you knew where I could locate a captcha plugin for my comment form?
I’m using the same blog platform as yours and I’m having problems finding
one? Thanks a lot!
gtupuw.org
When I initially commented I clicked the “Notify me when new comments are added” checkbox and now
each time a comment is added I get four e-mails with the same comment.
Is there any way you can remove people from that service?
Bless you!
Reynaldo
Woah! I’m really loving the template/theme of this blog.
It’s simple, yet effective. A lot of times it’s very difficult to get that “perfect balance” between usability and
visual appeal. I must say that you’ve done a awesome job with this.
In addition, the blog loads super fast for me on Firefox.
Exceptional Blog!
Judi Online
Excellent post. I was checking constantly this weblog and I am inspired!
Very useful info specifically the closing part 🙂 I take care
of such info much. I was looking for this certain info for a long time.
Thanks and good luck. https://carding.su/member.php?u=307908
CBD Oil UK
Hi, I do think this is an excellent web site.
I stumbledupon it 😉 I am going to revisit once again since I saved
as a favorite it. Money and freedom is the best way to change,
may you be rich and continue to guide other people.
shilajit
Wow, this paragraph is pleasant, my younger sister is analyzing such things, thus I am
going to inform her.
http://demo.merccentre.com/?option=com_k2&view=itemlist&task=user&id=36986
I’m not certain the place you’re getting your information, but good topic.
I needs to spend some time studying much more or understanding more.
Thanks for magnificent information I was on the lookout for this info for my mission.
Best CBD Oil
Hi there friends, its impressive post regarding teachingand fully explained, keep
it up all the time.
cheap nfl jerseys
Hi to every single one, it’s really a good for me to go
to see this site, it consists of precious Information.
Cheap Jerseys from china
This paragraph will help the internet users for building up new web site
or even a blog from start to end.
Best CBD Oil
Hello exceptional website! Does running a blog
similar to this require a massive amount
work? I have absolutely no knowledge of coding but I had been hoping to start my own blog soon. Anyhow, should you have
any ideas or techniques for new blog owners please share.
I understand this is off topic however I simply wanted to ask.
Thank you!
Rubin
This text is priceless. How can I find out more?
Best CBD Oil
Greetings from Idaho! I’m bored to tears at work
so I decided to check out your site on my iphone during lunch break.
I really like the information you present here and can’t wait to take a look when I get home.
I’m amazed at how quick your blog loaded on my phone ..
I’m not even using WIFI, just 3G .. Anyways, excellent site!
Cheap Jerseys china
This is my first time go to see at here and i am actually pleassant to read everthing at single place.
best way to lose weight
Thanks for the article post.Thanks Again. Much obliged.
kak-oformit-nasledstvo.blogspot.com
I do not know if it’s just me or if perhaps everybody else experiencing problems with your blog.
It appears like some of the text on your posts are running
off the screen. Can someone else please comment and let
me know if this is happening to them as well? This might be a issue with my web
browser because I’ve had this happen before. Thanks
total stranger
I’m gone to convey my little brother, that he should also go to see this blog on regular basis to take updated from most up-to-date gossip.
cheap jerseys
Hello there, just became aware of your blog through Google, and found
that it’s really informative. I’m going to watch out for brussels.
I will be grateful if you continue this in future.
Numerous people will be benefited from your writing.
Cheers!
wholesale jerseys
I am curious to find out what blog platform you are using?
I’m experiencing some small security issues with my latest blog and I’d like to find something more safeguarded.
Do you have any solutions?
cheap nfl jerseys
Howdy! I know this is kinda off topic however I’d figured I’d ask.
Would you be interested in trading links or maybe guest authoring
a blog post or vice-versa? My website addresses
a lot of the same topics as yours and I think we could greatly
benefit from each other. If you’re interested feel free to send me an email.
I look forward to hearing from you! Wonderful blog by the
way!
child porno
I’m extremely inspired along with your writing talents as
smartly as with the format in your blog. Is that this a paid topic or did you customize it yourself?
Anyway keep up the excellent quality writing, it is uncommon to
look a great weblog like this one nowadays..
Cheap Jerseys free shipping
Wow, fantastic blog format! How long have you ever been blogging
for? you make running a blog glance easy. The whole look of your website is excellent, as neatly as the content!
csr stories
This is a really good tip particularly to those new to the blogosphere. Brief but very accurate information… Appreciate your sharing this one. A must read article!
biệt thự
What’s up colleagues, good piece of writing and pleasant arguments commented at this place, I am really enjoying
by these. biệt thự https://nhalouis.com/thiet-ke-nha-biet-thu-dep
Doretha
On the other hand, Canadian players are accepted at large choice of potential international online casinos.
Casinos are using bonus offers more than ever before to advertise their brand
to players worldwide, and feel to acquire them to the
door than free money. but which includes not even attempt to do with it, (and
they all learn that in no time).
Free Fortnite Minty Pickaxe
I visited various sites but the audio quality for audio songs present at this web page is genuinely
excellent.
uk parcel forwarding service
Unquestionably believe that which you said. Your favorite reason seemed to be on the net the easiest thing to be aware of. I say to you, I certainly get irked while people consider worries that they just don’t know about. You managed to hit the nail upon the top and defined out the whole thing without having side-effects , people can take a signal. Will likely be back to get more. Thanks
spadshchyna-za-zakonom.blogspot.com
Does your blog have a contact page? I’m having a tough time locating it
but, I’d like to shoot you an e-mail. I’ve got some ideas for your blog you
might be interested in hearing. Either way, great website and I look forward
to seeing it develop over time.
http://www.yongseovn.net/forum/home.php?mod=space&uid=2008431&do=profile
Have you ever thought about writing an ebook or guest authoring on other sites?
I have a blog centered on the same information you discuss and would love to
have you share some stories/information.
I know my subscribers would appreciate your work. If you are even remotely interested, feel free to send me an e-mail. http://www.yongseovn.net/forum/home.php?mod=space&uid=2008431&do=profile
Virginia furniture assembly
I was recommended this blog by my cousin. I’m not sure whether this post is written by him as no one else know such detailed about my problem. You are amazing! Thanks!
cheap jerseys
I think the admin of this web page is truly working
hard for his web page, as here every stuff is quality based stuff.
Cheap Jerseys free shipping
Hmm it looks like your website ate my first comment (it was extremely long) so I guess I’ll just
sum it up what I wrote and say, I’m thoroughly enjoying your blog.
I too am an aspiring blog writer but I’m still new to the whole thing.
Do you have any tips for beginner blog writers? I’d definitely appreciate it.
movie
Good article. I am facing many of these issues as well..
คาสิโนออนไลน์ ได้เงินจริง
These days of austerity plus relative anxiety about having debt, a lot of people balk up against the idea of having a credit card in order to make purchase of merchandise as well as pay for any gift giving occasion, preferring, instead only to rely on the actual tried along with trusted approach to making transaction – raw cash. However, if you have the cash available to make the purchase entirely, then, paradoxically, that’s the best time for them to use the credit cards for several causes.
oprol evorter
Good – I should certainly pronounce, impressed with your web site. I had no trouble navigating through all tabs as well as related info ended up being truly easy to do to access. I recently found what I hoped for before you know it at all. Reasonably unusual. Is likely to appreciate it for those who add forums or anything, web site theme . a tones way for your customer to communicate. Nice task.
how to lease a truck
Great post. I used to be checking continuously this weblog and I’m inspired!
Very helpful information specifically the closing phase 🙂 I maintain such info a lot.
I used to be looking for this particular information for a long time.
Thanks and good luck.
bitcoin
Wonderful blog! I found it while browsing on Yahoo News. Do
you have any suggestions on how to get listed in Yahoo News?
I’ve been trying for a while but I never seem to get there!
Thanks
wholesale nfl jerseys
This is the right webpage for anyone who hopes to find out about this topic.
You understand so much its almost hard to
argue with you (not that I personally would want to…HaHa).
You definitely put a fresh spin on a subject that has been discussed for a long time.
Wonderful stuff, just excellent!
wholesale nfl jerseys
Good info. Lucky me I recently found your website by chance (stumbleupon).
I have book-marked it for later!
www.servicetech.gr
It is really a nice and useful piece of info. I’m glad that you just shared this useful
info with us. Please keep us informed like this.
Thank you for sharing. http://www.servicetech.gr/UserProfile/tabid/43/UserID/400677/Default.aspx
zayaviti-na-spadshchynu.blogspot.com
I’m very pleased to discover this web site. I wanted to thank you for
your time for this particularly wonderful read!!
I definitely enjoyed every part of it and i also have you saved as
a favorite to check out new things in your web site.
animal porn
best hacklink services buzzoid.
https://higo.vn/
I am curious to find out what blog platform you are using?
I’m experiencing some minor security issues with my latest site and I would
like to find something more risk-free. Do you have any suggestions?
wholesale jerseys
I think everything said was very logical. However, what about this?
what if you wrote a catchier post title? I
ain’t saying your content isn’t good., but what if
you added a title to maybe get a person’s attention? I mean Enrollment, Tuition,
and Discount Rate: The Sweet Briar Story, Part 3 –
Unsolicited Guru is a little boring. You should peek at Yahoo’s home page and see how they create
article headlines to get viewers interested. You might add a
video or a pic or two to get people interested about what you’ve got to say.
In my opinion, it would bring your posts a little livelier.
wholesale nfl jerseys from china
I am genuinely thankful to the holder of this site who has
shared this fantastic post at at this time.
Topovie
I quite like reading through a post that can make people think. Also, thanks for allowing for me to comment.
Airport taxi service
Hi there, I enjoy reading through your article. I like
to write a little comment to support you.
Furniture Assembly DC
Hello there, simply changed into aware of your weblog thru Google, and found that it’s truly informative. I’m going to be careful for brussels. I’ll appreciate if you happen to continue this in future. Numerous people will probably be benefited out of your writing. Cheers!
pawnemporium llc
Hello there! This is my first comment here so I just wanted to give a quick shout out and tell you I genuinely enjoy reading through your articles.
Can you recommend any other blogs/websites/forums that cover the
same topics? Thanks for your time!
Secret 4 You
Wonderful article! We will be linking to this particularly great post on our site. Keep up the great writing.
Cheap Jerseys china
It’s genuinely very difficult in this active life to listen news on Television, so I just use
the web for that purpose, and get the newest news.
Cheap Jerseys from china
Having read this I thought it was rather enlightening. I appreciate you taking the time and energy to
put this information together. I once again find myself personally spending a significant amount of time both reading and commenting.
But so what, it was still worth it!
039;uomo/
I appreciate the knowledge on your website.
Thanks! http://nnet.it/quando-finisce-lo-sviluppo-dell&
Cheap Jerseys from china
I’m gone to tell my little brother, that
he should also visit this weblog on regular basis to obtain updated from newest news.
http://www.th-konehelppi.fi/
I loved as much as you will receive carried out right here. The sketch is attractive, your authored subject matter stylish. nonetheless, you command get got an nervousness over that you wish be delivering the following. unwell unquestionably come more formerly again as exactly the same nearly a lot often inside case you shield this increase.
wholesale jerseys from china
Hi friends, how is everything, and what you would like to say about
this post, in my view its really awesome designed for me.
ราคา รับ จัด อาหาร บุฟเฟ่ต์
Definitely, what a splendid site and informative posts, I definitely will bookmark your site.Best Regards!
travel destinations
Hello there, I found your blog via Google whilst searching for a comparable matter, your web site came up,
it appears to be like great. I’ve bookmarked it in my google bookmarks.
Hi there, simply was alert to your blog through
Google, and found that it is truly informative.
I am gonna be careful for brussels. I will be grateful if you happen to continue this in future.
Numerous other folks might be benefited out of your writing.
Cheers!
Spies in Disguise 2019 full movie in hindi watch online hd dailymotion
constantly i used to read smaller articles that also clear their motive, and
that is also happening with this article which
I am reading at this time.
vi da ca sau
I will right away grab your rss feed as I can not in finding your email subscription hyperlink or e-newsletter service.
Do you have any? Please permit me recognize so that I may subscribe.
Thanks.
travel guide
I just could not leave your website prior to suggesting
that I actually enjoyed the standard info a person provide for your visitors?
Is gonna be back regularly to inspect new posts
CBD Oil UK
Hi friends, its fantastic article about educationand fully explained, keep it up all the time.
http://tamiledirectory.com
Very soon this site will be famous among all blogging viewers, due to it’s fastidious posts
suyashcollegeofnursing.com
It’s nearly impossible to find well-informed people about this subject, however,
you sound like you know what you’re talking about! Thanks
Regina
Great post! We will be linking to this great article
on our website. Keep up the great writing. http://www.wnypba361online.org/fluxbb/profile.php?id=80932
blastup viagra buy
best hacklink service gramblast and blastup.
CBD Oil UK
I was excited to discover this great site. I need to to
thank you for your time due to this fantastic read!! I definitely enjoyed every part of
it and I have you bookmarked to look at new stuff in your blog.
travel destinations
Greetings from Carolina! I’m bored to tears at work so I decided to browse your site on my iphone
during lunch break. I love the information you provide here
and can’t wait to take a look when I get home.
I’m shocked at how quick your blog loaded on my cell phone ..
I’m not even using WIFI, just 3G .. Anyhow, amazing site!
Miranda
I like the helpful information you provide in your articles.
I’ll bookmark your weblog and check again here frequently.
I’m quite certain I’ll learn lots of new stuff right here!
Best of luck for the next!
ingiarethaibinh.com.vn
It is appropriate time to make a few plans for the long run and it’s
time to be happy. I have learn this publish and if
I could I desire to counsel you some attention-grabbing things
or suggestions. Perhaps you could write subsequent articles relating to this article.
I desire to learn more things about it!
Best CBD Oil
An impressive share! I’ve just forwarded this onto a coworker who had been doing a little research on this.
And he actually ordered me lunch due to the fact that I discovered it for him…
lol. So let me reword this…. Thanks for the meal!!
But yeah, thanks for spending some time to talk about this issue here on your blog.
come si fa un pesce in mano
Many thanks very valuable. Will share site with my pals.
come si fa un pesce in mano aumentare lunghezza
pene come si fa ad ingrandire il pene allugamento pene integratori per aumentare il pene http://newtargetgroup.it/dimensioni-minime-pene/
Santo
Hey there! I’m at work browsing your blog from my new iphone 3gs!
Just wanted to say I love reading your blog and look forward to all
your posts! Carry on the superb work!
Vulysis
Sweet blog! I found it while surfing around on Yahoo News.
Do you have any suggestions on how to get listed in Yahoo News?
I’ve been trying for a while but I never seem to
get there! Thank you
CBD Gummies
Hello there! I could have sworn I’ve been to this web site before but after going
through a few of the articles I realized it’s new to me. Nonetheless,
I’m certainly delighted I discovered it and I’ll be book-marking it and checking back frequently!
cheap cialis online
I like what you guys are up too. Such smart work and reporting! Carry on the excellent works guys I have incorporated you guys to my blogroll. I think it’ll improve the value of my web site 🙂
Picture hanging service
I like the valuable information you supply in your articles. I’ll bookmark your weblog and check once more here frequently. I’m fairly sure I’ll learn a lot of new stuff proper here! Best of luck for the following!
Gay Viagra
I want to to thank you for this fantastic read!! I definitely loved every bit of it. I’ve got you saved as a favorite to check out new stuff you post…
cheap nfl jerseys
You actually make it seem so easy with your presentation but I find this matter to be
actually something that I think I would never understand.
It seems too complicated and very broad for me. I’m looking forward for your next post,
I will try to get the hang of it!
Products Tank
Very nice article. I certainly love this site. Keep writing!
rajapoker88
Excellent web site you have got here.. It’s hard to find quality writing like yours these days.
I truly appreciate individuals like you! Take care!!
spadshchyna-bez-zapovitu.blogspot.com
No matter if some one searches for his required thing,
so he/she needs to be available that in detail, so that thing is
maintained over here.
zayavit-na-nasledstvo.blogspot.com
Great post. I used to be checking continuously this blog and I am inspired!
Extremely helpful info specifically the final part :
) I deal with such info a lot. I used to be looking for this certain information for a long time.
Thanks and good luck.
role of technology in health sector
It’s remarkable for me to have a website, which is good in support of my know-how.
thanks admin
Nila
It’s great that you are getting thoughts from this article
as well as from our dialogue made here.
allungare i capelli ricci
Wow cuz this is really helpful job! Congrats and keep it up.
allungare i capelli ricci extension clip capelli ricci costo allungamenti schiena allungare le mani traduzione dimensioni medie pene italiano http://nnet.it/il-pennello-faenza/
Affordable SEO Services
Boost your sales with in weeks, offering 70% off in all our services due to
christmas promotion. SEO & PPC Services in only $199/ Month – Was $699.
Contact: +92 3244464042
Cheap Jerseys china
Amazing blog! Do you have any hints for aspiring writers?
I’m planning to start my own website soon but I’m a little lost on everything.
Would you recommend starting with a free platform like WordPress or go for a paid option? There are so many options out there that I’m totally confused ..
Any recommendations? Bless you!
LED STRIP LIGHTS
Highly energetic blog, I enjoyed that bit. Will there be a part 2?
wholesale nfl jerseys from china
Heya! I’m at work surfing around your blog from my new
iphone 3gs! Just wanted to say I love reading through your blog and look forward to all your posts!
Keep up the outstanding work!
Nick
Nice weblog here! Also your website lots up fast!
What host are you the usage of? Can I get your associate hyperlink on your host?
I desire my site loaded up as quickly as yours lol
wholesale nfl jerseys
What’s Going down i am new to this, I stumbled upon this I have discovered It
positively useful and it has helped me out loads. I am hoping to
contribute & assist different users like its
aided me. Great job.
Free TikTok Fans
Hi there, I enjoy reading through your article. I wanted to write a little comment
to support you.
pryynyattya-spadshchyny.blogspot.com
May I simply just say what a comfort to uncover somebody who genuinely
understands what they’re discussing on the web. You actually know how to bring an issue to light and make it important.
A lot more people should look at this and understand this side of your
story. I was surprised that you’re not more popular given that
you definitely possess the gift.
nasledstvo-v-ukraine.blogspot.com
Do you mind if I quote a few of your posts as long as I provide credit and
sources back to your website? My website is in the exact same niche as yours and
my visitors would certainly benefit from some of the
information you provide here. Please let me know if this alright with you.
Cheers!
come si allungano i muscoli delle gambe
I value the data on your internet site. Thnx!
come si allungano i muscoli delle gambe come fare crescere il pene esercizi genetica penetranza
incompleta come farsi crescere il cazzo déshumidificateur supra deseo http://zwickausuche.de/durchschnittslange-glied-europa/
wholesale nfl jerseys
I have been browsing online more than 4 hours today, yet I never
found any interesting article like yours. It is pretty worth enough for me.
In my view, if all site owners and bloggers made good content as you did, the net will be
much more useful than ever before.
wholesale nfl jerseys
Ahaa, its nice dialogue on the topic of this piece of writing here
at this website, I have read all that, so at this time me also commenting here.
macetasfibradevidrio
Hello it’s me, I am also visiting this web page regularly, this web page is actually pleasant and the visitors are
actually sharing good thoughts.
viagra generic
new tennis absolutely cheap viagra usa without prescription perfectly cheap viagra usa without
prescription actually lady close [url=http://viagrapid.com/#]far online viagra instead[/url] exactly setting http://viagrapid.com/
survival
Have you ever thought about including a little bit more than just your articles?
I mean, what you say is valuable and everything.
However think about if you added some great
graphics or videos to give your posts more, “pop”!
Your content is excellent but with images and video
clips, this site could undeniably be one of the most
beneficial in its niche. Fantastic blog!
Best CBD Gummies
Hello, I enjoy reading through your post. I like to write a little comment to support you.
wholesale jerseys from china
The other day, while I was at work, my sister stole my iphone and tested to see
if it can survive a 25 foot drop, just so she can be
a youtube sensation. My iPad is now broken and she has 83 views.
I know this is completely off topic but I had to share it with someone!
DMV furniture assembly
Thank you for the good writeup. It in fact was a amusement account it. Look advanced to far added agreeable from you! By the way, how could we communicate?
CBD Oil UK
If some one needs to be updated with most up-to-date technologies afterward he must be pay a
quick visit this web site and be up to date all the time.
Best CBD Gummies
Thanks very interesting blog!
CBD Gummies
Link exchange is nothing else except it is simply placing the other person’s blog link on your
page at appropriate place and other person will also do same in favor of you.
Marquis
I have been browsing on-line more than 3 hours today, yet I by no means found any interesting article like yours.
It is beautiful value enough for me. Personally, if all website owners and bloggers made good content
as you did, the internet might be a lot more helpful than ever before.
come allungare una maglia fatta ai ferri
Hello, cool web page you possess there.
come allungare una maglia fatta ai ferri esercizi per ingrossare gambe e glutei deseo jon anderson pillen zur pennisvergrößerung titan gel отзывы http://nnet.it/esercizi-di-stretching-per-crampi-alle-gambe/
Best CBD Gummies
Hi there, i read your blog occasionally and i own a
similar one and i was just wondering if you get a lot of spam feedback?
If so how do you stop it, any plugin or anything you can recommend?
I get so much lately it’s driving me mad so any help is very much appreciated.
web site
site indexletme çalışması.
CBD Oil UK
What’s up, just wanted to mention, I enjoyed this post.
It was helpful. Keep on posting!
wholesale jerseys
Hi! This is my first visit to your blog! We are a collection of volunteers and starting a new project in a community in the same niche.
Your blog provided us valuable information to work on. You have done a marvellous job!
come aumentare la crescita della barba
I love reading your site. Thanks a lot!
come aumentare la crescita della barba esercizi per allungamento della colonna
vertebrale come si fa la ricostruzione unghie con tip e gel
dr extenda forum far crescere traduzione in inglese http://speed-com.fr/te-deseo-mucho-animo/
Best CBD Gummies
Hello There. I found your blog using msn. This is a really smartly written article.
I will be sure to bookmark it and return to read more
of your useful information. Thanks for the post.
I’ll certainly return.
titan gel tantra
Hi, cool web page you’ve got at this time there.
titan gel tantra misura standard del pene pesi al pene ingrossare seno photoshop salsa deseo rennes http://portassicurazioni.it/lunghezza-media-peni-12-anni/
SEO Company Sri Lanka
I am extremely impressed with your writing skills as well as with the layout on your weblog.
Is this a paid theme or did you modify it yourself?
Anyway keep up the nice quality writing, it’s rare to see a great blog like this one these days.
Change
Thanks for sharing excellent informations. Your website is very cool. I’m impressed by the details that you have on this site. It reveals how nicely you understand this subject. Bookmarked this web page, will come back for more articles. You, my pal, ROCK! I found simply the information I already searched all over the place and simply couldn’t come across. What an ideal web site.
Best CBD Gummies
Informative article, exactly what I wanted to find.
Best CBD Oil
I have been browsing on-line greater than three hours these
days, but I by no means found any interesting article like yours.
It’s beautiful price sufficient for me. In my view, if all
web owners and bloggers made excellent content material as you did, the internet can be much more useful than ever before.
macetasparacasa
Wow that was strange. I just wrote an incredibly long comment but after I clicked submit my comment didn’t appear.
Grrrr… well I’m not writing all that over again. Anyway, just wanted to say
fantastic blog!
Best CBD Gummies
Amazing! This blog looks just like my old one!
It’s on a entirely different subject but it has pretty much
the same page layout and design. Superb choice of colors!
phallosan forte prix
Passion the website– extremely user friendly and whole lots to see!
phallosan forte prix titan gel pene maschio pastiglie
al miglio x capelli allungare sinonimo http://nnet.it/groupon-allungamento-ciglia-mendrisio/
macetasparabalcon
Amazing blog! Is your theme custom made or did you download it from somewhere?
A design like yours with a few simple adjustements would really make my blog
jump out. Please let me know where you got your theme.
Appreciate it
falloplastica allungamento
Wow, attractive website. Thnx …
falloplastica allungamento esercizi per allungare il muscolo psoas
come allungare le scarpe da calcio come allungare un vestito nero risotto funghi piselli e pancetta http://nnet.it/corso-extension-ciglia-genova/
kak igrat v poker online
Awesome things here. I’m very satisfied to peer your article.
Thank you a lot and I am having a look ahead to contact you.
Will you kindly drop me a e-mail?
Cheap Jerseys china
Very nice post. I just stumbled upon your blog and wished to say that I have
truly enjoyed browsing your blog posts. In any case I’ll be subscribing
to your rss feed and I hope you write again very soon!
extension capelli corti youtube
Thanks really valuable. Will share website with my friends.
extension capelli corti youtube dimensioni pene in erezione far crescere un figlio in inglese trazione pene el macho wikipedia http://newtargetgroup.it/migliori-prodotti-per-ricostruzione-unghie-acrilico/
vách ngăn vệ sinh
I think the admin of this website is actually working hard
for his web site, for the reason that here every
information is quality based material.
Trading group
you’re really a just right webmaster. The web site loading pace is amazing. It kind of feels that you’re doing any unique trick. Furthermore, The contents are masterpiece. you’ve done a fantastic task on this topic!
come allungarsi la palla su fifa 17 ps3
Amazing Web-site, Stick to the great work. Appreciate it.
come allungarsi la palla su fifa 17 ps3 how to use titan gel farsi allungare il
pene esercizi per non ingrossare le gambe moi moche et méchant 2 el macho http://nnet.it/extension-capelli-con-cheratina-prezzo/
free Robux
WOW just what I was looking for. Came here by searching for free Robux Generator
esercizi naturali per aumentare il seno
Incredibly individual pleasant website. Enormous info offered on few gos
to.
esercizi naturali per aumentare il seno come farsi crescere il pisello ingrossare il seno senza chirurgia integratori per aiutare erezione esercizi per
aumentare massa muscolare della schiena http://portassicurazioni.it/esercizi-genetica-con-penetranza/
Business Furniture Installation
This actually answered my drawback, thanks!
nasledstvo-bez-zaveshchaniya.blogspot.com
Nice post. I learn something totally new and
challenging on blogs I stumbleupon every day. It’s always interesting
to read through content from other authors and use a little something from their websites.
wie funktioniert eine penispumpe
Really….such a important websites.
wie funktioniert eine penispumpe i love is your life operazione
allungamento gambe italia penirium funziona davvero cazzo
vero http://portassicurazioni.it/extension-clip-capelli-ricci-costo/
Brighton taxi quote
I’m not that much of a internet reader to be honest but your blogs
really nice, keep it up! I’ll go ahead and bookmark your site to come back in the future.
All the best
allungare il collo
You’ve very good thing at this point.
allungare il collo moche et méchant 2 el macho lunghezza del pene a 14 anni i love
you is because extension clip capelli ricci ebay http://newtargetgroup.it/pene-7-cm/
https://rhizome.org/profile/topt-ravels/
No matter if some one searches for his essential thing,
therefore he/she desires to be available that in detail,
therefore that thing is maintained over here.
Best Forex Signals
I’m really enjoying the theme/design of your web site. Do you ever run into any browser compatibility problems? A small number of my blog readers have complained about my site not working correctly in Explorer but looks great in Firefox. Do you have any advice to help fix this problem?
medical aesthetics
We’re a group of volunteers and opening a new scheme in our community. Your web site offered us with valuable information to work on. You have done an impressive job and our whole community will be grateful to you.
come allungare le scarpe di un numero
Thank you! This is definitely an great website!
come allungare le scarpe di un numero peso pena love is your name chords pastiglie
per ingrassare love is your name chords http://nnet.it/come-allungare-le-ciglia-con-il-mascara/
obovyazkova-chastka.blogspot.com
Keep on writing, great job!
extension capelli con clip roma
Simply desired to tell you Now i am thrilled I stumbled in your page!
extension capelli con clip roma come allenare il pene chirurgische penisverlängerung titan gel efficace ou pas pisellini findus senza glutine http://nnet.it/piselli-surgelati-in-padella-con-pancetta/
inheritance-by-law.blogspot.com
I do not know if it’s just me or if perhaps everybody else encountering issues
with your site. It appears like some of the written text within your content are running off
the screen. Can somebody else please provide feedback and let me know if
this is happening to them as well? This might be a problem with
my browser because I’ve had this happen previously.
Appreciate it
uomini con peni enormi
Especially instructive, look onward to coming back.
uomini con peni enormi esercizi per potenziare le gambe a corpo libero el
macho minion come si fa ad allungare il pene las trampas del deseo streaming vostfr http://mts47.fr/occasion-knaus-deseo/
webpage
Piece of writing writing is also a excitement, if
you know then you can write if not it is difficult to write.
ricostruzione unghie con semipermanente
What’s up, nice internet site you’ve gotten at this time there.
ricostruzione unghie con semipermanente titan gel site officiel pisellino attore gomorra
pene piu largo stretching schiena alla sbarra http://portassicurazioni.it/allungamento-ciglia-naturale/
Santo
Hello, I check your new stuff regularly. Your story-telling style is witty, keep
up the good work!
UK package forwarding
Woah! I’m really enjoying the template/theme of this website. It’s simple, yet effective. A lot of times it’s difficult to get that “perfect balance” between user friendliness and appearance. I must say you’ve done a fantastic job with this. Additionally, the blog loads super quick for me on Chrome. Exceptional Blog!
Efrain
I really love your blog.. Pleasant colors & theme. Did you create
this site yourself? Please reply back as I’m trying to create my very own blog
and want to find out where you got this from or what the theme is named.
Many thanks!
come far alzare il pene
You’re an extremely useful web site; couldn’t make it without ya!
come far alzare il pene 038;lov/ 039;aumento-del-seno/ allungamento corona clinica video esercizi di stretching per crampi alle gambe http://nnet.it/pisellini-in-inglese/
allungare un vestito con tulle
Thanks regarding providing these kinds of fantastic posting.
allungare un vestito con tulle pisellino braccio di ferro un pene
grosso extension capelli con cheratina opinioni come fare crescere il
pene http://nnet.it/allungamento-del-pena/
metodo per ingrandire il pene
You have the most impressive web sites.
metodo per ingrandire il pene extension capelli
veri con clips modo per far allungare i capelli più velocemente dimensioni normali del glande
pisellini findus ricette http://portassicurazioni.it/allungamento-unghie/
valore calorico piselli freschi
You’ve got among the finest online websites.
valore calorico piselli freschi come alungare il pene integratore per capelli e unghie erbamea esercizi per aumentare
i muscoli delle cosce pisellino arrossato esternamente http://zwickausuche.de/vakuumpumpe-bei-impotenz/
penispumpe vergleich
Love the site– extremely user pleasant and great deals
to see!
penispumpe vergleich esercizi per allungarsi deseo 15 supra acido ialuronico pene esercizi per allargare le spalle da fare a
casa http://nnet.it/per-far-allungare-i-capelli-velocemente/
quanto misura un pene piccolo
Keep up the great work and generating the crowd!
quanto misura un pene piccolo esercizi ingrandimento pene io me
le faccio naturali esercizi misure giuste del pene foto peni a riposo http://newtargetgroup.it/pene-senza-cappella/
stretching per addominali alti
Good day, nice web page you’ve gotten in here.
stretching per addominali alti prodotti per ingrossare il pene piselo e patata uomini
con pene lungo come allungare i muscoli dei polpacci http://portassicurazioni.it/extension-capelli-corti-prima-e-dopo/
Mobile Massage Therapy Manila
Do you have a spam issue on this site; I also am a blogger, and I was curious about your situation; we have created some nice methods and we are looking to trade techniques with others, please shoot me an e-mail if interested.
online payday loans
Do you have a spam issue on this website; I also am a blogger, and I was wondering your situation; many of us have developed some nice practices and we are looking to exchange strategies with others, be sure to shoot me an email if interested.
Jeanett
I would like to thank you for the efforts you’ve put in penning this site.
I really hope to view the same high-grade content
by you in the future as well. In fact, your creative writing abilities has inspired me to get my own, personal site now ;
)
esercizi allungamento schiena ernia lombare
Wonderful web-site you’ve gotten in here.
esercizi allungamento schiena ernia lombare pene
sano titan gel commande si possono allungare le maniche di una giacca esercizi di stretching per allungare le gambe http://nnet.it/allungarsi-in-altezza/
Lena
What’s up to all, the contents existing at this website are in fact remarkable for people knowledge,
well, keep up the nice work fellows.
stoimost-oformleniya-nasledstva.blogspot.com
Hey there! This is my first visit to your blog! We are a group of volunteers and starting
a new initiative in a community in the same niche.
Your blog provided us useful information to work on.
You have done a marvellous job!
pene largo 15 cm
Thanks, this website is really beneficial.
pene largo 15 cm pisello grande el macho wikipedia tecniche ingrandimento
pene titan gel iskustva korisnika http://nnet.it/come-avere-il-cazzo-duro/
039;altezza-in-modo-naturale/
Thanks very useful. Will certainly share site with my good friends.
039;altezza-in-modo-naturale/ gonfiare pene 039;odissea/ 039;erezione/ le pene del pene http://portassicurazioni.it/esercizi-per-allungare-il-muscolo-ileopsoas/
دانلود آهنگ های جدید
Hi there Dear, are you actually visiting this web site daily, if so afterward you will absolutely get fastidious knowledge.
miglio compresse per capelli
Nice page, Preserve the fantastic job. Thank you!
miglio compresse per capelli quien le pone limite al deseo allungare i
capelli piu velocemente massaggi per il pene esercizi ingrandimento pene http://nnet.it/esercizi-stretching-bicipite-femorale/
oformlennya-spadshchyny-na-kvartyru.blogspot.com
Hi there, i read your blog occasionally and i own a
similar one and i was just curious if you get a lot of
spam comments? If so how do you reduce it, any plugin or anything you can recommend?
I get so much lately it’s driving me mad so any help is very much appreciated.
whirlpool garten
Please let me know if you’re looking for a author for
your blog. You have some really good posts and I feel I would
be a good asset. If you ever want to take some of the load
off, I’d really like to write some content for your blog in exchange for a link back
to mine. Please send me an e-mail if interested. Kudos!
immagini extension ciglia prima e dopo
Seriously….such a invaluable webpage.
immagini extension ciglia prima e dopo extension capelli ricci biondi clip
spessore del pene acheter member xxl come avere pene piu lungo http://nnet.it/ingrossare-le-braccia-palestra/
dlya-otrymannya-spadshchyny.blogspot.com
hello!,I really like your writing very a lot!
percentage we keep in touch extra approximately your article
on AOL? I require an expert in this area to solve my problem.
May be that is you! Having a look forward to peer you.
roku activation
Well written blog, I follow your blog, you always come
up with informative content. Keep up the good work.
esercizi per allungamento del quadricipite
I appreciate the information on your website. Thanks
a ton!
esercizi per allungamento del quadricipite come far crescere il pene les deseo sport che
ti fa allungare classifica peni http://nnet.it/come-farsi-ingrossare-le-braccia/
nerukhomist-u-spadok.blogspot.com
Hey I know this is off topic but I was wondering if you knew of any widgets I could
add to my blog that automatically tweet my newest twitter updates.
I’ve been looking for a plug-in like this for quite some time
and was hoping maybe you would have some experience with something like this.
Please let me know if you run into anything. I truly enjoy reading
your blog and I look forward to your new updates.
ricostruzione unghie acrilico roma nord
You’ve gotten incredible stuff right.
ricostruzione unghie acrilico roma nord allungamento pene foto
misura perfetta del pene il pene video ingrossare il seno con photoshop http://nnet.it/i-love-your-life-song/
where to sell my watch
Excellent blog here! Also your web site loads up very fast! What web host are you using? Can I get your affiliate link to your host? I wish my site loaded up as fast as yours lol
find us on the web
Hi, Neat post. There’s a problem with your website in web explorer, would check this¡K IE still is the market chief and a good portion of folks will miss your great writing due to this problem.
oformyt-spadshchynu.blogspot.com
I used to be able to find good advice from your articles.
mumbai vip escorts
Pretty nice post. I just stumbled upon your weblog and
wished to say that I’ve truly loved surfing around your blog
posts. In any case I’ll be subscribing on your feed and I’m hoping you write again soon!
/
These are truly great ideas in concerning blogging.
You have touched some fastidious points here. Any way
keep up wrinting.
proflexen
Excellent Website, Preserve the excellent work.
Thank you!
proflexen czym sa zmarszczki mimiczne i jak z nimi walczyc erectzan buy czy istnieje niezawodny srodek na
odchudzanie wypadanie wlosow i jego leczenie http://zdravotnidesign.cz/thyrolin/
nasledstvo-na-kvartiru.blogspot.com
Good post. I learn something totally new and challenging on sites I stumbleupon on a
daily basis. It’s always interesting to read through articles from
other authors and practice a little something from their web
sites.
zemelnyy-pay-u-spadok.blogspot.com
Hi Dear, are you in fact visiting this website on a regular basis, if so
after that you will without doubt obtain pleasant experience.
whirlpool kaufen
I have been exploring for a little bit for any high-quality
articles or weblog posts in this sort of area . Exploring in Yahoo I finally
stumbled upon this website. Reading this information So i’m happy to
convey that I’ve a very good uncanny feeling I found out
exactly what I needed. I such a lot certainly will make certain to don?t
fail to remember this web site and give it a look
on a constant basis.
craigslist phone verified accounts for sale
I would really like to appreciate the endeavors you cash in on written this article. I’m going for the similar best product from you finding out in the foreseeable future as well. Actually your creative writing abilities has urged me to begin my very own blog now. Genuinely the blogging is distributing its wings rapidly. Your write down is often a fine illustration showing it.
http://sinnedbeyondhelp.tumblr.com/
What’s up, all the time i used to check weblog posts
here in the early hours in the dawn, as i like to gain knowledge of more and more.
Thai Massage Therapy
Thanks for sharing excellent informations. Your web-site is very cool. I am impressed by the details that you’ve on this website. It reveals how nicely you perceive this subject. Bookmarked this website page, will come back for extra articles. You, my friend, ROCK! I found just the information I already searched everywhere and simply could not come across. What a great web-site.
LED TUBE LIGHTS
Yet another thing I would like to talk about is that as an alternative to trying to suit all your online degree classes on days of the week that you complete work (because most people are worn out when they get home), try to arrange most of your lessons on the saturdays and sundays and only a couple courses for weekdays, even if it means taking some time off your saturday and sunday. This is fantastic because on the saturdays and sundays, you will be much more rested and also concentrated in school work. Thanks alot : ) for the different tips I have acquired from your blog.
pokemon sword and shield mobile download
Asking questions are in fact nice thing if you are not understanding something entirely, however this piece of
writing presents pleasant understanding yet.
http://dbi-sa.be/en/component/k2/itemlist/user/73326.html
For most recent information you have to visit internet and on internet I
found this web site as a best web site for most recent updates.
bandar togel terpercaya di indonesia
Way cool! Some very valid points! I appreciate you penning
this write-up plus the rest of the website is also very good.
Best CBD Gummies
Hi to all, how is the whole thing, I think every one is getting more from this web page, and
your views are fastidious for new visitors.
Agen Poker Terbaik
I am actually grateful to the holder of this site who has shared this fantastic piece of writing at here.
oformyty-spadshchynu.blogspot.com
Why visitors still use to read news papers when in this
technological world the whole thing is available on net?
betegagy kolcsonzes
Awesome blog you have here but I was wanting to know if you knew of any
message boards that cover the same topics discussed here?
I’d really love to be a part of online community where I can get advice from other experienced individuals that share the same interest.
If you have any recommendations, please let me know. Many thanks!
inheritance-right.blogspot.com
My brother suggested I might like this web site.
He was totally right. This post actually made my day.
You cann’t imagine just how much time I had spent for this information! Thanks!
montessori
Thanks a lot for providing individuals with such a remarkable possiblity to discover important secrets from this web site. It can be so cool and also jam-packed with a good time for me personally and my office colleagues to search your website not less than three times every week to learn the newest items you will have. Of course, I’m just at all times contented considering the unique strategies served by you. Selected 3 facts in this post are completely the most effective we have all had.
inheritance2020-ua.blogspot.com
Heya i’m for the first time here. I came across this board and I find It truly useful & it
helped me out much. I hope to give something back and aid others like you aided me.
exterior painting contractor san diego
You really make it seem so easy along with your presentation however I find this topic to be really one thing which
I feel I would by no means understand. It sort of feels too complex and extremely broad for me.
I’m having a look ahead on your subsequent publish, I will try to get the grasp of it!
Best CBD Gummies
I’m very happy to uncover this site. I wanted to thank you for ones time just for
this fantastic read!! I definitely appreciated every part of it and I have you bookmarked to check out new information on your site.
allithato agy
You have made some good points there. I checked on the
net to learn more about the issue and found most
people will go along with your views on this website.
Best CBD Gummies
certainly like your website however you have to take a look at the spelling on several of your
posts. A number of them are rife with spelling issues and I find it very bothersome to inform the
truth however I will surely come again again.
leaky roof repair oceanside
Hey! I’m at work surfing around your blog from my new apple
iphone! Just wanted to say I love reading your blog and look forward to all your posts!
Carry on the superb work!
CBD Gummies
Aw, this was an extremely nice post. Finding the time and actual effort to create a superb article… but what can I say… I put things off a lot and don’t seem to get anything done.
free v buck generator
Just wish to say your article is as astounding. The clearness on your post is just excellent and i can suppose you’re an expert on this subject.
Fine along with your permission allow me to snatch your feed to keep up
to date with forthcoming post. Thanks one million and please keep up the gratifying work.
otthonapolasi agy
I’ve learn several excellent stuff here. Certainly
value bookmarking for revisiting. I wonder how
much effort you put to make this kind of wonderful informative web site.
betegagy kolcsonzes
It’s in fact very difficult in this busy life to listen news on TV, so I simply use web for that reason, and
take the latest news.
Website design dublin
great points altogether, you just received a emblem new reader. What would you suggest in regards to your put up that you just made some days in the past? Any sure?
Locksmiths
I truly enjoy reading through on this site, it has superb blog posts. “The longing to produce great inspirations didn’t produce anything but more longing.” by Sophie Kerr.
Julieta Bertelson
This is a good tip particularly to those fresh to the blogosphere. Brief but very accurate info… Appreciate your sharing this one. A must read post!
dich123.com
Oh my goodness! Awesome article dude! Thank you so much,
However I am going through troubles with your RSS. I don’t know the reason why
I am unable to join it. Is there anybody having
identical RSS problems? Anyone that knows the solution will you kindly respond?
Thanx!!
web site
backlink indexletme backlinkc bionluk
Brazilian Records
With the quite a few variants obtainable at
men’s underwear stores, you possibly can strive as many
as potential with a purpose to get the proper match down there.
I chatted with Lora at U of L proper earlier than he gave a grasp class at the varsity of Music.
Live music from 8:00 – 10 pm. A Brazilian music ensemble will
assist raise cultural consciousness at University of Wisconsin-Stout and in Menomonie.
During the 2-yr partnership, four worldwide ensembles will visit Menomonie for weeklong musical residencies.
“We assume visits by these wonderful international artists for weeklong residencies offer communities special alternative to experience this music and culture. What is Choro Music? When joined with its African influences, Choro has an irresistible groove and rhythmic momentum that’s uniquely Brazilian. Ever tried Brazilian companion dance Bolero, Forro or companion Samba? Now is your likelihood to take a look at the Brazilian dances that may take your coronary heart by storm. This weekend is the final likelihood to catch the Clifton Roots, Jazz and Heritage Festival on the Clifton Center. With about four slave museums present in Badagry, all of them assist preserve the cultural heritage and remind visiting vacationers the sufferings folks affected by the slave trade went through. https://mararecordsdata.com/
jacuzzi
Hi there friends, fastidious paragraph and nice urging commented at this place,
I am truly enjoying by these.
poker qq terpercaya
Fine way of describing, and good piece of writing
to take information on the topic of my presentation subject, which i am
going to present in university.
Marriage couching
A further issue is really that video gaming became one of the all-time main forms of fun for people of nearly every age. Kids have fun with video games, plus adults do, too. The actual XBox 360 is amongst the favorite gaming systems for people who love to have hundreds of games available to them, along with who like to play live with others all over the world. Many thanks for sharing your ideas.
casio
Hi there, You have done a fantastic job. I will certainly digg it and personally suggest to my friends. I’m sure they’ll be benefited from this site.
pokarmy ktore zwiekszaja metabolizm i spalaja tluszcz
You’ve gotten very well info right here. http://machinalansu.pl/pokarmy-ktore-zwiekszaja-metabolizm-i-spalaja-tluszcz/
https://nhalouis.com/top-30-mau-thiet-ke-biet-thu-dep-va-sang-trong.html
Fastidious answers in return of this matter with real arguments and telling the whole thing concerning that.
biet thu https://nhalouis.com/top-30-mau-thiet-ke-biet-thu-dep-va-sang-trong.html
match.com free trial
I could not refrain from commenting. Exceptionally well written!
Watch Star Wars: Episode IX The Rise of Skywalkers
Hi there to every , since I am actually keen of reading
this website’s post to be updated regularly. It includes fastidious material.
Charlie Cubillo
Having read this I believed it was rather enlightening. I appreciate you finding the time and energy to put this short article together. I once again find myself spending way too much time both reading and posting comments. But so what, it was still worth it!
Theresa
I blog quite often and I truly appreciate your content.
The article has truly peaked my interest. I will take a note of your
site and keep checking for new information about once per week.
I subscribed to your Feed too.
plenty of fish vs match.com free trial
Awesome things here. I’m very happy to peer your article.
Thank you a lot and I’m looking forward to touch you.
Will you please drop me a e-mail?
rédacteur web SEO
Truly no matter if someone doesn’t know afterward its up to
other viewers that they will assist, so here it takes place.
web site
index instafollowers good website.
match.com free trial
Amazing! This blog looks just like my old one! It’s on a totally different topic but it has pretty much the same layout and
design. Great choice of colors!
Cheap flights
Very nice post. I just stumbled upon your blog and wanted to say that I have truly enjoyed surfing around your blog posts. In any case I will be subscribing to your rss feed and I hope you write again very soon!
cpanel hosting
A person essentially help to make seriously posts I would state. This is the first time I frequented your website page and thus far? I amazed with the research you made to create this particular publish incredible. Great job!
Ειδική Εκπαίδευση
Excellent post! We are linking to this great article on our website.
Keep up the good writing.
Instagram Followers
You have made some good points there. I looked on the internet for more info about the issue and found most people will go along with your views on this web site.
ظروف مسی
hello there and thank you for your information – I have definitely picked up something new from right here.
I did however expertise several technical issues using this
web site, since I experienced to reload the web site a lot of times previous to I could get it to load
correctly. I had been wondering if your web hosting is OK?
Not that I’m complaining, but sluggish loading instances times will
often affect your placement in google and can damage
your high-quality score if ads and marketing with Adwords.
Well I’m adding this RSS to my e-mail and could look out for much more of your respective exciting content.
Ensure that you update this again very soon.
tubidy
Amazing things here. I’m very happy to see your post. Thank you so much
and I’m taking a look forward to contact you. Will you kindly drop me a mail?
how to start business online
Great information. Lucky me I discovered your website by accident (stumbleupon).
I’ve book marked it for later!
long term
It’s going to be finish of mine day, however before ending I am reading this fantastic piece of writing to increase my knowledge.
Logotherapeia lemsos
I’m not sure where you’re getting your information, but good topic.
I needs to spend some time learning much more or understanding more.
Thanks for wonderful information I was looking for this info for my mission.
Malorie
Hey There. I found your blog using msn. This is a very well written article.
I will make sure to bookmark it and come back to read more of
your useful information. Thanks for the post. I’ll definitely return.
Watch Jav Free HD
Really when someone doesn’t know afterward its up to other viewers that they will assist, so here it happens.
http://tinyurl.com/taedfgd
Awesome! Its really amazing piece of writing, I have got much
clear idea concerning from this article.
oformlennya-spadshchyny.blogspot.com
I was suggested this blog by my cousin. I’m not sure whether this post is written by him as no one else know such detailed about my trouble.
You’re amazing! Thanks!
live score ball by ball
you might have an amazing blog here! would you like to make some invite posts on my weblog?
website
But a smiling visitant here to share the love (:, btw great design .
grow tiwtter followers
Highly descriptive article, I liked that
a lot. Will there be a part 2?
links
I appreciate, cause I found just what I was looking for. You have ended my 4 day long hunt! God Bless you man. Have a great day. Bye
http://www.myfolio.com/toptravels1
Awesome things here. I am very glad to peer your article.
Thank you so much and I am taking a look ahead to touch you.
Will you kindly drop me a mail?
Jinnamje.Com
May I simply say what a relief to find somebody who genuinely knows what they are talking about on the web.
You definitely know how to bring a problem to light and make
it important. A lot more people really need to check this out and understand this side of your story.
I was surprised that you are not more popular
given that you surely possess the gift.
cashcentralpawn
Fantastic beat ! I would like to apprentice while you amend your website, how could i
subscribe for a blog website? The account helped
me a acceptable deal. I had been a little bit acquainted
of this your broadcast provided bright clear concept
sling tv
Currently it looks like Expression Engine is the top blogging platform available right now.
(from what I’ve read) Is that what you are using on your blog?
Boston Photographer
I like reading through an article that will make people think. Also, many thanks for permitting me to comment.
Lifestyle Photographer
Good post! We will be linking to this particularly great content on our site. Keep up the good writing.
best cbd oil for pain
There is certainly a great deal to find out about this issue. I like all the points you’ve made.
http://bit.ly/2SfZros
Appreciation to my father who told me about this weblog, this blog is actually remarkable.
villa http://bit.ly/2SfZros
free twitter followers
Excellent beat ! I wish to apprentice while you amend your web site, how could i subscribe for
a blog web site? The account aided me a acceptable deal.
I had been a little bit acquainted of this your broadcast offered bright clear concept
https://thietkebietthutancodien.home.blog
Pretty! This has been a really wonderful post. Thanks for supplying this
information. In other terms, when people hunt for “types of houses”,
many usually are looking for the diverse architectural styles while some others are looking for
the particular different varieties of residential constructing structures.
http://bit.ly/35Nherh
Darell
Thanks for sharing your thoughts. I really appreciate your efforts and I will be waiting
for your next post thank you once again.
Charissa
Hey! Do you know if they make any plugins to
safeguard against hackers? I’m kinda paranoid about losing everything I’ve worked
hard on. Any tips?
Massage Chair
These airbags ship a full body massage every time.
udaipur escorts
One thing I would like to reply to is that weightloss routine fast can be achieved by the proper diet and exercise. A person’s size not simply affects appearance, but also the actual quality of life. Self-esteem, depressive disorders, health risks, and also physical capabilities are damaged in excess weight. It is possible to just make everything right and at the same time having a gain. In such a circumstance, a problem may be the offender. While excessive food rather than enough exercising are usually to blame, common medical ailments and key prescriptions can easily greatly amplify size. Thanks a bunch for your post right here.
BIIB Stock price today
Some truly fantastic blog posts on this site, appreciate it for contribution.
best cbd oil for anxiety
Good post. I learn something new and challenging on websites I stumbleupon every day. It will always be helpful to read articles from other authors and practice something from their websites.
training your employees
very nice put up, i certainly love this website, keep on it
Free classified sydney
I like the valuable information you provide in your articles. I’ll bookmark your blog and check again here regularly. I am quite sure I will learn lots of new stuff right here! Best of luck for the next!
best cbd oil for sleep
This is a topic that is close to my heart… Cheers! Exactly where can I find the contact details for questions?
find here
Nice post. I learn something more challenging on different blogs everyday. It will always be stimulating to read content from other writers and practice a little something from their store. I’d prefer to use some with the content on my blog whether you don’t mind. Natually I’ll give you a link on your web blog. Thanks for sharing.
organic soaps for eczema
Your style is unique compared to other folks I’ve read
stuff from. I appreciate you for posting when you’ve got the opportunity, Guess I will just book mark this page.
best moisturizing bar soap
Quality articles is the important to interest the people to pay a quick visit the
web page, that’s what this web site is providing.
horoscopo Acuario
My coder is trying to persuade me to move to .net from
PHP. I have always disliked the idea because of the costs.
But he’s tryiong none the less. I’ve been using WordPress on numerous websites for about a year and
am concerned about switching to another platform.
I have heard very good things about blogengine.net. Is there a way I can transfer all my wordpress
content into it? Any help would be greatly appreciated!
shipping container domes
Hey there! This post couldn’t be written any better! Reading this
post reminds me of my old room mate! He always kept chatting about this.
I will forward this article to him. Fairly certain he
will have a good read. Thank you for sharing!
best cbd capsules
Great post! We are linking to this particularly great post on our site. Keep up the great writing.
horoscopo Cáncer
It’s really a nice and helpful piece of information. I am glad that you just shared this useful information with us.
Please keep us informed like this. Thanks for sharing.
Middle East News Today
Hello there! I could have sworn I’ve visited your blog
before but after browsing through a few of
the articles I realized it’s new to me. Regardless, I’m certainly delighted I
discovered it and I’ll be bookmarking it and checking
back regularly!
horoscopo Cáncer
excellent issues altogether, you simply gained a emblem new reader.
What may you suggest in regards to your put up that you simply made a
few days in the past? Any certain?
horoscopo Libra
It’s awesome designed for me to have a website, which is
helpful in favor of my knowledge. thanks admin
horoscopo Tauro
Hi Dear, are you genuinely visiting this web page daily,
if so after that you will without doubt get fastidious knowledge.
best cbd oil for pain
It’s difficult to find knowledgeable people on this topic, but you seem like you know what you’re talking about! Thanks
web site
web site indexletme işi.
site
Thanks a lot for sharing this with all folks you really know
what you’re talking approximately! Bookmarked. Kindly additionally seek
advice from my website =). We may have a hyperlink change arrangement between us
sitemap
I went over this internet site and I conceive you have a lot of fantastic information, saved to my bookmarks (:.
web site
web site indexletme kaliteli backlink.
Alex Kay
I needed to thank you for this excellent read!! I certainly enjoyed every little bit of it. I have you saved as a favorite to look at new things you post…
sling tv
My spouse and I stumbled over here different web address
and thought I should check things out. I like what I see so i am just following you.
Look forward to looking over your web page for a second time.
https://sites.google.com/site/bietthunhalouis/
Howdy! This article couldn’t be written any better! Looking through this post
reminds me of my previous roommate! He continually kept preaching about this.
I will send this post to him. Pretty sure he’s going to have a great read.
Many thanks for sharing! thietkebietthunls http://ow.ly/4Sic50xFOyt
DC furniture assembly
Pretty component to content. I just stumbled upon your blog and in accession capital to assert that I get in fact enjoyed account your weblog posts. Anyway I’ll be subscribing for your feeds or even I fulfillment you access constantly quickly.
unsplash
Hello. fantastic job. I did not expect this. This is a splendid story. Thanks!
weed home dispensary
hi!,I really like your writing so so much! share we keep up a correspondence more approximately your post on AOL? I require an expert on this house to unravel my problem. May be that is you! Looking ahead to peer you.
sling tv
Magnificent goods from you, man. I’ve understand your stuff previous to and you’re just too fantastic.
I actually like what you’ve acquired here, certainly like what you’re stating and the way in which you say it.
You make it enjoyable and you still take care of to keep it
smart. I can’t wait to read far more from you. This is actually a
wonderful web site.
news
This site is mostly a stroll-by means of for all the data you needed about this and didn’t know who to ask. Glimpse right here, and also you’ll positively uncover it.
here
Pretty nice post. I simply stumbled upon your blog and wished to mention that I have truly loved browsing your weblog posts. After all I’ll be subscribing on your feed and I hope you write again soon!
navigate to these guys
I like what you guys are up also. Such intelligent work and reporting! Carry on the superb works guys I have incorporated you guys to my blogroll. I think it will improve the value of my site 🙂
outcall massage
Would you be excited about exchanging links?
look at more info
Hi there, You’ve done a fantastic job. I’ll certainly digg it and personally suggest to my friends. I am sure they’ll be benefited from this site.
he has a good point
What¦s Going down i’m new to this, I stumbled upon this I’ve found It positively helpful and it has helped me out loads. I’m hoping to contribute & aid different customers like its helped me. Great job.
Cedrick Varney
It’s hard to find well-informed people on this subject, but you seem like you know what you’re talking about! Thanks
review
Great work! This is the type of information that are meant to be shared across the net. Shame on the search engines for no longer positioning this put up upper! Come on over and discuss with my website . Thank you =)
try here
I’ve been surfing on-line greater than 3 hours lately, but I never discovered any attention-grabbing article like yours. It¦s beautiful value sufficient for me. In my view, if all web owners and bloggers made excellent content material as you did, the internet might be a lot more useful than ever before.
해외축구중계
Today, while I was at work, my sister stole
my iPad and tested to see if it can survive a 40 foot drop, just so she can be a youtube sensation. My apple ipad is now destroyed and she
has 83 views. I know this is totally off topic but I had to share it with someone!
대전출장마사지
I have been browsing on-line greater than 3 hours these days, yet I never
found any interesting article like yours. It’s pretty value sufficient for me.
Personally, if all site owners and bloggers made good content as you probably
did, the internet shall be a lot more useful than ever before.
바카라사이트
you are in point of fact a excellent webmaster. The site loading speed is incredible.
It seems that you’re doing any unique trick.
Moreover, The contents are masterpiece.
you have done a magnificent process in this subject!
packaging supplies
Excellent post. I used to be checking constantly this weblog and I’m inspired!
Very helpful information particularly the remaining phase 🙂 I
maintain such information much. I used to be looking for this particular information for
a long time. Thank you and best of luck.
power washing deck
Thanks on your marvelous posting! I truly enjoyed reading it, you might be a great
author.I will be sure to bookmark your blog and will come back at some point.
I want to encourage you continue your great work,
have a nice weekend!
바카라사이트추천
Hi! I know this is kind of off topic but I was wondering
which blog platform are you using for this website? I’m
getting tired of WordPress because I’ve had issues with hackers and I’m
looking at alternatives for another platform. I would be awesome if you could point me in the direction of a good platform.
해외축구중계
This article is truly a pleasant one it assists new web
visitors, who are wishing for blogging.
DC furniture installers
You are my inspiration, I own few web logs and occasionally run out from brand :). “‘Tis the most tender part of love, each other to forgive.” by John Sheffield.
unexplained phenomena
Everything is very open with a clear description of the issues.
It was definitely informative. Your website is useful.
Thank you for sharing!
英国皮秒
Greetings! Very useful advice within this article! It is the little changes that make the
greatest changes. Thanks for sharing!
해외스포츠중계
Thank you for the good writeup. It in fact was a amusement account
it. Look advanced to more added agreeable from you!
By the way, how could we communicate?
magnetic sheeting
In fact when someone doesn’t understand then its
up to other people that they will assist, so here it takes place.
double sided tape
I think the admin of this web site is in fact working hard in support of his website, because here
every information is quality based information.
pressure washing maple ridge
The other day, while I was at work, my cousin stole
my iPad and tested to see if it can survive a twenty five
foot drop, just so she can be a youtube sensation. My iPad is now broken and she has 83 views.
I know this is completely off topic but I had to share it with
someone!
https://nhalouis.com/bao-gia-thi-cong-hoan-thien.html
bookmarked!!, I really like your blog! thi cong hoan thien nha https://nhalouis.com/bao-gia-thi-cong-hoan-thien.html
pressure washing langley
WOW just what I was looking for. Came here by searching for spring
cleaning
皮秒英国
After looking over a few of the blog articles on your web site, I truly appreciate your way of writing a blog.
I book marked it to my bookmark website list and will be checking back in the near future.
Please visit my website too and let me know how you feel.
皮秒英国
Undeniably believe that which you said. Your favorite justification seemed to be on the web the easiest thing to be aware of.
I say to you, I definitely get irked while people think about worries that they just do not know about.
You managed to hit the nail upon the top and also defined out the whole thing without having side effect
, people can take a signal. Will probably be back to get more.
Thanks
magnets
I was curious if you ever considered changing the page layout of your website?
Its very well written; I love what youve got to say.
But maybe you could a little more in the way of content so people could connect
with it better. Youve got an awful lot of text for only having one
or 2 images. Maybe you could space it out better?
https://nhalouis.com/mau-tieu-canh-dep
Keep this going please, great job! tieu canh phong khach https://nhalouis.com/mau-tieu-canh-dep
Virginia furniture installers
Hey there! I’m at work surfing around your blog from my new iphone! Just wanted to say I love reading through your blog and look forward to all your posts! Keep up the excellent work!
Sixty Sixty Products
May I just say what a comfort to find someone that actually knows what they’re discussing over the internet. You certainly realize how to bring an issue to light and make it important. A lot more people should read this and understand this side of the story. I was surprised that you’re not more popular given that you definitely possess the gift.
commercial properties in gurgaon
certainly like your web site however you have to check the spelling on quite a few of your posts.
Many of them are rife with spelling issues and I find it very
bothersome to tell the truth nevertheless I will certainly come again again.
https://nhalouis.com/co-phai-ban-dang-ban-khoan-gach-xay-nha-loai-nao-tot.html
My developer is trying to convince me to move to .net from PHP.
I have always disliked the idea because of the costs.
But he’s tryiong none the less. I’ve been using WordPress on a variety of websites for about a year and am nervous about switching to another platform.
I have heard great things about blogengine.net. Is there a way I
can import all my wordpress content into it?
Any help would be greatly appreciated! cach chon gach xay nha https://nhalouis.com/co-phai-ban-dang-ban-khoan-gach-xay-nha-loai-nao-tot.html
토토사이트
Great article.
Gratis V Bucks
I like the helpful info you supply on your articles. I will bookmark your weblog and check again right here frequently.
I am moderately certain I’ll learn lots of
new stuff proper here! Best of luck for the following!
토토사이트
I absolutely love your blog.. Very nice colors & theme.
Did you make this website yourself? Please reply
back as I’m attempting to create my own site and want to learn where
you got this from or just what the theme is called. Thank you!
blue cave tour from split
whoah this weblog is great i love reading your articles.
Stay up the great work! You understand, many persons are looking around for this info, you can aid them greatly.
토토사이트
Hey there I am so glad I found your site, I really found
you by error, while I was looking on Bing for something else, Regardless I am here now and would
just like to say thank you for a incredible post and a all
round interesting blog (I also love the theme/design), I don’t
have time to go through it all at the minute but I have
saved it and also added your RSS feeds, so when I have time I will be back to read more,
Please do keep up the fantastic jo.
Möbelspedition
You made some first rate factors there. I seemed on the internet for the issue and located most people will go together with together with your website.
토토사이트
I love what you guys are usually up too. This sort of clever work and coverage!
Keep up the very good works guys I’ve incorporated you guys to my own blogroll.
토토사이트
Hi would you mind sharing which blog platform you’re using?
I’m looking to start my own blog in the near future but I’m having a tough time
choosing between BlogEngine/Wordpress/B2evolution and Drupal.
The reason I ask is because your design seems different then most blogs and I’m looking for something
completely unique. P.S My apologies for getting off-topic
but I had to ask!
토토사이트
Hmm is anyone else experiencing problems with the pictures on this blog loading?
I’m trying to figure out if its a problem on my end or if it’s the blog.
Any suggestions would be greatly appreciated.
토토사이트
Hi! I’ve been following your site for a long time now and
finally got the bravery to go ahead and give you a shout out
from Huffman Tx! Just wanted to say keep up the good work!
free Robux
Neat blog! Is your theme custom made or did you download it from somewhere?
A theme like yours with a few simple tweeks would really make
my blog shine. Please let me know where you got your theme.
Appreciate it
토토사이트
My brother suggested I might like this blog. He was entirely right.
This post actually made my day. You cann’t imagine just how
much time I had spent for this information! Thanks!
https://nhalouis.com/ngam-can-nha-ong-3-tang-dep-man-voi-chi-phi-tiet-kiem-html.html
Heya! I just wanted to ask if you ever have any trouble with hackers?
My last blog (wordpress) was hacked and I ended up losing several weeks of hard
work due to no backup. Do you have any solutions to prevent hackers?
mau nha ong 3 tang dep, mau nha ong 3 tang, thiet
ke nha ong dep 3 tang, nha dep 40m2 tinh te, mau nha 2 tang 40m2, nha 40m2 dep, mau nha 40m2 https://nhalouis.com/ngam-can-nha-ong-3-tang-dep-man-voi-chi-phi-tiet-kiem-html.html
asksylphoflight.tumblr.com sling tv
I constantly spent my half an hour to read this weblog’s
content every day along with a cup of coffee.
Virginia furniture installation
hello!,I love your writing very a lot! share we be in contact more approximately your article on AOL? I need a specialist in this house to unravel my problem. Maybe that is you! Having a look ahead to look you.
Balance Natural Wellness
Magnificent beat ! I would like to apprentice while you amend your site,
how can i subscribe for a blog web site? The account aided
me a acceptable deal. I had been tiny bit acquainted of
this your broadcast offered bright clear concept
Golden Globes 2020
Hello there! This article couldn’t be written any better!
Going through this article reminds me of my previous roommate!
He constantly kept preaching about this. I’ll send this post to him.
Fairly certain he’ll have a good read. Many thanks for sharing!
Balance Natural Wellness
Saved as a favorite, I love your website!
dewa poker
It is perfect time to make some plans for the future and
it is time to be happy. I have read this post and if I could I want to
suggest you few interesting things or suggestions. Perhaps you
could write next articles referring to this article.
I wish to read more things about it!
SMV
I read this post fully concerning the resemblance of latest and previous technologies,
it’s amazing article.
Extenze
Incredible this is a helpful site. http://bestrankings2020.com/extenze.html
like this
As soon as I observed this website I went on reddit to share some of the love with them.
you can try here
Hey! I know this is kinda off topic however , I’d figured I’d ask. Would you be interested in trading links or maybe guest authoring a blog article or vice-versa? My blog discusses a lot of the same topics as yours and I believe we could greatly benefit from each other. If you’re interested feel free to send me an e-mail. I look forward to hearing from you! Fantastic blog by the way!
Judson Arnell
Just desire to say your article is as astonishing. The clearness in your publish is simply spectacular and i could assume you’re an expert on this subject. Fine along with your permission allow me to snatch your RSS feed to stay up to date with approaching post. Thanks one million and please continue the rewarding work.
torobravos watches
If you want to obtain a good deal from this paragraph then you have to apply these techniques to your won website.
nba4live
I have recently started a web site, the info you offer on this website has helped me greatly. Thanks for all of your time & work.
latest cricket news
One thing is one of the most typical incentives for applying your cards is a cash-back or maybe rebate supply. Generally, you’ll have access to 1-5% back upon various purchases. Depending on the credit cards, you may get 1% again on most acquisitions, and 5% back again on purchases made on convenience stores, filling stations, grocery stores in addition to ‘member merchants’.
Sky Scannings
I used to be able to find good information from your blog articles.
best cbd gummies
Great information. Lucky me I discovered your website by chance (stumbleupon). I’ve saved it for later!
sling tv
This paragraph presents clear idea for the
new viewers of blogging, that genuinely how to do blogging and site-building.
Watch Jav Free HD
Actually no matter if someone doesn’t be aware of afterward its
up to other people that they will help, so here it happens.
jrbola.com
I constantly spent my half an hour to read this webpage’s articles every day along with a mug of coffee.
Casino Online
It’s really a nice and useful piece of information. I am satisfied that you just shared this
helpful info with us. Please stay us up to date like this.
Thank you for sharing.
instagram takipci hilesi
instagram takipci hilesi aracımız ile takipçi sayınızı yükseltebilirsiniz.
Bu aracımız sizlere özel ücretsiz bir şekilde çalışmaktadır.
Takipçi hilesi yaparak instagram da tanınmış bir kişi olmak artık çok basit.!
Instagram Beğeni Hilesi
Instagram beğeni arttırma hilesi yaparak instagram’da bulunan gönderilerinize beğeni gönderebilirsiniz.
instagram beğeni hilesi aracımız sizlere özel ücretsiz olarak çalışmaktadır.
Video Görüntülenme Hilesi
İnstagram videolarınıza görüntüleme yaptırabilirsiniz.
Videolarınızın görüntülenme sayısı hızlı bir şekilde artar.
Video Görüntülenme Hilesi ile
Instagram Unfollow Yapma
İnstagramda sizi takip etmeyen kullanıcıları tespit edip,
takibi bırakabilirsiniz. Bu hizmetimiz de ücretsiz. Sadece giriş yapmanız yeterli.
İnstagram Takipçi Hilesi Nasıl Kullanılır?
Ücretsiz instagram takipçi hilesi, instagram beğeni hilesi, instagram canlı yayın ve hikaye hilelerinizi platformumuzda
bulabilirsiniz. İnstagram takipçi hilesi sistemimizden her
saat +200 kredi kazanabilirsiniz. Tamamı yüzde yüz gerçek kullanıcılardan olup bot hesaplarımız bulunmamaktadır.
İnstagram takipçi hilesi ve beğeni özelliğini kullanarak hızlı bir şekilde keşfet olarak adlandırılan bölüme düşebilirsiniz.
Üstelik tamamı ücretsiz.
Mario Perez
Enjoyed examining this, very good stuff, appreciate it. “All of our dreams can come true — if we have the courage to pursue them.” by Walt Disney.
Layarkaca21 Download
You have made some really good points there. I checked on the web to learn more about the issue and found most people will go along with your views on this site.
sling tv
It’s difficult to find educated people in this particular topic, however, you sound like you know what you’re talking about!
Thanks
pressure washing services maole ridge
Sweet blog! I found it while browsing on Yahoo News.
Do you have any suggestions on how to get listed in Yahoo News?
I’ve been trying for a while but I never seem to get there!
Many thanks
gutter repair
Undeniably believe that which you said. Your favorite justification appeared to be
on the internet the easiest thing to be aware of. I say to you, I certainly get irked while people consider worries that
they just do not know about. You managed to hit
the nail upon the top as well as defined out the whole thing without
having side effect , people could take a signal. Will likely be back to get more.
Thanks
Tubidy MP3
Great info. Lucky me I found your website by chance (stumbleupon).
I’ve bookmarked it for later!
kissanime
Thank you for the auspicious writeup. It in fact was a amusement account it.
Look advanced to more added agreeable from you!
By the way, how can we communicate?
watch free anime
Hello, all is going sound here and ofcourse every one is sharing data, that’s genuinely
excellent, keep up writing.
hacklink cialis
hacklink satın al cialis fiyat viagra.
window cleaning services
When I originally commented I clicked the “Notify me when new comments are added” checkbox and now each time a comment is added I get four e-mails with the same
comment. Is there any way you can remove me from that service?
Thank you!
window cleaning services maole ridge
Heya are using WordPress for your site platform?
I’m new to the blog world but I’m trying to get started and create my own. Do you need any html coding
knowledge to make your own blog? Any help would be greatly appreciated!
home cleaning services
If you would like to increase your familiarity just keep visiting this site and be updated with the latest information posted here.
gutter cleaning port coquitlam
Hey there! Do you know if they make any plugins to protect against hackers?
I’m kinda paranoid about losing everything I’ve worked hard on. Any
tips?
gutter cleaning
What’s up mates, its wonderful article on the topic of educationand completely defined, keep it up all
the time.
anime online
Nice post. I was checking constantly this weblog and I’m impressed!
Very helpful info particularly the remaining phase 🙂 I
take care of such info much. I used to be looking for this certain information for a long time.
Thank you and good luck.
eyelash extensions
I am regular reader, how are you everybody?
This piece of writing posted at this website is genuinely
pleasant.
free Robux Generator
Excellent post. I was checking constantly this blog and I’m impressed!
Extremely helpful information specially the last part :
) I care for such info much. I was looking for this particular information for a long time.
Thank you and best of luck.
gutter cleaning company
Way cool! Some extremely valid points! I appreciate you
penning this write-up and the rest of the site is also
very good.
11 news
Whats up very nice web site!! Man .. Beautiful .. Wonderful .. I will bookmark your blog and take the feeds also¡KI’m glad to find so many helpful information here within the publish, we want work out more techniques on this regard, thanks for sharing. . . . . .
anime online
I’ll immediately grab your rss as I can not find your email subscription link or newsletter service.
Do you’ve any? Kindly let me know so that I could subscribe.
Thanks.
office cleaning
I really like your blog.. very nice colors & theme. Did you make this website yourself
or did you hire someone to do it for you? Plz reply as I’m looking
to design my own blog and would like to find out where u got this from.
thanks a lot
pressure washing port moody
An impressive share! I’ve just forwarded this onto a
co-worker who was conducting a little research on this.
And he in fact bought me breakfast due to the fact that I found it for him…
lol. So let me reword this…. Thank YOU for the meal!!
But yeah, thanks for spending time to discuss this issue here on your website.
pressure washing coquitlam
Wonderful beat ! I wish to apprentice while you amend your website, how could i subscribe for a blog site?
The account helped me a acceptable deal. I had been a little bit acquainted of
this your broadcast offered bright clear concept
kissanime.ru
Hello! I’ve been following your weblog for some time now and finally got the courage to go ahead and give you a shout out from
Houston Tx! Just wanted to mention keep up the excellent job!
gutter cleaning services
Fantastic beat ! I would like to apprentice while you amend your website, how can i subscribe for a
blog website? The account aided me a acceptable deal.
I had been tiny bit acquainted of this your broadcast offered bright clear concept
gutter guards
Hello, Neat post. There’s an issue with your site
in web explorer, might check this? IE still is the marketplace leader and a good portion of other people will pass over your great writing due to this problem.
office cleaning
Everything is very open with a really clear clarification of the issues.
It was really informative. Your website is very useful.
Thanks for sharing!
bing news today
This design is steller! You certainly know how to keep a reader amused.
Between your wit and your videos, I was almost moved to start my own blog (well, almost…HaHa!)
Great job. I really enjoyed what you had to say, and more than that, how you presented it.
Too cool!
power washing services
Quality content is the key to invite the users to visit the web site, that’s what this site is providing.
watch free anime
If some one desires to be updated with most up-to-date technologies afterward
he must be pay a visit this website and be up to date everyday.
roof cleaning
Generally I do not read article on blogs, however I would like to say that this
write-up very compelled me to take a look at and do it!
Your writing taste has been surprised me. Thank you, quite great post.
cialis viagra
cialis fiyat hacklink index.
iptv test
iptv test denemek ücretsizdir.
Popcorn Makers
Nice post. I learn something totally new and
challenging on sites I stumbleupon every day. It’s always exciting
to read articles from other writers and use a little something from other sites.
ソフト闇金
I was wondering if you ever considered changing the layout of your blog?
Its very well written; I love what youve got to say.
But maybe you could a little more in the way of content so people could connect with
it better. Youve got an awful lot of text for only
having 1 or two pictures. Maybe you could
space it out better?
파워볼사이트
Since the admin of this website is working, no uncertainty
very shortly it will be renowned, due to its quality
contents.
fine art landscape photography
Great site. A lot of helpful info here. I’m sending it to a few buddies ans also sharing in delicious.
And naturally, thanks for your sweat!
Refacciones para maquinas de coser
Hi, I do think this is a great website. I stumbledupon it 😉 I am going to come back once again since I saved as a favorite it. Money and freedom is the greatest way to change, may you be rich and continue to help others.
Jam Waktu Sholat
Good day! I know this is kinda off topic but I was wondering if you knew where I could get a captcha plugin for my comment form? I’m using the same blog platform as yours and I’m having problems finding one? Thanks a lot!
ソフト闇金
Thanks , I’ve recently been searching for info about
this subject for a long time and yours is the greatest I have came upon till now.
However, what in regards to the conclusion? Are you certain about the source?
rent a car timisoara
Hi there, this weekend is pleasant designed for me, as this moment i am reading this
enormous educational article here at my residence.
photography art for sale
What’s up to all, the contents existing at this site are actually amazing for people experience,
well, keep up the nice work fellows.
free Robux
You are so awesome! I do not suppose I’ve truly
read through a single thing like this before. So great to discover someone
with a few genuine thoughts on this subject matter.
Really.. many thanks for starting this up. This
web site is one thing that is required on the web, someone with some originality!
The kibo code review
I’ll immediately grasp your rss as I can not in finding your email subscription hyperlink or newsletter service.
Do you’ve any? Kindly let me know so that I could subscribe.
Thanks.
free google play codes 2020 Generator
You could definitely see your expertise in the article you write.
The world hopes for even more passionate writers like you who aren’t afraid to mention how they believe.
Always follow your heart.
Brother Sewing Machines
I every time used to study piece of writing in news papers but now as I am a user of
web therefore from now I am using net for articles or reviews, thanks to web.
파워볼사이트
It’s remarkable for me to have a site, which is beneficial
for my experience. thanks admin
fine art landscape photography
Good post however I was wanting to know if you could write
a litte more on this topic? I’d be very grateful if
you could elaborate a little bit more. Kudos!
image source
I do agree with all the ideas you’ve presented in your post. They are very convincing and will definitely work. Still, the posts are too short for beginners. Could you please extend them a bit from next time? Thanks for the post.
web site
web site index.
composite decking
Thank you for the sensible critique. Me and my neighbor were just preparing to do a little research on this. We got a grab a book from our local library but I think I learned more clear from this post. I am very glad to see such great information being shared freely out there.
cialis viagra
cialis fiyat hacklink satın al
Lynn
I was suggested this blog by my cousin. I am not sure whether this post is written by him as nobody else know such detailed about my trouble.
You are incredible! Thanks!
Prediksi HK Malam Ini
Generally I do not read article on blogs, but I wish to say that
this write-up very pressured me to try and do so! Your writing taste has been amazed me.
Thank you, quite great post.
تعمیرات تخصصی موبایل
Great article! This is the kind of info that are
meant to be shared across the web. Disgrace on the search engines for no
longer positioning this put up higher! Come on over and consult with my web site .
Thank you =)
Dabbing Vegeta Grey Camo Hoodie
I’m not that much of a internet reader to
be honest but your blogs really nice, keep it up!
I’ll go ahead and bookmark your site to come back later. All the best
Super Saiyan God Super Saiyan Vegito Dragon Ball Z Hoodie
Hello There. I found your blog using msn. This is a very well written article.
I will be sure to bookmark it and return to read more of your useful info.
Thanks for the post. I’ll definitely return.
Bed assembly service
We’re a group of volunteers and opening a new scheme in our community. Your site provided us with valuable info to work on. You’ve done an impressive job and our whole community will be grateful to you.
Efrain Lenny
It.s goods to come across a blog every once in al while that isn’t the same unwanted rehashed information. Excellent read! I’ve saved your site and I’m adding your RSS feeds to my Google account.
tuzla nakliyat
Tuzla nakliye Taşınma sırasında evinizdeki her
eşya için tek tek ilgilenecek olan tecrübeli ekip arkadaşlarımız sayesinde, sizler elinizi hiçbir işe sürmeden taşınma gerçekleştirebileceksiniz.
Firmamız Tuzla nakliyat hizmetimiz sırasında montaj,
elektrik, marangoz ekibimiz eşliğinde bulunduğunuz
yerden istediğiniz yere eşyalarınızı taşımaktayız.
tuzla nakliyat Ekibimizde ihtiyaç duyulabilecek her alandan usta mevcut olmasından dolayı her konuda sorunsuz bir taşınma işlemi gerçekleştirmiş oluruz.
Şehirler arası nakliyat hizmetinde günübirlik
sevkiyatlarımız vardır. Profesyonel ekip arkadaşlarımız eşyalarınızı
taşımaya hazır hale getirirken balonlu rulo, köpük malzeme kullanarak paketleme yapıp zarar
görmesini engellemektedirler. Kaliteli hizmetler bütünü ile İstanbul gaziantep nakliyat arası taşımacılık hizmetimizde mevcuttur.
denver moving companies
I was curious if you ever considered changing the layout of your website? Its very well written; I love what youve got to say. But maybe you could a little more in the way of content so people could connect with it better. Youve got an awful lot of text for only having one or two images. Maybe you could space it out better?
Elektrikli süpürge modelleri
Elektrikli Süpürge Alırken Nelere Dikkat Edilmelidir?
Elektrikli süpürge modelleri evin temizlik açısından en önemli gereçlerinden birisi hatta
en önemlisidir diyebiliriz. Pratik kullanışlı ve güçlü bir makine hayatınızı kurtarabilir.
Bu içeriğimizde 2020’nin en iyi elektrikli süpürge modellerini inceleyeceğiz fakat öncelikle elektrikli süpürge alırken nelere dikkat etmeniz gerektiğinden bahsetmek istiyoruz.
Watt Gücü
Elektrikli süpürge modelleri Watt gücü bir makinenin iyi performansının göstergesi değildir.
Güç daha çok kullanılan elektriğin miktarı ile ilgilidir.
Güç kavramı ve performans her zaman karıştırılmaktadır.
Oysa Watt ve airwatt elektrikli süpürgenin toz çekim gücünü değil motor gücünü göstermektedir.
Bu sebeple elektrikli süpürge alırken çekim gücüne dikkat etmak gerekmektedir.
aliexpress alışveriş
aliexpress alışveriş yapmak, merkezi Çin’de bulunan ve The Alibaba
Group’un sahibi olduğu popüler bir perakende web sitesidir.
Aynı zamanda Çin’deki küçük işletmelerin uluslararası müşterilere doğrudan ürün satmalarına odaklanan bir e-Ticaret platformudur.
Site yalnızca uluslararası satış için kurulmuş olup Çin Halk Cumhuriyeti vatandaşlarına ürün satışı bulunmamaktadır.
aliexpress alışveriş, ürünleri doğrudan bireysel müşterilere sattığı için Amazon veya eBay gibi Amerikalı şirketlere
benzemektedir. Firmanın Amazon’dan en büyük farkı tamamen 3.parti satıcıları için kurulmuş bir
platform olmasıdır. Amazon ise kendi ürünlerini ve
diğer satıcıların ürün satışına izin vermektedir.
AliExpress Üzerinden 10 Adımda Kolay Alışveriş
Çin merkezli online alışveriş platformu Aliexpress, neredeyse
ihtiyacınız olan tüm ürünleri içerisinde barındırmaktadır.
Son derece ucuz ve kaliteli ürünlerin satışa sunulduğu Aliexpress.com üzerinden alışveriş mi yapmak
istiyorsunuz? Bu konuda ilk kez deneyim yaşayacak kullanıcılar için Aliexpress üzerinden kolay ve güvenilir alışveriş yapmanın 10
kesin yolunu açıklıyoruz. Aliexpress üzerinden alışveriş yapmanın 10 kolay yolu!
http://fires.iebalearics.org/index.php/component/k2/itemlist/user/649692
Hi there! Quick question that’s completely off topic.
Do you know how to make your site mobile friendly? My blog looks weird when viewing from my apple iphone.
I’m trying to find a template or plugin that might be able to correct this issue.
If you have any recommendations, please share. Many thanks!
Stuart
There’s definately a lot to learn about this topic.
I really like all the points you’ve made.
www.sapulidimedia.com
I just like the valuable information you provide in your articles.
I’ll bookmark your weblog and check once more right here regularly.
I am rather sure I will learn a lot of new stuff
right here! Good luck for the next!
CBD Gummies
you are truly a good webmaster. The website loading velocity is amazing.
It sort of feels that you’re doing any unique trick.
Furthermore, The contents are masterpiece. you have performed a excellent job on this topic!
CBD Oil
Woah! I’m really digging the template/theme of this site.
It’s simple, yet effective. A lot of times it’s very difficult to get that “perfect balance”
between user friendliness and visual appeal. I must say you have done a
excellent job with this. Also, the blog loads extremely quick for me on Safari.
Exceptional Blog!
Buy CBD Oil
I got this site from my friend who shared with me about this web page and
at the moment this time I am browsing this website and reading very
informative articles at this time.
http://www.deterrainestates.com/?option=com_k2&view=itemlist&task=user&id=34265
I think this is among the such a lot significant info for me.
And i’m glad studying your article. But should remark on few common things, The site style is wonderful, the articles is in point
of fact nice : D. Excellent activity, cheers
Buy CBD Oil UK
Do you mind if I quote a couple of your posts as long
as I provide credit and sources back to your weblog?
My blog site is in the very same area of interest
as yours and my users would truly benefit from some of the
information you present here. Please let me know if this alright with you.
Cheers!
Best CBD Oil
It’s enormous that you are getting ideas from this piece of writing as
well as from our discussion made here.
www.travelsolution.info
If you are going for finest contents like me, simply pay a visit this web site everyday since it offers feature contents, thanks
Merrill
Attractive section of content. I simply stumbled upon your site
and in accession capital to claim that I acquire in fact enjoyed account your blog posts.
Any way I will be subscribing on your feeds or even I success you get right of entry to constantly rapidly.
Buy CBD Oil UK
It’s fantastic that you are getting ideas from this paragraph as well as
from our argument made here.
Buy CBD Oil UK
Hey I know this is off topic but I was wondering if you knew of any
widgets I could add to my blog that automatically tweet my
newest twitter updates. I’ve been looking for a plug-in like
this for quite some time and was hoping maybe you would have some experience with something like this.
Please let me know if you run into anything.
I truly enjoy reading your blog and I look forward to your new updates.
istanbul köpek eğitim
PROFESYONEL KÖPEK EĞİTİMİ
köpek eğitim merkezi konusunda profesyonel bir eğitim kadrosuna sahibiz.
Genel olarak İstanbul Köpek Eğitimi bölgesinden talepler alsakta ülkenin tamamına hizmet sunabilecek alt
yapıya ve ekibe sahibiz. Köpek Eğitim’i konusunda ayrıntılı bilgi almak için bizimle iletişime geçebilirsiniz.
İstanbul Köpek Eğitimi
istanbul köpek eğitimi tesisimiz Pet Okulu pek çok istanbulda yaşayan hayvan sever tarafından tercih ediliyor.
Köpek eğitimleri, Köpek Pansiyonu gibi eğitimler veriyoruz ve verdiğimiz hizmetlerden aldığımız geri dönüşlerin tamamı olumlu olduğu için işimizde
iyi olduğumuzu düşünüyoruz. Bizlerde en az sizler kadar köpek ve hayvan dostu insanlarız bundan dolayı
bu meslek bize işten ziyade, eğlenceli vakitler sunuyor.
Köpek eğitimlerimiz ile alakalı ayrıntılı bilgi almak için iletişime geçmenizi
öneriyoruz.
CBD Gummies
Very energetic blog, I enjoyed that bit. Will there be a part 2?
CBD Anxiety
Link exchange is nothing else except it is only placing the
other person’s website link on your page at proper place and other person will also do similar in support
of you.
http://ingiarethaibinh.com.vn/?option=com_k2&view=itemlist&task=user&id=436000
Pretty nice post. I just stumbled upon your weblog and wished to say that I’ve truly enjoyed browsing your blog posts.
In any case I will be subscribing to your feed and I hope you
write again very soon!
http://turbomaxturbos.com/?option=com_k2&view=itemlist&task=user&id=19925
Superb site you have here but I was wondering if you knew of any user discussion forums that
cover the same topics talked about in this article? I’d really love to be a part of
online community where I can get comments from other knowledgeable individuals that share the same interest.
If you have any suggestions, please let me know. Thanks!
alu clad windows review
Good write-up, I¡¦m normal visitor of one¡¦s website, maintain up the excellent operate, and It’s going to be a regular visitor for a lengthy time.
ดู หนัง ออนไลน์ฟรี
Hello mates, pleasant post and pleasant urging commented at
this place, I am actually enjoying by these.
http://demo.merccentre.com/?option=com_k2&view=itemlist&task=user&id=73978
Hi there, I discovered your website by means of Google at the same time as looking for a comparable
subject, your site came up, it appears to be like great.
I have bookmarked it in my google bookmarks.
Hello there, simply become alert to your blog through Google, and located that it’s truly informative.
I’m gonna watch out for brussels. I’ll be grateful if
you proceed this in future. Many people will probably be benefited
from your writing. Cheers!
Vonnie
Article writing is also a excitement, if you be familiar with
afterward you can write otherwise it is complicated to
write.
sdsn.develop.cinfores.com
Ahaa, its good discussion regarding this piece of writing
here at this web site, I have read all that, so now me also
commenting here.
Bryon
Your means of telling all in this post is in fact good, every one can simply know it, Thanks a lot.
DC furniture installers
With havin so much content do you ever run into any problems of plagorism or copyright violation? My website has a lot of completely unique content I’ve either created myself or outsourced but it seems a lot of it is popping it up all over the web without my authorization. Do you know any methods to help stop content from being stolen? I’d truly appreciate it.
CBD Gummies
If some one wishes expert view concerning running a blog afterward i suggest him/her to
pay a visit this blog, Keep up the fastidious work.
Buy CBD Oil UK
I every time used to read piece of writing in news papers but now as I am a user of net so from now I am using
net for articles or reviews, thanks to web.
CBD Gummies
Thank you a bunch for sharing this with all people you really understand what you’re talking about!
Bookmarked. Please also seek advice from my web site =).
We will have a link alternate contract between us
demo.merccentre.com
Hello There. I found your blog using msn. This is a very well
written article. I’ll be sure to bookmark it and return to read more of your
useful info. Thanks for the post. I will certainly comeback.
CBD Oil
I feel that is one of the so much significant info for me.
And i’m glad studying your article. However wanna commentary
on some general issues, The site taste is ideal, the articles is in point of fact nice :
D. Excellent job, cheers
CBD Gummies
Hello, its pleasant post concerning media print, we all be
aware of media is a great source of data.
CBD Gummies
This blog was… how do you say it? Relevant!!
Finally I’ve found something which helped me. Thank you!
Makayla
Right here is the perfect website for anyone who
wishes to understand this topic. You know so much its almost hard to argue with you (not that I personally would want to…HaHa).
You certainly put a brand new spin on a topic which has been discussed for many years.
Excellent stuff, just excellent!
Free V Bucks 2020 Generator
Post writing is also a fun, if you know afterward you can write otherwise it
is complex to write.
Lourdes
This is very attention-grabbing, You are a very
professional blogger. I have joined your rss feed and look forward to searching for extra of your wonderful
post. Additionally, I have shared your web site in my social networks
how to remove my information from the internet
I’ll immediately clutch your rss feed as I
can not to find your email subscription hyperlink
or e-newsletter service. Do you’ve any? Kindly allow me know in order that I may subscribe.
Thanks.
Buy CBD Oil UK
Having read this I thought it was very enlightening.
I appreciate you finding the time and effort to put this informative article together.
I once again find myself personally spending a significant amount of time both reading and commenting.
But so what, it was still worthwhile!
Ted
It’s amazing for me to have a web site, which is valuable in support of my know-how.
thanks admin
CBD Gummies
These are in fact wonderful ideas in regarding blogging.
You have touched some pleasant points here. Any way
keep up wrinting.
http://johndouglas.club
Hello, always i used to check web site posts here in the early hours in the dawn,
as i enjoy to gain knowledge of more and more.
Best CBD Oil
Hey there! I just wanted to ask if you ever have any issues with hackers?
My last blog (wordpress) was hacked and I ended up losing a
few months of hard work due to no backup. Do you have any solutions to protect against hackers?
Best CBD Oil
Wow, this post is nice, my sister is analyzing these things, thus I am going
to convey her.
Buy CBD Oil UK
I think that everything published was very reasonable.
But, what about this? what if you composed a catchier post
title? I ain’t suggesting your information is not
good., however what if you added a headline that makes people desire more?
I mean Enrollment, Tuition, and Discount Rate: The Sweet Briar
Story, Part 3 – Unsolicited Guru is kinda vanilla.
You could peek at Yahoo’s front page and see how they
create article headlines to get viewers interested. You might
add a video or a related picture or two to get people interested about everything’ve got to say.
Just my opinion, it would bring your posts a little bit
more interesting.
CBD Gummies
Hello colleagues, its great piece of writing concerning tutoringand entirely defined, keep it up all the time.
Isla
Hi, constantly i used to check webpage posts here early in the daylight,
since i love to find out more and more.
http://chipil.com.mx/
I’ve read a few excellent stuff here. Certainly worth bookmarking for revisiting.
I surprise how a lot effort you put to create this kind of excellent informative site.
Savannah
Remarkable! Its actually awesome post, I have got much clear idea concerning from this post.
CBD Benefits
Fastidious replies in return of this question with genuine arguments
and telling everything regarding that.
Buy CBD Oil UK
As the admin of this site is working, no uncertainty very quickly it will be well-known, due to its
quality contents.
Buy CBD Oil UK
I go to see day-to-day some web sites and websites to read articles, however this webpage presents quality based content.
CBD Oil for Sale
Sweet blog! I found it while surfing around on Yahoo News.
Do you have any tips on how to get listed in Yahoo News?
I’ve been trying for a while but I never seem to get there!
Many thanks
Best CBD Oil
Quality articles or reviews is the crucial to attract the visitors to
visit the web page, that’s what this web page is providing.
CBD Gummies
What’s up colleagues, how is all, and what you would like to say about this post, in my view its genuinely awesome in support
of me.
http://spargelgut-meyer.de/
Hi there, I enjoy reading through your article post. I like to write
a little comment to support you.
lawyer
Aw, this was an incredibly good post. Finding the time and actual
effort to create a very good article… but what can I say… I hesitate a whole lot and don’t manage to
get nearly anything done.
free Robux Generator 2020
It’s enormous that you are getting thoughts from this paragraph as well as from
our discussion made at this time.
vrbo management
I’ve been browsing online greater than 3 hours as of late, yet I by no means found any attention-grabbing article like yours. It’s pretty worth enough for me. In my opinion, if all web owners and bloggers made good content as you probably did, the internet will probably be much more helpful than ever before.
crew hotel
It’s not my first time to visit this website, i am browsing this web page dailly and obtain fastidious facts from here every day.
강남안마
Hello! I know this is kinda off topic however , I’d figured I’d ask.
Would you be interested in trading links or maybe guest authoring a blog article or
vice-versa? My blog discusses a lot of the
same subjects as yours and I feel we could greatly benefit from each other.
If you might be interested feel free to send me an email.
I look forward to hearing from you! Terrific blog by the
way!
buy kush herbal incense online
My partner and I stumbled over here coming from a different website and thought I may as well check things out.
I like what I see so i am just following you. Look forward to going over your web page yet again.
Building is the process involving constructing a building or perhaps infrastructure
Do you mind if I quote a couple of your posts as long as I provide credit and sources back to your weblog?
My blog site is in the very same area of interest as yours
and my users would certainly benefit from some of the information you present here.
Please let me know if this alright with you.
Thank you! Design is the process associated with constructing a building or perhaps infrastructure
Building differs from manufacturing throughout that manufacturing typically requires mass production of related items without a
specified purchaser, while construction frequently takes place on area for
a known consumer.[2] Construction while an industry comprises half a
dozen to nine percent from the gross domestic product associated with developed countries.[3] Construction starts with setting up, design, and financing; this continues until the task is built and all set for us.
Thiết kế biệt thự tân cổ điển – nhalouis
70A Tô Hiến Thành, Phường 15, Quận 10, Tp Hồ Chí Minh, Phường 15, Hồ
Chí Minh #nhalouis https://nhalouis.com/bao-gia-xay-dung-phan-tho.html
SEX TOYS EDINBURGH
This website was… how do you say it? Relevant!! Finally I’ve found something that
helped me. Appreciate it!
https://nhalouis.com/kinh-nghiem-xay-nha-tro-cho-thue-nhu-nao-la-hieu-qua.html
I read this paragraph fully concerning the difference of newest
and previous technologies, it’s awesome article.
We certainly have several rooms available. Completely furnished
with own toilet. Micro and fridge involved.
We also have wi-fi compatability. We are found in Lynwood by the 105 frwy,
where the metrolines are usually. To downtown LA all of us are just 20 minutes
drive, to LAX all of us are 15 min commute. There are plenty regarding restaurants and shops inside a ten minute go walking.
We also have car parking onsite.
Also due in order to constantly changing availability
that is better to subject matter me first. When you obtain my phone number make sure you text me if
a person have any questions. 70A Tô Hiến Thành, Phường 15, Quận 10, Tp Hồ Chí Minh,
Phường 15, Hồ Chí Minh #nhalouis -Thiết kế biệt thự tân cổ điển – nhalouis https://nhalouis.com/kinh-nghiem-xay-nha-tro-cho-thue-nhu-nao-la-hieu-qua.html
aircrew accommodations
It’s truly very complicated in this busy life to listen news on TV, so I just
use the web for that reason, and get the hottest information.
airline crew hotels
Thank you for any other great article. The place
else could anyone get that type of info in such a perfect method of writing?
I’ve a presentation next week, and I am at the search for such information.
Crew Mobile Application
bookmarked!!, I love your web site!
강남안마
Every weekend i used to go to see this website, as i want
enjoyment, as this this website conations in fact fastidious funny material too.
Free V Bucks 2020 Generator
Please let me know if you’re looking for a writer for your blog.
You have some really good articles and I think I
would be a good asset. If you ever want to take some of the load off, I’d really like to
write some material for your blog in exchange for a link back to mine.
Please shoot me an e-mail if interested. Thanks!
browser based app
Hey I know this is off topic but I was wondering if you knew of
any widgets I could add to my blog that automatically tweet my
newest twitter updates. I’ve been looking for a plug-in like this
for quite some time and was hoping maybe you would have some experience with something like this.
Please let me know if you run into anything.
I truly enjoy reading your blog and I look forward to your new
updates.
강남안마
I visited various web pages except the audio feature for audio songs current at this website is really superb.
청주출장마사지
I like the valuable info you supply for your articles.
I’ll bookmark your blog and take a look at again here frequently.
I’m fairly sure I will learn lots of new stuff
proper right here! Best of luck for the next!
Invoice Reconciliation
You really make it seem so easy with your presentation but I find this matter to be actually something that I think I would never understand.
It seems too complicated and extremely broad for me. I am looking forward for your next post, I will try to get the hang of it!
Hotel Accommodations
I am truly thankful to the owner of this web site who has shared this great piece of writing at at this
place.
Virtual Voucher Management
You are so awesome! I don’t believe I’ve truly read something like that before.
So great to find somebody with some unique thoughts on this issue.
Seriously.. many thanks for starting this up.
This web site is something that’s needed on the internet,
someone with a little originality!
crew hotels
Very good post. I absolutely appreciate this website.
Continue the good work!
Distressed Passenger Solution
Excellent goods from you, man. I’ve be mindful
your stuff prior to and you’re just extremely magnificent.
I actually like what you have acquired here, really
like what you’re stating and the way in which in which you are saying it.
You make it entertaining and you continue to care for to stay it smart.
I can’t wait to learn far more from you. This is really
a great website.
Locate peace and rejuvenate along in your intimate non-public villa, simply perfect for a passionate retreat
Thanks on your marvelous posting! I certainly enjoyed reading it,
you could be a great author. I will remember to bookmark your blog and may come back
sometime soon. I want to encourage you to ultimately
continue your great work, have a nice evening!
Discover peace and rejuvenate along in your intimate
personal villa, simply perfect for a passionate retreat
A peaceful and even intimate retreat. This beautiful space
is the ideal place to relax in addition to enjoy time away with each other from a hectic lifestyle.
Each villa includes distinct living and study pavilions and elegantly fitted together with Maya inspired designs.
Unwind in the heated pool area or maybe the outdoor whirlpool baths enabling
all the pressure go. 70A Tô Hiến Thành, Phường 15, Quận 10, Tp Hồ Chí Minh, Phường
15, Hồ Chí Minh #nhalouis -Thiết kế biệt thự tân cổ điển – nhalouis -yelp.com https://nhalouis.com/phong-khach-dep-cho-mau-nha-cap-4.html
End to End Airline Solution Technology
Oh my goodness! Awesome article dude! Thank you so much, However I am going through issues with your RSS.
I don’t know the reason why I am unable to subscribe to it.
Is there anyone else having similar RSS problems? Anybody who knows the
solution can you kindly respond? Thanx!!
Airline Crew Technology
Outstanding quest there. What occurred after? Take care!
Judi Casino
Heya i am for the first time here. I came across this board and I
to find It really useful & it helped me out much. I’m hoping to
offer something again and help others like you aided me.
Maryland furniture installation
I see something really special in this web site.
Coin news
My coder is trying to convince me to move to .net from PHP.
I have always disliked the idea because of the expenses.
But he’s tryiong none the less. I’ve been using WordPress on several websites for about a year
and am anxious about switching to another platform. I have heard
excellent things about blogengine.net. Is there a way I can import all my
wordpress posts into it? Any help would be really appreciated!
Culture
Very nice post. I just stumbled upon your weblog and wanted to say that I’ve really enjoyed browsing your blog posts. After all I will be subscribing to your rss feed and I hope you write again very soon!
phentermine kaufen
You can certainly see your enthusiasm within the paintings you write. The sector hopes for even more passionate writers like you who are not afraid to mention how they believe. At all times follow your heart.
web page
hi!,I like your writing very so much! proportion we keep in touch more approximately your
article on AOL? I require an expert in this space to solve my problem.
Maybe that is you! Looking ahead to see you.
anabolika kaufen
I have been reading out a few of your stories and it’s pretty good stuff. I will make sure to bookmark your blog.
https://nhalouis.com/10-mau-phong-ngu-dep-duoi-9m2-ma-ai-cung.html
Hmm is anyone else encountering problems with the pictures on this blog loading?
I’m trying to determine if its a problem on my end or if it’s the blog.
Any responses would be greatly appreciated. 45 beautiful bedrooms with fantastic ideas to
steal
Check out out these inspiring coloring and pattern combinations, stunning furniture ideas and smart finishing touches.
Take the look at these lovely bedrooms with stylish coloring and pattern combinations, beautiful furniture ideas and smart finishing touches.
If if you’re searching for inspiration, appear no further!
With fityfive beautiful bedrooms designs, will be certainly a room for every person. Upgrade your cozy goes out with these ideas that
can allow you to want to enjoyment. 0909 50 3838 -Thiết kế biệt thự tân cổ điển – nhalouis -yelp.com https://nhalouis.com/10-mau-phong-ngu-dep-duoi-9m2-ma-ai-cung.html
DC Furniture assembly
I like this web blog so much, saved to bookmarks. “To hold a pen is to be at war.” by Francois Marie Arouet Voltaire.
https://nhalouis.com/quy-trinh-giam-sat-thi-cong-xay-dung-can-luu-y-nhung-dieu-nao.html
Hello I am so grateful I found your webpage, I really found
you by accident, while I was searching on Bing for something else, Nonetheless I am here now and would just
like to say cheers for a fantastic post and a all round interesting
blog (I also love the theme/design), I don’t have time to
go through it all at the moment but I have saved it and
also added in your RSS feeds, so when I have
time I will be back to read much more, Please do keep up the superb jo.
About construction sites large in addition to small,
supervision has some sort of key role to enjoy in preventing accidents.
Standard supervisory functions include preparation and allocating work, producing decisions, monitoring performance
and even compliance, providing leadership plus building teamwork, and making sure workforce participation
The constructor is responsible for the look, construction and site oversight.
The builder shall make certain that the building is made and
constructed in agreement. Thiết kế biệt
thự tân cổ điển – nhalouis 70A Tô Hiến Thành, Phường 15,
Quận 10, Tp Hồ Chí Minh, Phường 15, Hồ Chí
Minh #nhalouis -0909 50 3838 https://nhalouis.com/quy-trinh-giam-sat-thi-cong-xay-dung-can-luu-y-nhung-dieu-nao.html
free Robux Generator
Great article.
GST Seva Kendra
Wow, fantastic weblog layout! How lengthy have you been running a blog for? you made running a blog look easy. The overall look of your web site is fantastic, as well as the content!
CBD Oil Benefits
Wow, awesome blog layout! How lengthy have you ever been running
a blog for? you made blogging glance easy. The overall glance of your web site is wonderful, let alone the
content!
Buy CBD Oil UK
Appreciate the recommendation. Will try it out.
바카라사이트-온라인바카라-카지노사이트
With havin so much content do you ever run into any issues of
plagorism or copyright violation? My website has a lot of exclusive content I’ve either created myself or outsourced but it looks like a lot of it is
popping it up all over the web without my permission. Do you know
any ways to help prevent content from being ripped off?
I’d certainly appreciate it.
토토사이트-안전놀이터-메이저놀이터
A fascinating discussion is worth comment. I do think that you
need to write more about this subject matter, it might not be a taboo matter
but generally folks don’t discuss such topics.
To the next! Best wishes!!
Best CBD Oil
It’s an remarkable piece of writing in favor of all the online visitors; they will take benefit from
it I am sure.
https://www.axiamedica.it/
I’m not sure where you are getting your info, but good topic.
I needs to spend some time learning much more or understanding more.
Thanks for great info I was looking for this information for my
mission.
hiralcaterers.com
WOW just what I was looking for. Came here by searching for Best CBD Oil
bedroom pocket door
Thanks , I have just been looking for information about this topic for ages and yours is the best I’ve discovered so far. But, what about the bottom line? Are you sure about the source?
Alina
Hey there! This post could not be written any better!
Reading this post reminds me of my previous room mate! He always kept chatting about this.
I will forward this write-up to him. Pretty sure he will have a good read.
Thank you for sharing!
Buy CBD Oil UK
Hey there! I know this is somewhat off topic but I was wondering which blog platform
are you using for this website? I’m getting fed up
of WordPress because I’ve had problems with hackers and I’m
looking at alternatives for another platform. I would be awesome if you could point me in the direction of a good platform.
Best CBD Oil
Incredible points. Great arguments. Keep up the amazing work.
CBD Oil
If some one needs to be updated with latest technologies then he must
be pay a visit this web site and be up to date everyday.
CBD Oil for Anxiety
Thank you for the auspicious writeup. It in fact was a amusement account it.
Look advanced to more added agreeable from you!
However, how can we communicate?
카지노사이트-온라인카지노-바카라사이트
This is very interesting, You’re a very skilled blogger.
I’ve joined your feed and look forward to seeking more of your wonderful post.
Also, I have shared your website in my social networks!
바카라사이트-온라인바카라-카지노사이트
I’ve learn several excellent stuff here. Definitely price bookmarking
for revisiting. I surprise how much effort you place to create the sort of excellent informative
website.
Aisha
You should be a part of a contest for one of the highest quality sites on the internet.
I am going to highly recommend this blog!
CBD Gummies
great submit, very informative. I ponder why the other
experts of this sector do not understand this. You should continue your writing.
I’m confident, you’ve a great readers’ base already!
바카라사이트-온라인바카라-카지노사이트
Valuable information. Lucky me I discovered your site by accident, and
I’m stunned why this twist of fate didn’t happened in advance!
I bookmarked it.
토토사이트-사설토토사이트-안전놀이터
Hi colleagues, how is all, and what you want to say on the topic
of this paragraph, in my view its genuinely amazing designed for me.
CBD Gummies
Hi, the whole thing is going nicely here and ofcourse every one is sharing data, that’s genuinely fine, keep
up writing.
inheritance
Amazing! Its in fact remarkable article, I
have got much clear idea regarding from this article.
banser.com.mx
Link exchange is nothing else but it is only placing the other person’s webpage link on your page at suitable place
and other person will also do similar in favor of you.
anabole steroide online kaufen
I’m still learning from you, while I’m trying to achieve my goals. I absolutely love reading everything that is posted on your blog.Keep the stories coming. I liked it!
web site
backlink data indexletme.
bettertrust
Excellent blog you have here but I was curious if you knew of any forums that cover the same topics talked about in this article? I’d really like to be a part of community where I can get advice from other knowledgeable people that share the same interest. If you have any recommendations, please let me know. Appreciate it!
pornjk
Hello there, I discovered your web site by way of Google at the same time as searching for a similar matter, your web site got here up, it seems to be good. I have bookmarked it in my google bookmarks.
tarot card spreads
Do you mind if I quote a couple of your articles as long as I provide credit
and sources back to your webpage? My website is in the exact
same area of interest as yours and my users would truly benefit from
a lot of the information you provide here. Please let me know if this
okay with you. Thanks a lot!
Best CBD Oil
It’s hard to find well-informed people on this topic, however, you sound like you
know what you’re talking about! Thanks
CBD Anxiety
What’s Going down i’m new to this, I stumbled upon this I have
discovered It positively useful and it has
aided me out loads. I am hoping to contribute & help other users like its helped me.
Good job.
peter lik for sale
This is the perfect site for anybody who wishes to find out about this
topic. You realize a whole lot its almost hard to argue with you
(not that I actually would want to…HaHa). You definitely
put a new spin on a subject which has been written about for a long time.
Excellent stuff, just great!
http://zeitstationen-mannheim.de/index.php/component/k2/itemlist/user/579342
My spouse and I stumbled over here by a different web address
and thought I should check things out. I like what I see so now i’m following
you. Look forward to exploring your web page repeatedly.
tarot decks
Hi there just wanted to give you a quick heads up and let you
know a few of the images aren’t loading properly.
I’m not sure why but I think its a linking issue.
I’ve tried it in two different browsers and both show the same results.
the kibo code
Pretty nice post. I just stumbled upon your weblog
and wished to say that I have really loved surfing around your blog posts.
In any case I’ll be subscribing on your rss feed
and I’m hoping you write again very soon!
ancient greek statues
Nice weblog right here! Additionally your web site so much up fast!
What web host are you the usage of? Can I am getting your affiliate
hyperlink in your host? I wish my site loaded up as fast as yours lol
Buy CBD Oil UK
It is not my first time to pay a quick visit this web page, i am browsing this website dailly and
obtain pleasant data from here every day.
CBD Gummies
If some one needs to be updated with most up-to-date technologies afterward he must be
pay a visit this site and be up to date daily.
1인샵
I seriously love your website.. Excellent colors & theme.
Did you develop this site yourself? Please reply back as I’m attempting
to create my own site and want to learn where you got this from or exactly what the theme is called.
Thank you!
sling tv
I think this is one of the most important info for me. And i’m
glad reading your article. But wanna observation on some
normal things, The website taste is perfect, the articles is in point of fact great :
D. Just right task, cheers
Best CBD Oil
My spouse and I stumbled over here different
web page and thought I should check things out.
I like what I see so now i am following you. Look forward to looking over your web page repeatedly.
http://advokat.co.me/?option=com_k2&view=itemlist&task=user&id=514970
Hi, i think that i saw you visited my weblog so i came to “return the favor”.I am trying
to find things to improve my site!I suppose its ok
to use a few of your ideas!!
CBD Gummies
wonderful points altogether, you simply gained a brand new reader.
What may you recommend in regards to your put up that
you simply made some days in the past? Any certain?
Buy CBD Oil
I loved as much as you will receive carried out right here.
The sketch is attractive, your authored material stylish.
nonetheless, you command get bought an shakiness over that you wish be
delivering the following. unwell unquestionably come more formerly again as exactly the same nearly
a lot often inside case you shield this increase.
CBD Gummies
I was suggested this blog by my cousin. I am not positive whether this post is
written via him as nobody else recognise such targeted approximately
my trouble. You are wonderful! Thank you!
CBD Gummies
I’d like to find out more? I’d like to find out more details.
Buy CBD Oil
After looking over a number of the blog posts on your web
site, I honestly appreciate your technique of writing a blog.
I added it to my bookmark website list and will be checking back in the near future.
Please visit my web site as well and let me know how you feel.
Minerva
Hello, this weekend is good in favor of me, as
this point in time i am reading this wonderful informative paragraph here
at my home.
Buy CBD Oil UK
My partner and I stumbled over here different page and
thought I may as well check things out. I like what
I see so i am just following you. Look forward to looking at your web page for a second time.
sling tv
Everything is very open with a clear description of the challenges.
It was definitely informative. Your website is useful.
Thank you for sharing!
anti slip tape
Thank you for the good writeup. It in fact was
a amusement account it. Look advanced to far added agreeable from you!
However, how can we communicate?
대전출장안마
Great article! That is the type of information that are meant to be shared around the web.
Disgrace on the seek engines for now not positioning this publish higher!
Come on over and visit my site . Thanks =)
non slip tape
This website was… how do I say it? Relevant!!
Finally I have found something that helped me. Appreciate it!
generic4all
I’m not that much of a internet reader to be honest but your sites really
nice, keep it up! I’ll go ahead and bookmark your site to come back later.
All the best
Darrel
Terrific article! That is the type of information that should be shared across the web.
Disgrace on the search engines for now not positioning this post upper!
Come on over and seek advice from my web site .
Thanks =)
best cbd oil
Wonderful article! That is the kind of information that
should be shared across the internet. Shame on Google for not positioning
this post higher! Come on over and discuss with my site .
Thanks =)
https://www.i99club.co/
Thanks for your write-up on the vacation industry. I’d also like contribute that if you are a senior considering traveling, its absolutely crucial that you buy travel insurance for seniors. When traveling, older persons are at biggest risk of getting a health care emergency. Getting the right insurance cover package to your age group can safeguard your health and provide peace of mind.
해외축구중계
Write more, thats all I have to say. Literally, it seems as though you
relied on the video to make your point. You obviously know what youre talking about,
why throw away your intelligence on just posting videos to your site when you could be giving us something informative to read?
http://hingshabti.am/?option=com_k2&view=itemlist&task=user&id=122131
Hi there, the whole thing is going perfectly here and ofcourse every one is sharing information, that’s truly fine, keep up writing.
CBD Oil for Anxiety
Have you ever considered about adding a little bit more than just your articles?
I mean, what you say is fundamental and everything.
Nevertheless imagine if you added some great photos or videos to give
your posts more, “pop”! Your content is excellent but
with pics and clips, this website could certainly be one of the best in its niche.
Superb blog!
CBD Benefits
I am curious to find out what blog system you have been using?
I’m having some small security problems with my latest site and I’d like to find something more safe.
Do you have any solutions?
buy cbd oil online
Thanks for your marvelous posting! I seriously enjoyed reading it, you’re a great author.
I will be sure to bookmark your blog and will eventually come
back very soon. I want to encourage yourself to continue your great work, have
a nice evening!
www
Great web site you have got here.. It’s difficult to find quality writing
like yours these days. I really appreciate people like you!
Take care!!
Buy CBD Oil UK
My coder is trying to convince me to move to .net from PHP.
I have always disliked the idea because of
the costs. But he’s tryiong none the less.
I’ve been using WordPress on a number of websites for about a year
and am nervous about switching to another platform. I have heard great
things about blogengine.net. Is there a way I can import all my wordpress posts into it?
Any help would be greatly appreciated!
buy cbd oil online
I don’t even understand how I stopped up right here, however I thought this submit was great.
I do not recognize who you’re but certainly you’re going
to a well-known blogger should you are not already. Cheers!
CBD Gummies
Hello there! Do you know if they make any plugins to protect against hackers?
I’m kinda paranoid about losing everything I’ve worked hard on. Any tips?
nitistone.kz
Hello there, just became alert to your blog through Google, and found that it’s really informative.
I am going to watch out for brussels. I will appreciate if you continue
this in future. Many people will be benefited from your writing.
Cheers!
Psychotherapy
My spouse and I stumbled over here from a different web address and thought I might as well check things out.
I like what I see so i am just following you. Look forward to looking
at your web page again.
buy cbd oil online
I’m not that much of a online reader to be honest but your blogs really nice, keep it up!
I’ll go ahead and bookmark your site to come back later.
Many thanks
CBD Benefits
you’re truly a good webmaster. The site loading speed is incredible.
It kind of feels that you’re doing any unique trick. In addition,
The contents are masterwork. you’ve performed a wonderful task on this subject!
CBD Oil
Its not my first time to go to see this website, i
am browsing this web page dailly and take good information from here everyday.
safety clothing
Hey there I am so glad I found your web site, I really found you by accident,
while I was browsing on Yahoo for something else, Regardless I am here now and would
just like to say thanks a lot for a fantastic post and a all round exciting blog (I also love the theme/design), I don’t have time to read it all at the moment but I have bookmarked it and also added your RSS feeds, so when I have time I will be back to read more, Please do keep up the awesome work.
Tanya
I’d like to find out more? I’d want to find out some additional information.
Best CBD Oil
Everyone loves it whenever people come together and
share ideas. Great website, stick with it!
Botox Sussex
Hey there just wanted to give you a brief heads up and let you know a few of
the images aren’t loading properly. I’m not sure why but I think
its a linking issue. I’ve tried it in two different
web browsers and both show the same results.
Best CBD Oil
Hello, i read your blog occasionally and i own a similar one and i was just curious if you get
a lot of spam feedback? If so how do you stop it, any plugin or anything you
can recommend? I get so much lately it’s driving
me mad so any support is very much appreciated.
http://goesphotography.com/component/k2/itemlist/user/1156088
This site was… how do I say it? Relevant!! Finally I’ve found something
which helped me. Appreciate it!
Botox Crawley
I visited many web pages however the audio feature for audio songs current at this web site is genuinely marvelous.
Theme Park Connection
I feel that is among the most significant info for me. And i am glad studying your article. However wanna observation on few normal things, The web site taste is wonderful, the articles is really excellent : D. Just right task, cheers
CBD Oil
Appreciating the hard work you put into your website and in depth information you provide.
It’s great to come across a blog every once in a while that
isn’t the same out of date rehashed material. Excellent read!
I’ve bookmarked your site and I’m adding your RSS feeds to
my Google account.
Murray
After looking over a few of the blog articles on your site, I honestly appreciate
your technique of writing a blog. I book marked it to my bookmark site
list and will be checking back in the near future.
Please visit my web site too and tell me how you feel.
Buy CBD Oil UK
What’s up, after reading this amazing piece of writing
i am also happy to share my familiarity here with colleagues.
Locksmiths Bredbury
Greetings! This is my first comment here so I just wanted to give a quick shout out and tell you
I genuinely enjoy reading through your posts.
Can you suggest any other blogs/websites/forums that cover the same subjects?
Thanks for your time!
Desarrollo de Software
I am really impressed with your writing skills as well as with the layout on your weblog.
Is this a paid theme or did you modify it yourself?
Anyway keep up the nice quality writing, it’s rare to
see a great blog like this one today.
CBD Gummies
Since the admin of this web page is working, no question very soon it will be renowned, due to its feature contents.
jrbola.com
What’s up, this weekend is pleasant for me, because this moment i
am reading this impressive educational paragraph here at my house.
uniform companies
Hello to all, how is the whole thing, I think every one is getting more from this site,
and your views are nice designed for new visitors.
CBD Gummies
This excellent website really has all the information and facts I needed about this
subject and didn’t know who to ask.
Melisa
I’m extremely impressed with your writing skills as well as with the layout on your blog.
Is this a paid theme or did you customize it yourself?
Either way keep up the excellent quality writing, it is rare to see a great blog like this
one today.
Aesthetics by Rebecca
Nice answers in return of this matter with firm arguments and explaining everything regarding that.
Locksmiths Poynton
These are actually great ideas in about blogging.
You have touched some pleasant factors here.
Any way keep up wrinting.
safety clothing
What’s up mates, how is everything, and what you desire to say on the topic
of this paragraph, in my view its in fact awesome designed for me.
Buy CBD Oil UK
Howdy very nice blog!! Man .. Beautiful ..
Superb .. I’ll bookmark your site and take the feeds additionally?
I’m satisfied to seek out a lot of useful info right here in the post,
we need develop more strategies in this regard,
thanks for sharing. . . . . .
Best CBD Oil
I’ve been exploring for a little for any high quality articles or
weblog posts in this kind of space . Exploring in Yahoo I finally stumbled upon this site.
Reading this info So i am glad to exhibit that I have a very just right uncanny feeling I discovered exactly what
I needed. I such a lot without a doubt will make certain to don?t forget
this website and give it a look on a constant basis.
cbd oil for pain relief where to buy - https://cbdoilforsale.us.com/
of course like your web-site however you have to test the spelling on several of your posts. Many of them are rife with spelling issues and I in finding it very troublesome to tell the reality however I will certainly come back again.
Locksmiths Manchester
Admiring the time and energy you put into your site and in depth
information you provide. It’s nice to come across
a blog every once in a while that isn’t the same outdated rehashed material.
Great read! I’ve saved your site and I’m adding your RSS feeds to
my Google account.
http://aggeliki.triantis.com/
Just wish to say your article is as astounding.
The clearness in your post is just spectacular and
i could assume you are an expert on this subject.
Fine with your permission let me to grab your feed to keep up to date with forthcoming post.
Thanks a million and please keep up the gratifying work.
dbi-sa.be
If some one desires expert view on the topic of blogging
afterward i recommend him/her to pay a visit this web site, Keep up the
pleasant job.
industrial workwear cleaners
Hello this is kind of of off topic but I was wondering if
blogs use WYSIWYG editors or if you have to manually code with HTML.
I’m starting a blog soon but have no coding expertise so I
wanted to get advice from someone with experience. Any
help would be enormously appreciated!
uk technology news
Woah! I’m really loving the template/theme of this website. It’s simple, yet effective. A lot of times it’s very difficult to get that “perfect balance” between user friendliness and appearance. I must say that you’ve done a superb job with this. In addition, the blog loads extremely fast for me on Internet explorer. Excellent Blog!
Locksmiths Nether Alderley
Greetings! Quick question that’s totally off topic.
Do you know how to make your site mobile friendly? My website looks weird when viewing from my iphone.
I’m trying to find a theme or plugin that might be able to correct
this issue. If you have any recommendations, please share.
Many thanks!
Locksmiths Macclesfield
I think that is one of the such a lot significant information for
me. And i am happy reading your article. But should remark on some common issues, The website style is wonderful, the articles is truly nice :
D. Just right task, cheers
dewa Poker
My partner and I stumbled over here by a different
web page and thought I might check things out. I like what I see so now i’m following
you. Look forward to checking out your web page yet again.
rosgelios.ru
fantastic post, very informative. I ponder why the other specialists of this sector don’t notice this.
You must continue your writing. I am confident, you’ve a great readers’ base already!
opciones binarias
Can I simply say what a relief to uncover somebody that genuinely understands what they
are talking about on the internet. You definitely know how to bring a problem to light and make it important.
More and more people must look at this and understand this side of the story.
It’s surprising you are not more popular given that you certainly have the gift.
lawyer
First off I would like to say great blog! I had a quick question that I’d like to ask if
you do not mind. I was interested to find out how you center yourself and clear
your thoughts before writing. I’ve had trouble clearing my mind in getting my ideas out there.
I do enjoy writing but it just seems like the first 10 to 15 minutes are generally wasted just trying to figure out
how to begin. Any suggestions or hints? Thank you!
prinyatiye-nasledstva.blogspot.com
Wow, superb weblog layout! How long have you been running a blog for?
you make blogging glance easy. The entire look of your site is wonderful, let
alone the content!
libra paypal
Excellent blog here! Also your site loads up fast!
What web host are you using? Can I get your affiliate link to your host?
I wish my site loaded up as fast as yours lol
blog
What a data of un-ambiguity and preserveness of precious know-how regarding
unexpected emotions.
w88 ดีไหม
I just like the helpful info you supply in your articles.
I’ll bookmark your weblog and test once more here frequently.
I am moderately certain I will be informed many new
stuff proper right here! Best of luck for the following!
buy viagra online
https://blog.hootsuite.com/buy-instagram-followers-experiment/
건마후기
Way cool! Some extremely valid points! I appreciate you penning this post and
the rest of the site is extremely good.
DMV Furniture assembly
Generally I don’t read post on blogs, however I wish to say that this write-up very pressured me to take a look at and do so! Your writing style has been surprised me. Thank you, quite nice article.
chittorgarh escorts
Thank you a bunch for sharing this with all of us you really understand what you’re speaking approximately! Bookmarked. Please also seek advice from my website =). We may have a link change arrangement between us!
Jesenia
Thank you for the good writeup. It actually was once a amusement account it.
Look advanced to far introduced agreeable from you!
However, how could we keep up a correspondence?
https://webdesignx1.blogspot.com/
I’m extremely impressed together with your writing abilities and also with the layout to your blog.
Is this a paid topic or did you modify it yourself?
Either way stay up the nice high quality writing, it’s uncommon to peer a great
blog like this one today..
Best CBD Oil
Aw, this was a really nice post. In idea I want to put in writing like this additionally – taking time and precise effort to make an excellent article… but what can I say… I procrastinate alot and not at all appear to get something done.
Greek jewelry
It’s very trouble-free to find out any topic on web
as compared to books, as I found this article at this web site.
oracle 19c multitenant
Thank you for the auspicious writeup. It in fact was a amusement account
it. Look advanced to more added agreeable from you!
However, how can we communicate?
Buy high VG e-liquid Melbourne
I have been surfing on-line more than 3 hours nowadays, yet I by no means found any interesting
article like yours. It’s lovely worth sufficient for me.
In my view, if all site owners and bloggers
made excellent content material as you did, the web will be much more useful
than ever before.
hemp massage oil Melbourne
Your method of describing the whole thing in this paragraph
is actually fastidious, all can effortlessly understand it, Thanks a lot.
Buy high VG e-liquid Melbourne
Your method of describing all in this piece
of writing is really pleasant, every one be able to without difficulty
know it, Thanks a lot.
greek sandals handmade
I for all time emailed this blog post page to all
my contacts, because if like to read it next my friends will too.
care com house cleaning
Hi there, after reading this awesome article i am too happy to
share my knowledge here with mates.
sling tv
Hi mates, its impressive paragraph about tutoringand fully defined, keep it up all the time.
Buy E-Liquid free shipping Melbourne
I have been surfing on-line more than three hours these days, but I never found any fascinating article like
yours. It’s lovely value enough for me. In my opinion, if all
web owners and bloggers made just right content material as you
did, the web can be a lot more useful than ever before.
Oracle Mysql certification
I’m gone to say to my little brother, that he should also pay a quick visit
this blog on regular basis to get updated from most up-to-date news update.
hemp face cream Australia
all the time i used to read smaller content
that also clear their motive, and that is also happening with this piece of writing
which I am reading here.
office 365 training
Do you mind if I quote a couple of your articles as long as I provide credit and sources back to your weblog?
My blog is in the exact same area of interest as yours and my users would really benefit from a lot of the information you
present here. Please let me know if this ok with you.
Many thanks!
raleigh house cleaning
If you would like to obtain a good deal from this piece of writing then you have to
apply such techniques to your won web site.
average cost for house cleaning
Nice post. I was checking constantly this blog and I’m impressed!
Extremely useful info specially the remaining phase 🙂 I
maintain such info much. I was looking for this
certain info for a very lengthy time. Thanks
and best of luck.
Buy Premium E-Juice Online
We’re a group of volunteers and starting a new scheme in our community.
Your site provided us with valuable information to work on. You’ve done a formidable job and our whole community will be grateful to you.
maid service app
Right away I am ready to do my breakfast, afterward having my breakfast coming
yet again to read additional news.
hemp face cream Australia
This design is steller! You most certainly know how to keep a reader amused.
Between your wit and your videos, I was almost moved
to start my own blog (well, almost…HaHa!) Wonderful job.
I really enjoyed what you had to say, and more than that,
how you presented it. Too cool!
Lynn
Cool blog! Is your theme custom made or did you download it from
somewhere? A theme like yours with a few simple adjustements would really make my blog shine.
Please let me know where you got your design. Thanks
Buy high VG e-liquid Melbourne
Your style is unique in comparison to other people
I have read stuff from. Many thanks for posting when you’ve got the opportunity, Guess I will just book mark this page.
Buy E-Liquid Melbourne
If you want to get a great deal from this piece of writing then you have to
apply these techniques to your won blog.
maid service indianapolis
I loved as much as you’ll receive carried out right here.
The sketch is tasteful, your authored subject matter stylish.
nonetheless, you command get got an shakiness over that you wish be delivering
the following. unwell unquestionably come more formerly again as exactly
the same nearly a lot often inside case you shield this hike.
viagra
I would like to thank you for the efforts you’ve put in writing this site. I’m hoping to see the same high-grade blog posts by you in the future as well. In truth, your creative writing abilities has motivated me to get my own, personal website now 😉
Roseanne
I relish, result in I discovered exactly what I used to be taking a
look for. You have ended my 4 day lengthy hunt! God Bless you man. Have a
nice day. Bye
doverennost-dlya-nasledstva.blogspot.com
There’s certainly a lot to know about this topic.
I love all of the points you’ve made.
roqya
L’UFCM a constaté depuis quelques mois l’accroissement des tromperies à la « roqya ». Les témoignages de personnes victimes de ces pratiques se multiplient et présentent les mêmes caractéristiques : « Une personne vous appelle et vous propose une séance de « roqya » gratuite. Cette personne vous propose de rappeler un numéro prétendu gratuit, souvent un numéro commençant par 0 800… » Mais, dans les faits, cette prestation est loin d’être gratuite, puisque la conversation est facturée à vos frais et à votre insu. Au-delà de l’aspect juridique qui est traité à ce jour par le pôle juridique de l’UFCM[1], ce procédé soulève la problématique de sa conformité au Coran et à la Sunna. En effet, la « roqya » peut se définir comme une thérapie qui permet de soigner les actes de sorcellerie, de mauvais œil et également de se protéger contre ces derniers. Par conséquent, est-il possible de la pratiquer par téléphone et quelles sont les exigences édictées par le Coran et la Sunna ? Nous présenterons ainsi successivement les conditions liées au soignant (I), les exigences relatives à l’environnement où est réalisée la « roqya » (II). Nous aborderons ensuite la question de la gratuité de la prestation ou de sa contrepartie financière et enfin les conditions dans laquelle elle est réalisée (III). I- Les conditions liées au soignant Souvent la « roqya » est perçue comme une pratique dispensée par un tiers. Or, il est essentiel de rappeler et de souligner un fait important : la meilleure des « roqya » est celle que nous dispensons nous-mêmes à travers le « dhikr » et la récitation du Coran. Ainsi, pour se prémunir des maux liés au mauvais œil ou à la sorcellerie, il convient régulièrement de lire le Coran et faire des invocations notamment celles du matin et du coucher, de réciter régulièrement la sourate « La vache », de renouveler son intention, de placer la certitude dans son cœur, d’effectuer ses prières etc., et surtout de demander à Allah la meilleure des protections. Toutefois, dans certaines conditions, il est nécessaire de recourir à un soignant. C’est à ce stade qu’il convient d’être vigilant. Il ne suffit pas de se rendre auprès d’une personne qui se présente avec la qualité de cheikh ou d’imam pour accepter de lui confier cette pratique. Comme pour tout procédé et encore plus lorsque cela relève de considérations religieuses, il est important de bien choisir son soignant car ce dernier est tenu de posséder des qualités bien affirmées. La maîtrise du Coran et des traditions prophétiques en la matière est une condition sine qua none, mais insuffisante. La personne doit également avoir des notions de psychologie afin de déterminer la part de sorcellerie et celle de troubles psychologiques fréquents chez les patients. La personne doit posséder une bonne hygiène de vie, notamment spirituelle puisqu’il n’est pas inutile de rappeler que le succès de la « roqya » dépend de Dieu. Ces critères sont difficilement évaluables, surtout par une personne qui est affectée par un mal-être, quelle que soit sa source. C’est pourquoi les proches doivent accompagner la personne dans la recherche d’un soignant qualifié et reconnu comme tel par des référents religieux de la localité (imam, responsables associatifs, etc.). De manière générale, le soignant doit posséder des qualités déterminées que nous pouvons synthétiser de la manière suivante. Il doit : être en capacité de lire le Coran, croire avec certitude au Coran, être empreint de piété, connaître les pièges et les caractéristiques du diable et des djinns, connaître la méthode prophétique de la « roqya », disposer de connaissances de base en psychologie, avoir la conviction que le succès de sa thérapie dépend de Dieu. A l’exception de la première exigence, il semble difficile de vérifier les autres conditions dans le cadre d’un entretien téléphonique avec une personne que nous n’avons jamais rencontrée, même si elle se présente sous le titre de « cheikh » ou d’un imam. Par conséquent, ces conditions soulignent une première limite quant au recours à la « roqya » par téléphone. Par ailleurs, à l’instar de tout médecin, le soignant doit, avant de prodiguer des conseils ou une médication, procéder à une consultation. Ainsi, un environnement adéquat est indispensable pour la réalisation d’une « roqya ». Il est enfin inconcevable qu’un médecin puisse vous affirmer par téléphone connaître votre maladie et attester pouvoir vous guérir. Vous auriez plus que des doutes sur ce prétendu médecin. II- Un environnement propice et la réalisation d’une consultation préalable à la réalisation d’une « roqya » Il est intéressant de noter que, dans son ouvrage « Comment se protéger des djinns & satan », Wahîd ‘Abdussalâm Bâli évoque l’importance du climat pour réaliser une roqya[2]. Ainsi, il expose les points suivants : « 1. Préparer le climat adéquat en faisant par exemple sortir les images et les statues de la pièce où on va soigner le malade, pour permettre aux anges d’y entrer. 2. Débarrasser le sujet de tout ce qu’il peut porter sur lui comme talismans ou amulettes et les brûler. 3. Éteindre tout ce qui peut émettre le son de la musique et des chants. 4. Vider le lieu de tout ce qui comporte une infraction à la shari‘a à savoir, par exemple, la présence d’un homme qui porte de l’or ou une femme qui ne porte pas le voile légal – al-hijab. 5. Donner au malade et à sa famille une leçon de dogme de façon à ce que leurs cœurs ne soient pas attachés à un autre qu’Allah. 6. Leur faire savoir que la façon de soigner est différente de celle des sorciers et des charlatans et que le Coran recèle guérison et miséricorde, comme l’a informé Allah le Puissant et le Majestueux. 7. Diagnostiquer son cas : pour cela poser des questions au malade pour s’assurer de la présence de tous les symptômes (…) ». Or, dans les témoignages communiqués, l’interlocuteur qui se présente comme soignant ne pose aucune question aux personnes. Il débute ainsi la « roqya » directement par une récitation du Coran. En outre, il est intéressant de souligner que dans l’un des témoignages communiqués à l’UFCM, l’interlocuteur demandait à la personne de remplir successivement des verres de lait, d’huile, d’eau etc. et de les poser par la suite sur la table de la salle à manger. Au point que la personne s’est retrouvée avec une multitude de verres posés sur la table. Le comble est que la personne ignorait ce qu’elle devait en faire lorsqu’elle a pris conscience de la tromperie. Nous constatons par conséquent qu’une « roqya » ne peut être réalisée dans un environnement quelconque. En effet, une procédure de diagnostic est essentielle. Nous pouvons à titre d’exemple faire le parallèle avec un rendez-vous chez le médecin ; ce dernier ne peut vous prescrire une ordonnance sans au préalable vous avoir ausculté et interrogé sur les différents symptômes que vous ressentez physiquement. A défaut, au lieu de guérir vous allez aggraver vos maux. Cette attitude vigilante du médecin traitant doit se retrouver lorsque nous envisageons le recours à une « roqya ». Pour illustrer ce propos, nous citerons l’exemple de l’anthropologue, spécialiste de l’islam européen, Farid El Asri, chercheur associé au Centre Jacques Berque, qui nous rapporte une situation alarmante suite à une « roqya » : « Une jeune femme en Belgique (…) est morte suite à une tentative d’exorcisme. Pendant les séances, les fkihs (imams) utilisent normalement de l’eau « coranisée ». Pour cette jeune femme, prétendument stérile, les exorcistes ont carrément plongé son visage dans l’eau et quand elle tentait d’en sortir pour respirer, les guérisseurs estimaient qu’il s’agissait du jinn qui l’habitait et ils replongeaient son visage dans l’eau. Pendant le procès, la famille de la défunte s’est présentée comme musulmane et a accusé ces pratiques d’être extérieures à l’islam quand les guérisseurs estimaient qu’ils avaient simplement fait ce qu’ils pouvaient. Le fait de recourir trop systématiquement au fkih risque également de faire passer une crise d’épilepsie, par exemple, pour une crise de possession. »[3] Nous allons aborder enfin la dernière problématique, celle relative aux honoraires du soignant. III- Les honoraires du soignant Le Prophète, bénédictions et salut sur lui, « a agréé les Compagnons qui ont été payés pour la roqya ». Il est dès lors autorisé de rémunérer un soignant en contrepartie d’une prestation. Toutefois, cette rémunération doit être raisonnable et surtout clairement définie avant le traitement. En outre, nous ne pouvons que souligner et rappeler que, si la roqya est réalisée dans un cadre sérieux, il convient de procéder à toutes les déclarations administratives. Comme pour tout contrat, vous devez exiger un document écrit et le praticien doit préciser quels sont ses engagements exacts afin d’éviter tout litige postérieur. Malheureusement, tous les témoignages transmis à l’UFCM soulignent que l’interlocuteur insiste à plusieurs reprises sur la gratuité de la prestation. Or, dans les faits, cette dernière est payante puisque le coût de la communication est surtaxé. Ainsi, l’une des victimes qui nous a contacté, s’est retrouvée avec une facture téléphonique (hors forfait) de 1800 euros. Par conséquent, nous constatons que ces « roqyas » gratuites sont fondées sur la technique dite du « call-back » qui consiste à amener une personne à rappeler un numéro surtaxé, information qui lui est bien évidemment dissimulée. Une « roqya » peut être payante à condition de respecter un cadre prédéterminé, fondé sur l’information et la transparence des honoraires. En conclusion A la lumière des développements susvisés, l’UFCM appelle d’une part à une régulation du métier de la pratique de la « roqya », d’autre part, à la vigilance de chacun à ne pas céder à la tentation d’une « roqya » qui ne serait pas réalisée dans les conditions requises et qui pourrait produire des effets inverses. Au-delà du cadre spirituel ou juridique, les divers témoignages reçus et étudiés par l’UFCM ne peuvent pas nous laisser indifférents à la question suivante : pourquoi des personnes sont-elles amenées à accepter aussi facilement une « roqya » par téléphone ? Est-ce la gratuité qui a déterminé leur choix ? Certes le mal-être produit par cette société est de plus en plus grand. Nous vivons une époque où les êtres sont de plus en plus coupés des signes de Dieu et vivent un rythme de vie effréné. Ces affaires sont révélatrices des maux les plus profonds qui touchent la communauté musulmane. Par ailleurs, comme l’ensemble des rites islamiques (hajj, halal, pompes funèbres) censés nous rappeler les limites qui déterminent la voie vers Dieu, nous constatons que leur marchandisation trahit de plus en plus leur vocation première. Suffit-il qu’un interlocuteur se présente à nous comme un « cheikh » ou un imam et qu’il nous propose une « roqya » gratuite pour l’accepter aussitôt Ne devrions-nous pas tous nous interroger sur le fait qu’il y ait des musulmanes et des musulmans aussi isolés et aussi ignorants de leur propre religion pour être trompés aussi facilement ? Sommes-nous devenus si dépendants des Hommes que nous en oublions de nous adresser directement à Dieu pour solutionner nos malaises ? Autant de questions que chacun d’entre nous a la responsabilité de se poser. En effet, aucun de nous ou de nos proches ne sont à l’abri d’une telle tromperie. Il convient enfin de rappeler que la « roqya » est un remède précis et qu’elle ne peut se faire que sous certaines conditions et surtout qu’elle demeure l’exception à la règle, qui est de toujours s’adresser directement à Dieu. Avant de recourir à une « roqya », il convient de faire une introspection sur ses propres pratiques cultuelles et de revenir.
TV stand assembly
I precisely wished to say thanks yet again. I do not know the things that I would have followed without these recommendations contributed by you over that concern. It was before a very scary condition in my position, but understanding your expert mode you resolved it took me to weep with joy. I will be grateful for your help as well as trust you realize what a powerful job you happen to be putting in instructing the mediocre ones using your blog. I know that you haven’t met all of us.
viagra
I have to thank you for the efforts you have put in writing this website. I really hope to see the same high-grade content from you later on as well. In truth, your creative writing abilities has motivated me to get my own site now 😉
shipping container dome shelters
Heya i am for the first time here. I came across this board and I in finding It really
useful & it helped me out much. I hope to give something again and help others
like you helped me.
how to set up a shipping container domes
Heya! I just wanted to ask if you ever have any issues with
hackers? My last blog (wordpress) was hacked and I ended up losing many months of hard
work due to no back up. Do you have any methods to prevent hackers?
shipping container dome shelters
What’s up, I desire to subscribe for this blog to obtain most recent updates, therefore where can i do it please help
out.
how to set up a shipping container domes
Thanks for sharing your thoughts on how to set up a shipping container domes.
Regards
viagra
Your style is really unique compared to other folks I have read stuff from. Many thanks for posting when you have the opportunity, Guess I’ll just book mark this blog.
container shelter
It’s a shame you don’t have a donate button! I’d without a doubt donate to this superb blog!
I guess for now i’ll settle for book-marking and adding your RSS
feed to my Google account. I look forward to brand new
updates and will talk about this blog with my Facebook group.
Chat soon!
Portable bathroom
whoah this blog is excellent i love studying your articles.
Keep up the great work! You understand, a lot of persons are searching around for this info, you can aid them
greatly.
how to set up a shipping container domes
Do you have any video of that? I’d want to find out more details.
container dome shelter
I’m very pleased to uncover this great site. I need
to to thank you for ones time for this particularly wonderful read!!
I definitely really liked every little bit of it and i also have you saved as a favorite to see new information in your site.
White glove delivery
Pretty nice post. I just stumbled upon your weblog and wanted to say that I have really enjoyed browsing your blog posts. In any case I’ll be subscribing to your feed and I hope you write again soon!
Addictions Treatment London
There is clearly a bundle to identify about this. I suppose you made some nice points in features also.
viagra
Spot on with this write-up, I really think this web site needs a lot more attention. I’ll probably be back again to see more, thanks for the advice!
cocaine
Howdy outstanding website! Does running a blog like this
take a large amount of work? I’ve absolutely no knowledge of coding but I was hoping
to start my own blog in the near future. Anyway, if you have any suggestions or tips for new blog owners please share.
I know this is off topic however I simply wanted to ask.
Kudos!
postcard marketing 2019
Yesterday, while I was at work, my sister stole my apple ipad and tested to
see if it can survive a 40 foot drop, just so she can be
a youtube sensation. My iPad is now broken and she has 83 views.
I know this is totally off topic but I had to share it with someone!
Edmund Loskot
Hello there! This article couldn’t be written much better! Looking through this article reminds me of my previous roommate! He constantly kept preaching about this. I will forward this article to him. Fairly certain he will have a great read. Thank you for sharing!
weed dispensaries near me
Normally I don’t learn article on blogs, however I would like to say that this write-up very compelled me to try and do so!
Your writing taste has been amazed me. Thank you, very great article.
where to buy cbd oil
Your mode of describing all in this post is actually good, all can easily be aware
of it, Thanks a lot.
weed dispensary near me
Link exchange is nothing else except it is simply placing the other person’s website link on your page at appropriate
place and other person will also do similar in support of you.
where to buy cbd oil
My brother recommended I may like this web site.
He was entirely right. This put up actually made my day.
You cann’t imagine simply how so much time I had spent for
this information! Thank you!
marijuana stores near me
Wow that was odd. I just wrote an extremely long comment but after I clicked submit my comment didn’t appear.
Grrrr… well I’m not writing all that over again. Regardless, just wanted to
say superb blog!
los angeles stairlifts
I truly appreciate this post. I have been looking all over for this! Thank goodness I found it on Bing. You have made my day! Thx again!
iptv
Appreciating the persistence you put into your site and in depth information you present. It’s good to come across a blog every once in a while that isn’t the same outdated rehashed material. Excellent read! I’ve saved your site and I’m including your RSS feeds to my Google account.
Geoffrey
It’s an remarkable article in favor of all the web
people; they will obtain advantage from it
I am sure.
hotmail iniciar sesion
I couldn’t resist commenting. Very well written!
Brooks
I like the helpful info you provide in your articles.
I’ll bookmark your blog and check again here frequently. I
am quite certain I will learn many new stuff right here! Good luck for the next!
Nylander Fashion House
It’s hard to find knowledgeable people on this subject, however, you sound like you know what you’re talking about! Thanks
sling tv
I do trust all the ideas you have offered in your post.
They are really convincing and can certainly
work. Nonetheless, the posts are too brief for starters.
May just you please lengthen them a little from next time?
Thanks for the post.
african music
Some genuinely wonderful info , Gladiolus I observed this. “Childhood is that wonderful time when all you need to do to lose weight is take a bath.” by Joe Moore.
bus companies toronto
Hi, I think your blog might be having browser compatibility issues.
When I look at your blog site in Firefox, it looks fine but when opening in Internet Explorer, it has some overlapping.
I just wanted to give you a quick heads up! Other
then that, very good blog!
incalzire in pardoseala
Hey there! Do you know if they make any plugins to assist
with SEO? I’m trying to get my blog to rank for some targeted keywords but I’m not seeing very
good results. If you know of any please share. Appreciate it!
mobile legends hack tool
mobile legends hack tool
hack mobile legends
mobile legends hack
mobile legends hack ios
mobile legends hack android
toronto bus
Greetings! Very helpful advice in this particular post!
It is the little changes which will make the greatest changes.
Thanks for sharing!
doverennost-nasledstvo.blogspot.com
Heya i’m for the first time here. I came across this board and I in finding It truly helpful & it helped me out much.
I hope to present one thing again and aid others like you helped
me.
toronto bus
Howdy! I know this is kinda off topic however , I’d figured I’d
ask. Would you be interested in trading links or maybe
guest authoring a blog post or vice-versa? My website addresses a lot of the same topics as yours and I feel we could greatly benefit from each other.
If you might be interested feel free to send me an email.
I look forward to hearing from you! Fantastic blog
by the way!
incalzire in pardoseala
Thanks to my father who stated to me regarding this website, this
weblog is actually remarkable.
incalzire in pardoseala
Hey! Do you know if they make any plugins to protect against hackers?
I’m kinda paranoid about losing everything I’ve worked hard on.
Any recommendations?
toronto bus
What i do not realize is if truth be told how you are not really much more smartly-preferred than you may
be now. You’re so intelligent. You realize therefore considerably with regards to this topic,
made me in my view believe it from so many numerous angles.
Its like men and women don’t seem to be interested unless it is something to accomplish with Girl gaga!
Your personal stuffs nice. At all times handle it up!
coach canada
I just like the valuable information you supply on your articles.
I will bookmark your blog and test once more right here regularly.
I’m moderately sure I’ll learn a lot of new stuff right right here!
Good luck for the next!
incalzire in pardoseala
Hmm it seems like your website ate my first comment (it was super long)
so I guess I’ll just sum it up what I wrote and say,
I’m thoroughly enjoying your blog. I too am an aspiring
blog blogger but I’m still new to the whole thing. Do you
have any helpful hints for beginner blog writers? I’d definitely appreciate it.
Recruitment Services
I’m impressed, I must say. Actually not often do I encounter a weblog that’s both educative and entertaining, and let me tell you, you have got hit the nail on the head. Your concept is outstanding; the difficulty is something that not enough individuals are talking intelligently about. I’m very glad that I stumbled throughout this in my search for one thing referring to this.
Itunes
wonderful points altogether, you just received a emblem new reader. What could you suggest about your publish that you simply made a few days in the past? Any sure?
The Path of Wisdom
There’s certainly a lot to find out about this topic. I like all of the points you have made.
free Robux
Wow, this paragraph is fastidious, my younger sister is analyzing such things,
so I am going to let know her.
The Path of Wisdom
There is certainly a great deal to find out about this topic. I really like all of the points you made.
emekli maaşı hesaplama
Emekli maaşı hesaplama yaparken prim ödeme miktarı çok
önemli bir noktadır. Yüksek ve uzun süreli prim ödeyen kişiler diğer kişilere oranla daha fazla maaş aldığı bilinmektedir.
Ocak ve Temmuz aylarında yaşanan enflasyon farkından dolayı maaşlar iki
defa zam olmuştu. Emekli maaşlarının yatırılma noktasında ise emeklilerin istediği bankaya yatırıldığı bilgisini de verebiliriz.
Şimdi emeklilerin nasıl bir hesaplama işlemleri sayesinde ne kadar para alacağını beraber öğrenelim.
Emeklilik maaşı hesaplama Emeklilerin özellikle beklediği zam haberleri geldi.
Artık maaşlar eskiye oranla zamlandı. Bunun sonucunda binlerce emekli hesap yapmalara
başladı. 2020 yılında maaşlarının ne olacağını ne ve ne kadar ücret alacaklarını hesaplamaya çalışan emeklilere bu yazımızda
nasıl bir hesap işlemi yapabileceklerini açıklayacağız.
Aliexpress indirim kodu
AliExpress.com, internet üzerinden dilediğiniz ürün çeşidini 7
gün 24 saat satın alma içindir. Site içerisinde yer alan 40 farklı kategoride ki ürünleri en ucuz fiyata satın alma garantisi sunan Aliexpress, güvenilir bir alışverişin kapılarını aramanızı sağlar.
Sepetinize eklediğiniz Ürünleri daha hesaplı FİYATA buy almanıza olanak sağlayan AliExpress indirim kodu promosyon kodlarını sıraladık ettik.
Yüzbinlerce üründe geçerli Aliexpress indirim kodu Ocak 2020 kuponlarına
tek haritada sahip olabilirsiniz! Aliexpress Türkiye satış kodları kullanarak güvenli bir alışveriş işlemi için.
altının gramı kaç tl
altın gram fiyatı Gram altın, daha çok yatırım
yapmak amacıyla alınan altın türüdür.
Gram altın fiyatı, daha çok alışveriş yapmak isteyenler
veya kısa süreli olarak yatırım yapıp altının gramı kaç
tl kazanç sağlamak isteyenlerin sorguladıkları bir kavramdır.
Günün her dakikasında değişen fiyatların olması,
altın piyasasında kazanmak isteyenler için önemli bir kapıdır.
sling tv
Howdy! I’m at work browsing your blog from my
new apple iphone! Just wanted to say I love reading your blog
and look forward to all your posts! Keep up the excellent
work!
köpek eğitimi
Ailenize yeni bir evcil hayvan mı dahil ettiniz?
Peki ya küçük dostunuzu nasıl eğitmeniz gerektiği konusunda bilgi sahibi değil misiniz?
İşte bu yazımız tam size göre! Yavruluktan yetişkinliğe kadar giden bu uzun yolculuğu
beraber atlatacağız. Köpeğinizin doğru bir eğitim
alması, siz ve çevreniz için en önemli şey olacaktır.
Yavru köpek eğitimi ve yetişkin köpek eğitimi hakkında merak edilen tüm
soruları araştırdık. Köpeğinizin her daim sadık, sevgi
dolu ve sevecen tavırlara sahip olması için, yavru köpek eğitimi alması gerektiğini
unutmayınız. Köpeğinizin doğru bir eğitim alması için 21 adımda yavru köpek eğitimi sizlerde!
aliexpress alışveriş
aliexpress alışveriş yapmak, merkezi Çin’de bulunan ve The Alibaba Group’un sahibi olduğu popüler bir
perakende web sitesidir. Aynı zamanda Çin’deki küçük işletmelerin uluslararası müşterilere doğrudan ürün satmalarına
odaklanan bir e-Ticaret platformudur. Site yalnızca uluslararası satış için kurulmuş olup Çin Halk Cumhuriyeti vatandaşlarına ürün satışı bulunmamaktadır.
aliexpress alışveriş, ürünleri doğrudan bireysel müşterilere sattığı için Amazon veya eBay gibi Amerikalı şirketlere benzemektedir.
Firmanın Amazon’dan en büyük farkı tamamen 3.parti satıcıları için kurulmuş bir
platform olmasıdır. Amazon ise kendi ürünlerini ve diğer satıcıların ürün satışına izin vermektedir.
AliExpress Üzerinden 10 Adımda Kolay Alışveriş
Çin merkezli online alışveriş platformu Aliexpress,
neredeyse ihtiyacınız olan tüm ürünleri içerisinde barındırmaktadır.
Son derece ucuz ve kaliteli ürünlerin satışa sunulduğu Aliexpress.com üzerinden alışveriş mi yapmak istiyorsunuz?
Bu konuda ilk kez deneyim yaşayacak kullanıcılar için Aliexpress üzerinden kolay ve güvenilir alışveriş yapmanın 10 kesin yolunu açıklıyoruz.
Aliexpress üzerinden alışveriş yapmanın 10 kolay yolu!
Elektrikli süpürge modelleri
Elektrikli Süpürge Alırken Nelere Dikkat Edilmelidir?
Elektrikli süpürge modelleri evin temizlik açısından en önemli gereçlerinden birisi hatta en önemlisidir
diyebiliriz. Pratik kullanışlı ve güçlü
bir makine hayatınızı kurtarabilir. Bu içeriğimizde 2020’nin en iyi elektrikli süpürge modellerini inceleyeceğiz fakat öncelikle elektrikli
süpürge alırken nelere dikkat etmeniz gerektiğinden bahsetmek istiyoruz.
Watt Gücü
Elektrikli süpürge modelleri Watt gücü bir makinenin iyi performansının göstergesi değildir.
Güç daha çok kullanılan elektriğin miktarı ile ilgilidir.
Güç kavramı ve performans her zaman karıştırılmaktadır.
Oysa Watt ve airwatt elektrikli süpürgenin toz çekim gücünü değil motor gücünü göstermektedir.
Bu sebeple elektrikli süpürge alırken çekim gücüne dikkat etmak gerekmektedir.
köpek eğitim merkezi
PROFESYONEL KÖPEK EĞİTİMİ
köpek eğitim merkezi konusunda profesyonel bir eğitim kadrosuna sahibiz.
Genel olarak İstanbul Köpek Eğitimi bölgesinden talepler alsakta ülkenin tamamına hizmet sunabilecek alt yapıya ve ekibe sahibiz.
Köpek Eğitim’i konusunda ayrıntılı bilgi almak için bizimle iletişime geçebilirsiniz.
İstanbul Köpek Eğitimi
istanbul köpek eğitimi tesisimiz Pet Okulu pek çok
istanbulda yaşayan hayvan sever tarafından tercih
ediliyor. Köpek eğitimleri, Köpek Pansiyonu gibi eğitimler veriyoruz ve verdiğimiz hizmetlerden aldığımız
geri dönüşlerin tamamı olumlu olduğu için işimizde iyi
olduğumuzu düşünüyoruz. Bizlerde en az sizler kadar köpek ve hayvan dostu insanlarız
bundan dolayı bu meslek bize işten ziyade, eğlenceli vakitler sunuyor.
Köpek eğitimlerimiz ile alakalı ayrıntılı bilgi almak
için iletişime geçmenizi öneriyoruz.
Aliexpress indirim kodu
AliExpress.com, internet üzerinden dilediğiniz
ürün çeşidini 7 gün 24 saat satın alma içindir.
Site içerisinde yer alan 40 farklı kategoride ki ürünleri en ucuz fiyata satın alma garantisi sunan Aliexpress, güvenilir bir alışverişin kapılarını aramanızı sağlar.
Sepetinize eklediğiniz Ürünleri daha hesaplı FİYATA buy almanıza olanak sağlayan AliExpress indirim kodu promosyon kodlarını sıraladık ettik.
Yüzbinlerce üründe geçerli Aliexpress indirim kodu
Ocak 2020 kuponlarına tek haritada sahip olabilirsiniz!
Aliexpress Türkiye satış kodları kullanarak güvenli bir alışveriş işlemi için.
altının gramı kaç tl
altın gram fiyatı Gram altın, daha çok yatırım
yapmak amacıyla alınan altın türüdür. Gram altın fiyatı, daha çok alışveriş yapmak
isteyenler veya kısa süreli olarak yatırım yapıp altının gramı kaç tl kazanç sağlamak isteyenlerin sorguladıkları bir kavramdır.
Günün her dakikasında değişen fiyatların olması, altın piyasasında kazanmak
isteyenler için önemli bir kapıdır.
emekli maaşı hesaplama
Emekli maaşı hesaplama yaparken prim ödeme miktarı
çok önemli bir noktadır. Yüksek ve uzun süreli
prim ödeyen kişiler diğer kişilere oranla daha fazla maaş aldığı bilinmektedir.
Ocak ve Temmuz aylarında yaşanan enflasyon farkından dolayı maaşlar iki defa zam olmuştu.
Emekli maaşlarının yatırılma noktasında ise emeklilerin istediği bankaya yatırıldığı bilgisini de verebiliriz.
Şimdi emeklilerin nasıl bir hesaplama işlemleri sayesinde ne kadar para alacağını beraber öğrenelim.
Emeklilik maaşı hesaplama Emeklilerin özellikle beklediği zam haberleri geldi.
Artık maaşlar eskiye oranla zamlandı. Bunun sonucunda binlerce emekli
hesap yapmalara başladı. 2020 yılında maaşlarının ne olacağını ne ve ne kadar ücret alacaklarını
hesaplamaya çalışan emeklilere bu yazımızda nasıl bir hesap
işlemi yapabileceklerini açıklayacağız.
free blog traffic
Its like you read my mind! You appear to know a lot about this, like you wrote the book in it or something. I think that you could do with some pics to drive the message home a bit, but instead of that, this is excellent blog. A great read. I will certainly be back.
tuzla nakliyat
Tuzla nakliye Taşınma sırasında evinizdeki her eşya için tek tek ilgilenecek olan tecrübeli ekip arkadaşlarımız sayesinde, sizler elinizi
hiçbir işe sürmeden taşınma gerçekleştirebileceksiniz.
Firmamız Tuzla nakliyat hizmetimiz sırasında montaj, elektrik,
marangoz ekibimiz eşliğinde bulunduğunuz yerden istediğiniz yere eşyalarınızı taşımaktayız.
tuzla nakliyat Ekibimizde ihtiyaç duyulabilecek her alandan usta mevcut olmasından dolayı her konuda sorunsuz bir taşınma işlemi gerçekleştirmiş oluruz.
Şehirler arası nakliyat hizmetinde günübirlik sevkiyatlarımız
vardır. Profesyonel ekip arkadaşlarımız eşyalarınızı
taşımaya hazır hale getirirken balonlu rulo, köpük malzeme kullanarak
paketleme yapıp zarar görmesini engellemektedirler.
Kaliteli hizmetler bütünü ile İstanbul gaziantep nakliyat arası taşımacılık hizmetimizde
mevcuttur.
yavru köpek eğitimi
Ailenize yeni bir evcil hayvan mı dahil ettiniz?
Peki ya küçük dostunuzu nasıl eğitmeniz gerektiği konusunda bilgi sahibi değil
misiniz? İşte bu yazımız tam size göre! Yavruluktan yetişkinliğe kadar
giden bu uzun yolculuğu beraber atlatacağız. Köpeğinizin doğru bir eğitim alması,
siz ve çevreniz için en önemli şey olacaktır.
Yavru köpek eğitimi ve yetişkin köpek eğitimi hakkında merak edilen tüm soruları
araştırdık. Köpeğinizin her daim sadık, sevgi dolu ve sevecen tavırlara sahip olması için, yavru köpek eğitimi alması gerektiğini unutmayınız.
Köpeğinizin doğru bir eğitim alması için 21 adımda yavru köpek eğitimi sizlerde!
avodart
This information is worth everyone’s attention. When can I find out more?
Memoriqq
I don’t even know how I finished up here, but I assumed this put up was good.
I do not recognise who you are however certainly you’re going to a well-known blogger for those who are not already.
Cheers!
lawyer salary
Average Lawyer Salary
lawyer salary provide advice and recommendations to clients regarding their legal rights and
obligations. Also known as an attorney, a lawyer represents individuals and businesses during
legal proceedings and disputes. Lawyers’ customers may incorporate people, gatherings, or
organizations. Lawyer work incorporates looking into pertinent laws and earlier court
decisions, getting ready authoritative archives, and, when essential, contending cases
in court.
Through their instruction and work understanding, lawyers can have
practical experience in
various territories including social equality, business law, movement law, and protected
innovation.
Many people wish to become a lawyer because of the salary in this profession is higher than
in other jobs. To get a job that requires applicants
to have a legal degree, it is important to
pass a national or state licensure examination. In addition, it is also
essential to weigh the
advantages and disadvantages of opportunities from companies, agencies, and organizations
before accepting a job offer.
Lawyer Salaries usually range from $40,000 to $120,000.
However, to maximize the
opportunities offered to them, it is important that they specialize in different fields.
lawyer salary
Average Lawyer Salary
lawyer salary provide advice and recommendations to clients regarding their legal
rights and
obligations. Also known as an attorney, a lawyer represents individuals and businesses during
legal proceedings and disputes. Lawyers’ customers may incorporate people, gatherings, or
organizations. Lawyer work incorporates looking into pertinent laws and earlier court
decisions, getting ready authoritative archives,
and, when essential, contending cases in court.
Through their instruction and work understanding, lawyers can have practical experience in
various territories including social equality, business
law, movement law, and protected
innovation.
Many people wish to become a lawyer because of the salary in this profession is higher than
in other jobs. To get a job that requires applicants to have a legal degree, it
is important to
pass a national or state licensure examination.
In addition, it is also essential to weigh the
advantages and disadvantages of opportunities from companies,
agencies, and organizations
before accepting a job offer.
Lawyer Salaries usually range from $40,000 to $120,
000. However, to maximize the
opportunities offered to them, it is important that they specialize in different fields.
instagram takipci hilesi
instagram takipci hilesi aracımız ile takipçi sayınızı yükseltebilirsiniz.
Bu aracımız sizlere özel ücretsiz bir şekilde çalışmaktadır.
Takipçi hilesi yaparak instagram da tanınmış bir kişi olmak artık çok basit.!
Instagram Beğeni Hilesi
Instagram beğeni arttırma hilesi yaparak instagram’da bulunan gönderilerinize
beğeni gönderebilirsiniz. instagram beğeni hilesi aracımız sizlere özel
ücretsiz olarak çalışmaktadır.
Video Görüntülenme Hilesi
İnstagram videolarınıza görüntüleme yaptırabilirsiniz.
Videolarınızın görüntülenme sayısı hızlı bir şekilde artar.
Video Görüntülenme Hilesi ile
Instagram Unfollow Yapma
İnstagramda sizi takip etmeyen kullanıcıları tespit edip, takibi bırakabilirsiniz.
Bu hizmetimiz de ücretsiz. Sadece giriş yapmanız
yeterli.
İnstagram Takipçi Hilesi Nasıl Kullanılır?
Ücretsiz instagram takipçi hilesi, instagram beğeni hilesi, instagram canlı yayın ve hikaye hilelerinizi
platformumuzda bulabilirsiniz. İnstagram takipçi hilesi sistemimizden her
saat +200 kredi kazanabilirsiniz. Tamamı yüzde yüz gerçek
kullanıcılardan olup bot hesaplarımız bulunmamaktadır.
İnstagram takipçi hilesi ve beğeni özelliğini kullanarak hızlı bir şekilde keşfet
olarak adlandırılan bölüme düşebilirsiniz.
Üstelik tamamı ücretsiz.
Wilson Ellars
Join for free to exchange clothes, toys, accessories, librtos and video games in your city. https://swaphouse.net/
Fastandy
I needed to thank you for this very good read!! I certainly loved every bit of it. I have got you bookmarked to look at new things you post…
web site
site indexletme çalılşması. Bionluk backlinks kullanıcısı.
monitor
Hi, i believe that i noticed you visited my website thus i
came to go back the favor?.I am attempting to to find issues
to enhance my website!I assume its adequate to use a few of your concepts!!
Elle Blonde
That is a really good tip particularly to those fresh to the blogosphere. Simple but very precise info… Thanks for sharing this one. A must read article!
forex trading
Thanks for any other informative site. Where else may I get that type of information written in such a perfect way?
I’ve a mission that I’m just now working on, and I’ve been on the glance
out for such info.
ww88
Keep on working, great job!
Wholesale CBD Oil
I’ve read some just right stuff here. Certainly price bookmarking for revisiting. I surprise how so much effort you set to make this type of wonderful informative site.
ww88
I am regular reader, how are you everybody? This post posted at this web page is really nice.
Love Irrigation
This is the perfect website for anyone who hopes to find out about this topic. You realize so much its almost tough to argue with you (not that I personally would want to…HaHa). You definitely put a fresh spin on a topic which has been discussed for decades. Wonderful stuff, just wonderful.
free Robux Generator
Right here is the right webpage for everyone who wants to understand this topic.
You know a whole lot its almost hard to argue with you (not that I really would
want to…HaHa). You definitely put a brand new spin on a topic that’s been written about for decades.
Wonderful stuff, just excellent!
frosted office door
Join for free to exchange clothes, toys, accessories, librtos and video games in your city. https://swaphouse.net/
north face fleece jacket
Today, I went to the beach with my children. I found a sea shell and gave it to my 4 year old daughter and said “You can hear the ocean if you put this to your ear.” She put the shell to her ear and screamed. There was a hermit crab inside and it pinched her ear. She never wants to go back! LoL I know this is totally off topic but I had to tell someone!
here
Fantastic piece of writing here1
Alexander the Great Greek
I am sure this piece of writing has touched all the internet
visitors, its really really pleasant article on building up new webpage.
Alexander the Great Greek
Good post. I learn something totally new and challenging
on sites I stumbleupon every day. It will always
be exciting to read through content from other
authors and use a little something from other sites.
improve health
I am really loving the theme/design of your web site. Do you ever run into any
internet browser compatibility problems? A handful of my
blog readers have complained about my blog not working correctly in Explorer but looks great
in Opera. Do you have any tips to help fix this issue?
Teodoro Marenco
F*ckin’ awesome issues here. I am very glad to see your post. Thanks a lot and i am taking a look forward to touch you. Will you kindly drop me a e-mail?
how fast can I lose weight
You really make it seem so easy with your presentation but I find
this matter to be actually something which I think I would never understand.
It seems too complicated and very broad for me. I am looking forward for your next post,
I will try to get the hang of it!
Alexander the Great statue
Nice post. I was checking continuously this weblog and I am inspired!
Very useful information specially the closing
section 🙂 I take care of such info much. I used to be seeking
this particular info for a long time. Thank you and
best of luck.
Hoa Qua Sach Anh Xanh
Hey there, You’ve done a fantastic job. I’ll certainly digg it and personally recommend to my friends. I am sure they will be benefited from this web site.
steroide kaufen
Just wanna comment that you have a very nice web site, I enjoy the style and design it actually stands out.
Dalvey Sex Haus
What’s Happening i am new to this, I stumbled upon this I have found It positively helpful and it has helped me out loads. I hope to contribute & aid other users like its aided me. Great job.
We List Products
You have made some really good points there. I checked on the web for more information about the issue and found most people will go along with your views on this web site.
server tanıtım
Good day! I could have sworn I’ve been to this site before but after browsing through some of the articles
I realized it’s new to me. Nonetheless, I’m certainly delighted I came across it and I’ll be book-marking it and checking back frequently!
website
As the admin of this web site is working, no hesitation very rapidly it
will be renowned, due to its feature contents.
google sıra bulucu
En iyi ve ücretsiz google sıra bulucu araçları kullanarak bir
anahtar kelimede sitenizin google’ da kaçıncı sırada olduğunu
sorgulayabilirsiniz.
Floyd Biagini
Good post! We are linking to this particularly great article on our site. Keep up the good writing.
buy viagra cialis
cialis hacklink satın al.
Aconda
I really like it when individuals come together and share views. Great blog, continue the good work!
Hoa Qua Sach Anh Xanh
fantastic points altogether, you simply won a logo new reader. What may you recommend about your publish that you just made a few days ago? Any positive?
Best Massage Gun
Aw, this was a really nice post. Taking the time and actual effort to make a good article… but what can I say… I put things off a lot and don’t manage to get anything done.
web site
indexletme çalışması.
house wood door models
Thanks for the sensible critique. Me and my neighbor were just preparing to do some research on this. We got a grab a book from our local library but I think I learned more clear from this post. I am very glad to see such magnificent info being shared freely out there.
Hoa Qua Sach Anh Xanh
Hey there, You’ve done a fantastic job. I’ll definitely digg it and personally suggest to my friends. I am confident they’ll be benefited from this web site.
바카라사이트
Hi I am so delighted I found your web site, I really
found you by accident, while I was searching
on Digg for something else, Nonetheless I am here now and would just like to say
thanks a lot for a marvelous post and a all round entertaining
blog (I also love the theme/design), I don’t have time to browse it all at the moment but I have
book-marked it and also added in your RSS feeds, so when I
have time I will be back to read a great deal more, Please do keep up the superb work.
cheap escorts in texas
I’m excited to uncover this great site. I need to to thank you for ones time due to this fantastic read!! I definitely appreciated every part of it and I have you saved as a favorite to look at new stuff in your blog.
affiliate marketing for beginners
Hello there! This is my first comment here so I just wanted to give a quick shout out and tell you I truly enjoy reading
through your posts. Can you recommend any other blogs/websites/forums that
deal with the same topics? Appreciate it!
karisini escort sitesinde satan pic
karisini escort sitesinde satan pic
Attractions and Places to Visit in Coventry & Northampton
Hi there! I just wanted to ask if you ever have any problems with hackers?
My last blog (wordpress) was hacked and I ended up losing several weeks of
hard work due to no backup. Do you have any solutions to
protect against hackers?
free Robux
A person necessarily lend a hand to make significantly posts I might state.
This is the very first time I frequented your web page and up to now?
I surprised with the research you made to make this actual post amazing.
Fantastic task!
buy hacklink google
buzzoid hacklink buy viagra online.
Attractions and Places to Visit in Coventry & Northampton
This site was… how do I say it? Relevant!! Finally I have found something that helped me.
Thanks!
Iron Fist Extractors
It’s a shame you don’t have a donate button! I’d most certainly donate to this
excellent blog! I guess for now i’ll settle for book-marking and adding your RSS feed to
my Google account. I look forward to brand new updates and will share this website with my Facebook
group. Talk soon!
cannabis extractor
This excellent website truly has all the information and facts I wanted about this subject and didn’t know who to ask.
BHO extractor
Tremendous issues here. I’m very glad to see your post. Thanks a
lot and I am taking a look ahead to contact you. Will
you kindly drop me a mail?
hemp extractor
I love your blog.. very nice colors & theme. Did you create this website yourself
or did you hire someone to do it for you? Plz reply as I’m looking to create my own blog and would like to find out where u got this from.
cheers
hemp extractor
I have read several good stuff here. Definitely price bookmarking for revisiting.
I wonder how so much effort you put to make
any such wonderful informative site.
google hacklink cialis
cialis hacklink satın al.
google hacklink online
hacklink google online instagrowing.
W88 Thai
I’ve learn a few just right stuff here. Definitely value bookmarking for revisiting.
I wonder how so much effort you put to make this
type of excellent informative site.
먹튀검증
Hello, Neat post. There is a problem together with your web site in internet explorer, might check
this? IE nonetheless is the market leader and a large section of other people
will leave out your magnificent writing due to this problem.
W88 Thai
At this moment I am going to do my breakfast, when having my breakfast coming yet again to read additional news.
W88 Thai
This is my first time pay a quick visit at here and i am in fact happy to read all at alone place.
google hacklink online
hacklink google online idigic.
W88 Thai
Hi, all is going well here and ofcourse every one is sharing data, that’s
genuinely good, keep up writing.
buy viagra
hacklink google online idigic.
Hoa Qua Sach
Just a smiling visitant here to share the love (:, btw outstanding pattern .
anabolika kaufen
Great work! This is the type of information that should be shared around the web. Shame on Google for not positioning this post higher! Come on over and visit my website . Thanks =)
Avaluos en Cancun
I really like it when individuals get together and share ideas. Great site, stick with it!
Hoa Qua Sach
Howdy are using WordPress for your site platform? I’m new to the blog world but I’m trying to get started and set up my own. Do you require any coding knowledge to make your own blog? Any help would be greatly appreciated!
Hoa Qua Sach Anh Xanh
I appreciate, cause I found exactly what I was looking for. You’ve ended my four day long hunt! God Bless you man. Have a great day. Bye
putco pillar trim
Good day! This is my first comment here so I just wanted to give a quick shout out and say I genuinely enjoy reading your blog posts.
Can you suggest any other blogs/websites/forums that go over the same topics?
Thank you!
airline crew hotel
I was curious if you ever considered changing the layout of your site?
Its very well written; I love what youve got
to say. But maybe you could a little more in the way of content so people could connect with it
better. Youve got an awful lot of text for only having one
or 2 images. Maybe you could space it out better?
greek designers store
I don’t even know how I finished up here, however I thought this post was once good.
I don’t know who you are however definitely you’re going to a
famous blogger in case you are not already. Cheers!
Cheapest term insurance
Heya i’m for the first time here. I found this board and I to find It truly useful
& it helped me out much. I’m hoping to provide one thing again and help others
like you helped me.
door pillar replacement
With havin so much content and articles do you ever run into any issues
of plagorism or copyright infringement? My site
has a lot of unique content I’ve either created myself or outsourced but it appears a lot of it is popping it up
all over the internet without my agreement. Do you know any ways to help prevent content from being stolen? I’d really appreciate it.
adiabatic
Еverything iѕ very open with a very clear ⅾescription of the issᥙes.
It was truly infօrmative. Your website is very useful.
Tһanks for sharing!
airline hotel rate
Hey this is kind of of off topic but I was wondering if blogs use WYSIWYG editors or if you have
to manually code with HTML. I’m starting a blog soon but
have no coding skills so I wanted to get guidance from someone with experience.
Any help would be enormously appreciated!
Greek designers
Fantastic blog! Do you have any suggestions for aspiring writers?
I’m planning to start my own site soon but I’m a
little lost on everything. Would you suggest starting
with a free platform like WordPress or go for a paid option? There are so many options out there that I’m completely
confused .. Any tips? Cheers!
fettverbrenner kaufen
Good post and straight to the point. I am not sure if this is really the best place to ask but do you guys have any thoughts on where to hire some professional writers? Thank you 🙂
airline technology
These are really great ideas in on the topic of blogging.
You have touched some fastidious factors here. Any way keep up wrinting.
Shop car insurance rates
Wow, incredible blog structure! How lengthy have you ever been blogging for?
you make running a blog glance easy. The overall look of your site is great, let alone the content material!
greek designers shop
I really love your site.. Excellent colors & theme. Did you create
this website yourself? Please reply back as I’m hoping to
create my own blog and would like to find out where you got this from or just what the theme is called.
Appreciate it!
greek designers shop
First off I want to say terrific blog! I had a quick question which
I’d like to ask if you do not mind. I was curious
to know how you center yourself and clear your thoughts before writing.
I’ve had a hard time clearing my mind in getting my ideas out there.
I do take pleasure in writing but it just seems like the first 10 to
15 minutes tend to be lost just trying to figure
out how to begin. Any suggestions or tips? Kudos!
intelligent passenger management
Hello there! This article couldn’t be written much better!
Going through this post reminds me of my previous roommate!
He always kept talking about this. I most certainly will send this
article to him. Pretty sure he’s going to have a good
read. Thanks for sharing!
viagram satın al online
https://www.fivesosyalmedya.com/tik-tok-takipci-satin-al/
21stbirthday present
When I initially commented I clicked the “Notify me when new comments are added” checkbox and now each time a comment is added I get several emails with the same comment.
Is there any way you can remove me from that service? Thanks!
physical fitness
It’s in fact very complicated in this busy life to listen news on Television,
so I simply use internet for that reason, and obtain the latest information.
http://tamiledirectory.com/?option=com_k2&view=itemlist&task=user&id=496986
Neat blog! Is your theme custom made or did you download it
from somewhere? A design like yours with a few simple tweeks would
really make my blog stand out. Please let me know where you got your design. Many thanks
retirement
Hey! I just wanted to ask if you ever have
any trouble with hackers? My last blog (wordpress) was hacked and I ended up losing many months of hard work due to no backup.
Do you have any methods to prevent hackers?
crt tv disposal
You could certainly see your enthusiasm in the article
you write. The arena hopes for more passionate writers such
as you who aren’t afraid to mention how they believe.
All the time follow your heart.
http://tangoyatra.com/?option=com_k2&view=itemlist&task=user&id=110805
Highly descriptive blog, I liked that bit. Will there be a part 2?
starting a business
I just like the helpful information you supply in your articles.
I’ll bookmark your weblog and take a look at again right
here regularly. I am slightly sure I will be informed
a lot of new stuff right here! Best of luck for the
following!
http://www.cooplareggia.it/?option=com_k2&view=itemlist&task=user&id=4447379
When I originally commented I clicked the “Notify me when new comments are added” checkbox and now
each time a comment is added I get three e-mails with the same comment.
Is there any way you can remove me from that service?
Thanks a lot!
http://spargelgut-meyer.de/?option=com_k2&view=itemlist&task=user&id=393544
It’s going to be end of mine day, except before ending I am reading this enormous
paragraph to improve my experience.
invoice reconciliation
WOW just what I was searching for. Came here by
searching for aircrew transportation
tacoma glove box letters
Magnificent website. A lot of helpful information here.
I’m sending it to some pals ans also sharing in delicious.
And certainly, thanks to your effort!
Cheap term life insurance
You have made some good points there. I looked on the
net for more info about the issue and found most individuals will go
along with your views on this website.
http://andraderodriguesadv.com.br/index.php/component/k2/itemlist/user/410504
You should be a part of a contest for one of the
most useful websites on the web. I will highly recommend this site!
Kratom Sulawesi
I like reading an article that can make people think. Also, thank you for permitting me to comment.
electronics recycling chicago
Yes! Finally someone writes about free tv recycling.
laptop recycling
What’s up to all, the contents present at this
website are genuinely amazing for people experience,
well, keep up the good work fellows.
electronics recycling chicago
Now I am ready to do my breakfast, after having my breakfast coming again to read more news.
Bullying Therapy London
Thanks for these guidelines. One thing I should also believe is the fact that credit cards offering a 0% apr often appeal to consumers together with zero interest rate, instant endorsement and easy on the web balance transfers, however beware of the top factor that will void that 0% easy road annual percentage rate as well as throw you out into the poor house fast.
laundromat delivery service
Great website. Lots of helpful information here. I am sending it to a few friends ans also sharing in delicious. And of course, thanks on your sweat!
sling tv best package 2020
I think everything posted made a lot of sense. However, consider
this, suppose you added a little content? I ain’t suggesting your information is not
solid, however what if you added a post title that grabbed a person’s attention? I
mean Enrollment, Tuition, and Discount Rate: The Sweet
Briar Story, Part 3 – Unsolicited Guru is a little plain.
You should look at Yahoo’s front page and watch how
they create post titles to grab viewers to click. You might add a related video or a related picture or two to grab people excited about what you’ve got
to say. Just my opinion, it might bring your posts a little bit more interesting.
child porn
hacklink google online instagrowing.
www
Good information. Lucky me I recently found your blog by accident
(stumbleupon). I’ve saved as a favorite for later!
buy hacklink online
hacklink google online instagrowing.
web site
web indexletme işlemi.
forex
Aw, this was an exceptionally good post. Finding the time and actual effort
to produce a top notch article… but what can I say… I hesitate
a lot and don’t manage to get nearly anything done.
cbd oil
Nice post. I learn something new and challenging on websites I stumbleupon on a daily basis. It will always be exciting to read content from other authors and practice something from their websites.
https://www.youtube.com/watch?v=cRXu4fS32Yk&t=354s
Thanks a bunch for sharing this with all people
you actually realize what you’re speaking approximately!
Bookmarked. Kindly also visit my web site =).
We can have a link alternate arrangement among us
cbd oil
I was very happy to uncover this great site. I want to to thank you for ones time for this fantastic read!! I definitely appreciated every little bit of it and i also have you book marked to check out new things in your site.
cbd oil
Having read this I thought it was extremely enlightening. I appreciate you taking the time and energy to put this article together. I once again find myself personally spending way too much time both reading and leaving comments. But so what, it was still worth it!
https://www.youtube.com/watch?v=dRnto7T2J-Q
This design is wicked! You obviously know how to keep a reader amused.
Between your wit and your videos, I was almost moved to start my own blog (well, almost…HaHa!) Great job.
I really enjoyed what you had to say, and more than that,
how you presented it. Too cool!
สล็อตออนไลน์ฟรีเครดิต
If you wish for to obtain a good deal from this article then you have
to apply these strategies to your won web site.
buy instagram followers
Dead written subject material, thanks for selective information. “Life is God’s novel. Let him write it.” by Isaac Bashevis Singer.
Gutscheine
I feel that is among the so much vital information for me. And i am happy reading your article. However want to observation on few normal things, The web site taste is ideal, the articles is really great : D. Excellent task, cheers
cast aluminum patio furniture
Usually I don’t learn post on blogs, however I wish to say that this write-up very forced me to check out and do it! Your writing taste has been amazed me. Thanks, very nice post.
Buy Indian handicraft products
Whats up very cool website!! Man .. Excellent .. Wonderful .. I’ll bookmark your blog and take the feeds additionally…I’m glad to search out so many helpful info right here within the post, we’d like work out more techniques on this regard, thanks for sharing.
lafargeholcim merger
Hello there, just became alert to your blog through Google, and found that it’s truly informative.
I am gonna watch out for brussels. I will appreciate if you continue this in future.
Many people will be benefited from your writing.
Cheers!
W88
It’s appropriate time to make some plans for the long run and it’s time to be happy.
I’ve learn this put up and if I may just I wish to recommend you some fascinating things or suggestions.
Maybe you could write next articles relating to this article.
I desire to learn even more things approximately it!
Absolute Paintless
I was recommended this website by my cousin.
I am now not sure whether this post is written by means of
him as no one else realize such distinctive approximately my
problem. You are incredible! Thanks!
W88
What’s up colleagues, its great article about tutoringand fully defined, keep it up all the time.
Digital Marketing Wilmington NC
My brother recommended I would possibly like this blog. He was once
entirely right. This put up truly made my day.
You can not imagine just how a lot time I had spent for this
info! Thanks!
branding
I’m not sure where you are getting your info,
but good topic. I needs to spend some time learning more or understanding more.
Thanks for magnificent information I was looking for
this info for my mission.
see the beginners guide
This post gives clear idea for the new visitors of blogging,
that actually how to do running a blog.
Best PDR Near ME
You actually make it appear so easy with your presentation however I to find this matter to be
actually one thing which I think I might by no means understand.
It seems too complex and very broad for me. I am taking a look ahead to your
next publish, I will try to get the hang of it!
lafarge holcim
Awesome post.
Buy Modafinil
Does your website have a contact page? I’m having trouble locating it but, I’d like to send you an email. I’ve got some creative ideas for your blog you might be interested in hearing. Either way, great website and I look forward to seeing it improve over time.
lafarge holcim
May I just say what a relief to uncover an individual who actually understands what they’re discussing over the internet.
You actually understand how to bring a problem to light and make it important.
More and more people have to read this and understand this side of the story.
It’s surprising you aren’t more popular since you surely possess
the gift.
fusion lafargeholcim
It’s remarkable to visit this site and reading the views of all colleagues
concerning this post, while I am also eager of getting knowledge.
fusion lafargeholcim
Have you ever considered about including a little bit more than just your
articles? I mean, what you say is valuable and everything.
Nevertheless just imagine if you added some great photos or video clips to give your posts more, “pop”!
Your content is excellent but with images and video clips, this website could undeniably be one of
the most beneficial in its niche. Good blog!
fusion lafargeholcim
After exploring a few of the articles on your web page,
I really appreciate your technique of writing a blog.
I bookmarked it to my bookmark site list and will be
checking back soon. Please check out my website
too and let me know what you think.
fusion lafargeholcim
Greetings from Florida! I’m bored to tears at work so I decided to
browse your website on my iphone during lunch break. I love the knowledge you provide here and can’t wait to take a look when I get
home. I’m amazed at how fast your blog loaded on my cell phone
.. I’m not even using WIFI, just 3G .. Anyways, wonderful site!
lafarge holcim
Greate pieces. Keep posting such kind of info on your page.
Im really impressed by your site.
Hey there, You have performed an incredible job.
I will certainly digg it and in my opinion recommend to my friends.
I’m sure they will be benefited from this web site.
lafarge holcim
Thanks a lot for sharing this with all folks you really recognize what you’re talking approximately!
Bookmarked. Kindly additionally consult with my web site
=). We can have a hyperlink change contract among us
lafargeholcim fusion
Useful information. Fortunate me I discovered
your web site by accident, and I am shocked why this accident
did not happened earlier! I bookmarked it.
lafargeholcim merger
Good replies in return of this issue with solid arguments and telling
the whole thing on the topic of that.
Lafargeholcim
Great delivery. Great arguments. Keep up the amazing work.
lafarge holcim
What i don’t understood is in truth how you are no longer really a
lot more well-appreciated than you might be right now.
You are so intelligent. You know thus considerably
with regards to this matter, produced me for my part consider it from a lot of varied angles.
Its like women and men are not interested except it’s one thing to accomplish
with Woman gaga! Your personal stuffs nice.
At all times care for it up!
fusion lafargeholcim
I think this is one of the most significant
information for me. And i am glad reading your article. But want to remark on few
general things, The web site style is ideal, the articles is
really nice : D. Good job, cheers
lafarge holcim
I don’t know whether it’s just me or if everyone else encountering problems
with your blog. It appears like some of the
text on your posts are running off the screen.
Can someone else please comment and let me know if this is happening to
them as well? This may be a problem with my browser because
I’ve had this happen before. Many thanks
fusion lafargeholcim
Howdy great website! Does running a blog similar to this take a large
amount of work? I’ve very little understanding of programming however I had been hoping to
start my own blog in the near future. Anyways, should
you have any recommendations or techniques for new blog owners please share.
I know this is off topic but I just needed to ask. Many thanks!
lafargeholcim fusion
Heya are using WordPress for your blog platform?
I’m new to the blog world but I’m trying to get started and set up my own. Do
you require any html coding knowledge to make your own blog?
Any help would be greatly appreciated!
Holidayation
Hello, I do believe your blog could be having browser compatibility problems. When I look at your website in Safari, it looks fine however, when opening in IE, it has some overlapping issues. I just wanted to provide you with a quick heads up! Besides that, fantastic website!
Lafargeholcim
Hi there! I just want to give you a huge thumbs up for
your great information you have here on this post. I am coming back
to your blog for more soon.
fusion lafargeholcim
What i do not realize is actually how you’re now not actually much more neatly-favored than you might be now.
You’re very intelligent. You know therefore considerably when it comes to this subject, made
me in my opinion believe it from so many varied angles.
Its like women and men are not involved unless it is one thing to accomplish with
Girl gaga! Your individual stuffs great. At all times handle
it up!
free Robux Generator
Hey there would you mind letting me know which web host you’re utilizing?
I’ve loaded your blog in 3 completely different internet browsers and I must say this
blog loads a lot quicker then most. Can you recommend a good
internet hosting provider at a honest price? Cheers,
I appreciate it!
Jeana Mccaffrey
IG
Lafargeholcim
Write more, thats all I have to say. Literally, it seems as though you relied on the video to make your point.
You obviously know what youre talking about, why waste your intelligence on just posting
videos to your blog when you could be giving us something enlightening to read?
free fortnite skins Generator
Your mode of telling all in this paragraph is actually pleasant,
every one be able to effortlessly know it, Thanks a lot.
fusion lafargeholcim
Howdy, i read your blog occasionally and i own a similar one and i was just wondering if you get a lot of spam feedback?
If so how do you prevent it, any plugin or
anything you can suggest? I get so much lately it’s driving me mad so any help
is very much appreciated.
maintenance company in dubai
You really make it seem so easy along with your presentation but I to find this matter to be really something that I think I would never understand. It kind of feels too complex and extremely vast for me. I’m looking forward in your subsequent post, I¡¦ll try to get the hold of it!
gay porn
you may have an excellent weblog right here! would you prefer to make some invite posts on my weblog?
udaipur escort service
You have mentioned very interesting points ! ps decent internet site . “We make ourselves a ladder out of our vices if we trample the vices themselves underfoot.” by Saint Augustine.
Burton Meister
RX
Elinor Ansell
TB
lafargeholcim fusion
I loved as much as you’ll receive carried out right here.
The sketch is attractive, your authored material stylish.
nonetheless, you command get bought an nervousness over that you wish be
delivering the following. unwell unquestionably come more formerly again as exactly the same nearly very often inside case you shield this increase.
Lafargeholcim
It’s going to be end of mine day, but before finish I am reading this great piece
of writing to increase my experience.
Nadine Allcot
PQ
Mark Sandes
YB
lafargeholcim fusion
Every weekend i used to pay a visit this web page, because i
wish for enjoyment, for the reason that this this site conations really
good funny data too.
lafargeholcim merger
Heya i am for the primary time here. I found this board and I
in finding It truly helpful & it helped me out
a lot. I hope to offer one thing back and help others such as you aided
me.
lafargeholcim merger
The other day, while I was at work, my sister stole my iphone and
tested to see if it can survive a 25 foot drop, just so
she can be a youtube sensation. My iPad is now broken and she has 83 views.
I know this is totally off topic but I had to share it with someone!
Amelie Hoskins
OT
lafarge holcim
Thanks for your personal marvelous posting! I really enjoyed reading it,
you’re a great author.I will be sure to bookmark
your blog and will come back down the road. I want to encourage
you to ultimately continue your great posts, have
a nice evening!
fusion lafargeholcim
Right away I am ready to do my breakfast, afterward having my breakfast coming again to read more news.
Lafargeholcim
Hi there Dear, are you actually visiting this website on a regular basis,
if so after that you will definitely take fastidious experience.
lafargeholcim fusion
I think everything posted was very logical. But, what
about this? suppose you added a little content? I ain’t saying your information is not good., but suppose you added a headline to possibly get people’s attention? I mean Enrollment, Tuition, and Discount Rate:
The Sweet Briar Story, Part 3 – Unsolicited Guru is a little boring.
You might glance at Yahoo’s front page and watch how they create post headlines to get people to
open the links. You might add a related video or a pic or two to get people interested about everything’ve written. In my opinion, it might make your
posts a little livelier.
Lafargeholcim
It’s great that you are getting ideas from this post as well as from our argument made at
this place.
Holidayation
I quite like reading through an article that will make people think. Also, thanks for permitting me to comment.
Stella Tonkin
CW
Holidayation
Oh my goodness! Amazing article dude! Many thanks, However I am experiencing troubles with your RSS. I don’t know the reason why I cannot subscribe to it. Is there anybody else having similar RSS problems? Anybody who knows the answer will you kindly respond? Thanks!
Charmain Messier
IE
Dwain Lithgow
ZD
lafargeholcim fusion
I feel this is among the such a lot vital information for me.
And i’m glad studying your article. But wanna remark on few normal issues, The web site taste is great,
the articles is truly great : D. Just right job, cheers
Lafargeholcim
Hi there, constantly i used to check website posts here in the early hours
in the morning, since i love to learn more and more.
Erica Guizar
XO
Elyse Necaise
KE
Karry Scheffler
UA
Lafargeholcim
I am sure this piece of writing has touched all
the internet viewers, its really really pleasant
article on building up new website.
Earnest Benedict
FR
Vicki Gann
OM
lafarge holcim
I feel this is among the most vital info for me.
And i’m happy reading your article. But want to
observation on some basic issues, The website style is perfect, the articles is
truly nice : D. Good job, cheers
Leandro Fallon
ZJ
Star Gaskins
CN
Lafargeholcim
Thanks for sharing your thoughts about lafarge holcim.
Regards
Tara MacBain
KY
Deon Dodery
IV
Elizbeth Honey
DC
cialis fiyat google hacklink
cialis hacklink güvenilir satın alma.
Minda Heaney
OV
freeinstafollowers
Good post. I learn something new and challenging on websites I stumbleupon on a daily basis. It will always be helpful to read content from other authors and use something from their sites.
Adrianna Bevan
DE
Motor Club Of America
It’s impressive that you are getting thoughts from this paragraph as well as from our dialogue made at this place.
Rosemary Olszewski
QO
Katja Jardine
HB
Marcela Finkel
FN
cialis fiyat porno izle
cialis hacklink güvenilir satın alma.
Muriel Mcclary
KY
Jewel Crump
SK
Natasha Hertzog
LG
get free vbucks
What’s up, just wanted to tell you, I liked this blog
post. It was helpful. Keep on posting!
Manuela Bloom
OX
cafe web sitesi
Cafe web sitesi, pastahane, restaurant vb.
mekanlar günümüzde insanların sık sık ziyaret ettiği vazgeçilmez mekanlar olmuştur.
Gençler daha çok cafeleri tercih ederken esnaflar lokantaları seçmekte.
Lokanta kültürü varlığını devam ettirmektedir. Peki mekanların internetteki varlığı ne durumda?
Malesef ülkemizde birçok işletmenin web sayfası bulunmamaktadır.
İnsanlar internetten mekan aramalarını çokça yapmaktadır.
Restaurantların web siteleri üzerinden rezervasyon yapmaları günümüz teknolojisinde ve bugünki web alışkanlığında daha kolaydır.
Yine web siteleri üzerinde harita ve ulaşım bilgileri açık
adres ve telefon numaraları bulunmalıdır.
Restaurant web sitesi aynı zamanda mobil uyumlu olmalıdır.
Site içeriği mobil cihazlarla da erişildiğinde tam kullanıcı deneyimi sağlamalıdır.
Web sitesi hızı iyi seviyede olmalı, kaliteli
bir hosting tercih edilmelidir. Temel seviyede dahi olsa
SEO ayarları mutlaka yapılmalıdır. SEO uyumlu olmayan web siteleri
kendi isimlerinde dahi aratıldığında Google, Yandex
vb. arama motorlarında çıkmamaktadır.
Bu durum işletmeler için prestij ve web siteleri için ziyaretçi
kaybıdır. Özellikle hizmetlerini mekanlarında veren işletmeler için bu durum
ciddi ziyaretçi kaybına yol açmaktadır.
Sonuç olarak en ideal web sitesi restaurant, cafe vb. mekanlar için Mobil uyumlu, SEO ayarları yapılmış
ve hızlı açılan sayfalardır. Mobil uygulama da barındırıyor ise ziyaretçileri
için gerçekten de harika bir iletişim
sağlanıyordur.
international driving permits
Hi! I could have sworn I’ve been to your blog before but after looking at a few of the posts I realized it’s new to me. Anyhow, I’m certainly delighted I discovered it and I’ll be book-marking it and checking back frequently!
Ted Carney
UP
Garnet Riddell
PH
Fidelia Quilty
QV
Anibal Favenc
DG
Brandi Quinn
IL
cialis fiyat viagra online
cialis hacklink güvenilir satın alma.
free fortnite skins Generator
Hey there! I simply want to offer you a huge thumbs up for your excellent info you’ve got right
here on this post. I will be returning to your website for more soon.
Erik Hatchett
EC
Free V Bucks Generator
I’d like to find out more? I’d like to find out more details.
Opal Mackey
PV
Denis Partridge
HA
international drivers licenses
This is a topic which is close to my heart… Take care! Where are your contact details though?
คาสิโนออนไลน์ ฟรี
dfg
I don’t even know how I ended up here, but I thought this post was good.
I don’t know who you are but definitely you’re going to a famous blogger if you aren’t already ;
) Cheers!
건마
Hi there, its fastidious post on the topic of media print, we all know media
is a impressive source of information.
Therese Gratwick
NO
Ronny Rowley
SZ
Napoleon Rendon
ZR
Debbra Villasenor
UH
Katja Baehr
SZ
international driver license
You’re so awesome! I don’t believe I have read through anything like that before. So wonderful to find somebody with some original thoughts on this issue. Really.. many thanks for starting this up. This website is one thing that’s needed on the web, someone with some originality.
Mae Terpstra
EA
Flor Kelson
IQ
cialis hacklink satın al
cialis hacklink güvenilir satın alma.
buy with love
Great information. Lucky me I recently found your blog by chance (stumbleupon). I’ve book-marked it for later!
Scott Abdul
CY
forex-consultant.com
I think this is among the most important information for me.
And i’m glad reading your article. But want to remark on few general things, The
site style is great, the articles is really nice :
D. Good job, cheers
online viagra
idigic porn online viagra.
buy with love
I blog quite often and I seriously appreciate your information. This article has truly peaked my interest. I’m going to take a note of your website and keep checking for new information about once a week. I subscribed to your Feed as well.
Albertina New
ZG
Donte Gutierrez
NX
buy with love
Very good info. Lucky me I found your site by accident (stumbleupon). I have bookmarked it for later.
Vickie Mondalmi
MT
Website Directory
Very good post. I definitely appreciate this site. Continue the good work!
morganite wedding set
Hi there! Someone in my Myspace group shared this site with us so I came to check it out. I’m definitely loving the information. I’m book-marking and will be tweeting this to my followers! Terrific blog and great design and style.
Shanna Ludwig
JD
Sara Schneider
IC
how to sell a home in lake butler
Hi there to all, how is everything, I think every one is
getting more from this web site, and your views are fastidious in support of new viewers.
IoT Security
Hi I am so grateful I found your web site, I really found you by accident, while I was
browsing on Bing for something else, Anyways I am here now and
would just like to say thanks for a remarkable post and
a all round exciting blog (I also love the theme/design), I don’t have time
to look over it all at the moment but I have bookmarked it and
also added in your RSS feeds, so when I have time I will be back to read a great deal
more, Please do keep up the superb b.
Emmett Nabors
UL
link
I enjoy looking through an article that can make men and women think.
Also, thank you for allowing me to comment!
Click here
I blog often and I really appreciate your information. The article has truly peaked
my interest. I’m going to bookmark your blog and
keep checking for new information about once a week. I subscribed to your RSS feed as well.
ehr data archiving
Whats up this is somewhat of off topic but I was wondering if blogs use WYSIWYG
editors or if you have to manually code with HTML.
I’m starting a blog soon but have no coding skills so I wanted to get guidance from someone
with experience. Any help would be enormously appreciated!
africa safari
Sweet blog! I found it while surfing around on Yahoo News.
Do you have any suggestions on how to get listed in Yahoo News?
I’ve been trying for a while but I never seem to
get there! Appreciate it
http://www.triestinagaeta.com/component/k2/itemlist/user/786348.html
Pretty nice post. I just stumbled upon your weblog
and wanted to say that I have truly enjoyed browsing your blog posts.
After all I’ll be subscribing to your rss feed and I hope you write again soon!
W88
If some one needs to be updated with most
up-to-date technologies afterward he must be visit this
website and be up to date everyday.
Meubel repareren
Do you have a spam issue on this website; I also am a blogger, and I
was curious about your situation; we have developed some nice practices
and we are looking to trade methods with other folks, please shoot me an e-mail
if interested.
sell a home in starke
Good information. Lucky me I ran across your blog by chance (stumbleupon).
I’ve saved as a favorite for later!
100% satisfaction guarantee or pay nothing
What’s up everyone, it’s my first pay a quick visit at this web page, and article is really fruitful for
me, keep up posting such articles.
top selling realtors in lake butler
Definitely believe that that you said. Your favourite justification seemed to be at the web the simplest factor to be aware of.
I say to you, I certainly get irked even as other people
consider worries that they plainly do not know about.
You managed to hit the nail upon the highest and also defined out
the whole thing with no need side effect ,
other people can take a signal. Will likely be
again to get more. Thanks
honeymoon in tanzania
Way cool! Some very valid points! I appreciate you penning this post and also the rest of the website is really good.
Brett Bellew
GP
unique safari tanzania
Thanks for the marvelous posting! I genuinely enjoyed
reading it, you might be a great author. I will be
sure to bookmark your blog and may come back
later on. I want to encourage one to continue
your great posts, have a nice holiday weekend!
how to sell a home in lake butler
Thanks for sharing your thoughts on how much is my home worth.
Regards
visit here
Because the admin of this web page is working, no hesitation very shortly it will be well-known, due to its quality contents.
africa safari tour
Hello there! I could have sworn I’ve been to this website before but after browsing through some of the post I realized it’s new
to me. Anyhow, I’m definitely delighted I found it and I’ll be bookmarking and checking back
frequently!
top real estate brokers in gainesville
Hello, I think your blog might be having browser compatibility issues.
When I look at your blog site in Chrome, it looks fine but when opening in Internet Explorer, it has some overlapping.
I just wanted to give you a quick heads up!
Other then that, fantastic blog!
noldu ananız sikildi mi?
noldu ananız sikildi mi?noldu ananız sikildi mi?noldu ananız sikildi mi?
Singapore
Hey there! Do you use Twitter? I’d like to follow you if that would be okay. I’m definitely enjoying your blog and look forward to new updates.
security guard jobs
I like the valuable information you provide in your articles. I will bookmark your blog and check again here regularly. I am quite certain I will learn many new stuff right here! Good luck for the next!
lice comb
My spouse and I stumbled over here by a different page and thought I might check things out. I like what I see so i am just following you. Look forward to finding out about your web page for a second time.
viagra
Great blog here! Additionally your web site loads up fast! What host are you the usage of? Can I get your affiliate hyperlink to your host? I wish my web site loaded up as fast as yours lol
Esmeralda Shippee
EV
Reinaldo
I think that everything said was actually very logical.
But, what about this? what if you composed a catchier post title?
I mean, I don’t want to tell you how to run your website, but what if you added
something that grabbed a person’s attention? I mean Enrollment, Tuition, and Discount
Rate: The Sweet Briar Story, Part 3 –
Unsolicited Guru is kinda boring. You ought to peek at Yahoo’s front page and see how they create news titles
to grab people to click. You might add a video or
a related picture or two to grab people interested
about what you’ve written. In my opinion, it might bring your posts a little
livelier.
Aline Thrash
NU
Merri Marsh
IL
sling tv
Oh my goodness! Amazing article dude! Many thanks, However
I am encountering problems with your RSS. I don’t know the reason why I am
unable to subscribe to it. Is there anybody getting
similar RSS issues? Anybody who knows the answer can you kindly respond?
Thanks!!
law
Excellent beat ! I wish to apprentice while you amend your website, how could i subscribe for a
blog web site? The account aided me a acceptable deal.
I had been a little bit acquainted of this your broadcast provided bright clear idea
Nell
Hi there fantastic blog! Does running a blog like this require a large amount of work?
I have very little knowledge of computer programming but I
was hoping to start my own blog soon. Anyway, should you have any ideas or techniques for new blog owners please share.
I understand this is off topic however I just needed to ask.
Appreciate it!
essay writing service reviews
I’ve read some good stuff here. Certainly worth bookmarking for revisiting. I wonder how much effort you put to create such a magnificent informative website.
webmodels
Heya i am for the primary time here. I came across this board and I
find It truly useful & it helped me out a lot. I hope to give one thing back and help others like you aided me.
Nichole Lampman
NM
Bernd Quarles
XR
aloe vera weight loss diet
Whoa! This blog looks just like my old one!
It’s on a completely different subject but it has pretty much the same page layout
and design. Great choice of colors!
circle lenses
We are a group of volunteers and opening a new scheme
in our community. Your site offered us with helpful information to work
on. You have performed a formidable activity and our whole group will likely be thankful to you.
kpop2 contacts
I don’t know whether it’s just me or if perhaps everybody else
encountering issues with your site. It seems like some of the written text
within your posts are running off the screen. Can someone else please provide
feedback and let me know if this is happening to them too?
This could be a issue with my internet browser because
I’ve had this happen previously. Appreciate it
รับจัดบุฟเฟ่ต์
hello!,I like your writing so much! proportion we be in contact more approximately your post on AOL?
I require an expert on this area to solve my problem.
May be that’s you! Looking forward to look you.
steroide online bestellen
Great amazing issues here. I?¦m very satisfied to peer your article. Thank you so much and i am taking a look forward to touch you. Will you please drop me a e-mail?
circle lenses
It’s great that you are getting thoughts from this piece of writing as well
as from our argument made at this place.
cheap circle lenses
I visited several websites except the audio quality for audio songs existing at this web page is in fact marvelous.
Rachael Cornejo
VT
colored contacts cheap
It’s going to be finish of mine day, however before
ending I am reading this impressive paragraph to improve my experience.
voittolinja
I have to thank you for the efforts you have put in writing this site. I am hoping to see the same high-grade content from you later on as well. In truth, your creative writing abilities has encouraged me to get my very own blog now 😉
web site
web site indexletme çalışması.
Zwischenlagerung
I was just searching for this info for some time. After six hours of continuous Googleing, finally I got it in your web site. I wonder what’s the lack of Google strategy that don’t rank this type of informative web sites in top of the list. Normally the top web sites are full of garbage.
emiten
I am really loving the theme/design of your website. Do you ever run into any internet browser compatibility problems? A couple of my blog visitors have complained about my website not operating correctly in Explorer but looks great in Firefox. Do you have any ideas to help fix this issue?
Charline McElhaney
YO
Mary Shand
OM
link url
I could not refrain from commenting. Perfectly written!
DC apartment movers
Thanks , I’ve recently been searching for info about this topic for ages and yours is the greatest I have found out till now. However, what about the conclusion? Are you sure in regards to the source?
Cameroun
I’ve read a few good stuff here. Certainly price bookmarking for revisiting. I surprise how so much attempt you set to make this kind of fantastic informative site.
Swing set assembly
hello!,I like your writing so a lot! share we keep up a correspondence more approximately your article on AOL? I require a specialist on this area to unravel my problem. Maybe that is you! Taking a look ahead to look you.
CBD Oil UK
Spot on with this write-up, I honestly feel this amazing site needs a lot more attention. I’ll probably be back again to read more, thanks for the info.
CBD Oil UK
This blog was… how do you say it? Relevant!! Finally I’ve found something which helped me. Cheers!
Deloras Heinz
WH
CBD Oil UK
I seriously love your site.. Excellent colors & theme. Did you build this amazing site yourself? Please reply back as I’m hoping to create my own personal website and would love to find out where you got this from or exactly what the theme is called. Kudos.
sübyan porno
çocuk pornosu,anal porn,annemi siktim,sübyan porno,karımı siktirdim,orosbu numaraları
Derek Torrance
FH
web site
web site backlink indexletme çalışması.
Young Geoghegan
QP
Franklin Murr
ZW
Shoutfeeds
Great article! We are linking to this particularly great content on our site. Keep up the great writing.
Free V Bucks Generator
It’s an amazing piece of writing in favor of all
the internet people; they will obtain benefit from it I am sure.
Shoutfeeds
Great article. I’m experiencing many of these issues as well..
More Help
I simply want to say I am just newbie to blogging and honestly loved you’re web blog. Probably I’m want to bookmark your blog . You amazingly have amazing writings. Many thanks for sharing your web page.
ketone blood meter
Great blog! Do you have any tips for aspiring writers?
I’m planning to start my own website soon but I’m a little lost on everything.
Would you recommend starting with a free platform like WordPress or
go for a paid option? There are so many options out there that I’m completely confused ..
Any suggestions? Many thanks!
Shoutfeeds
I was able to find good info from your blog articles.
anabole steroide kaufen
You are a very smart individual!
personal injury lawyer Rome Ga
Hello, this weekend is good designed for me, for the reason that this point in time i am reading this enormous
informative paragraph here at my house.
Noreen Avalos
ZT
kite spots sri lanka
Thank you for sharing your thoughts. I really appreciate your efforts
and I will be waiting for your next write ups thank you once again.
WordPress support plan
My partner and I stumbled over here by a different web page and thought I may as well check things out.
I like what I see so now i’m following you.
Look forward to looking at your web page yet again.
ketone urine test
Its not my first time to visit this web site, i am browsing this web site dailly and
take nice facts from here every day.
family law rome ga
Wow that was strange. I just wrote an incredibly long comment
but after I clicked submit my comment didn’t show up.
Grrrr… well I’m not writing all that over again. Anyway, just wanted
to say excellent blog!
Brandy Zimpel
KR
best wordpress hosting
Hello, I enjoy reading through your post.
I like to write a little comment to support you.
best-forex-companies.com
I every time emailed this weblog post page to all my contacts, because if like to read it afterward my contacts will too.
Jerold Woolls
YN
Jasper Griffin
LV
Virtual Server
hi!,I love your writing so much! percentage we communicate more
about your article on AOL? I need a specialist in this space to solve
my problem. May be that’s you! Taking a look forward to peer
you.
best wordpress hosting
Definitely believe that which you stated. Your favorite justification seemed to
be on the internet the easiest thing to be aware of.
I say to you, I definitely get irked while people think about
worries that they plainly do not know about. You managed to hit the
nail upon the top as well as defined out the whole thing without having side effect , people can take a
signal. Will likely be back to get more. Thanks
Steve Downes
PH
Latoya Lau
VY
personal injury lawyer Rome Ga
I’m not that much of a online reader to be honest
but your blogs really nice, keep it up! I’ll go ahead and bookmark your website to come back later.
Cheers
have a peek at this website
Excellent website you have here but I was wanting to know if you knew of any user discussion forums that cover the same topics discussed here? I’d really love to be a part of online community where I can get suggestions from other experienced people that share the same interest. If you have any suggestions, please let me know. Appreciate it!
Philipp Whitfeld
IF
Bernd Fry
YK
Horace Maitland
ZO
family lawyer rome georgia
WOW just what I was looking for. Came here by searching for
Work injury lawyer rome ga
Jeremy Fairley
MF
Celeste Odriscoll
ID
Greg Alprin
Saved as a favorite, I love your site!
Tammie Alonzo
LN
Theron Fifield
EE
try here
I haven¡¦t checked in here for some time as I thought it was getting boring, but the last several posts are great quality so I guess I¡¦ll add you back to my everyday bloglist. You deserve it my friend 🙂
Watch Jav Free HD
I am in fact pleased to glance at this web site posts which carries lots of valuable data, thanks for providing these statistics.
Tara O'Toole
ML
continue
Thanks for your personal marvelous posting! I actually enjoyed reading it, you may be a great author.I will be sure to bookmark your blog and will often come back in the future. I want to encourage one to continue your great job, have a nice evening!
Dollie Kuntz
WX
findbinaryoption.com
Thank you for the good writeup. It in fact was a amusement
account it. Look advanced to more added agreeable from you!
By the way, how could we communicate?
buy google hacklink
buy online hacklink viagra.
Virgen Monasterio
I blog frequently and I genuinely thank you for your content. This article has truly peaked my interest. I am going to take a note of your website and keep checking for new details about once a week. I opted in for your Feed too.
web site
web site indexletme.
Debbie Supple
XA
Basil Persse
OV
Lezlie Choiniere
Excellent site you have got here.. It’s difficult to find good quality writing like yours nowadays. I really appreciate individuals like you! Take care!!
testosterone propionato bodybuilding
Hi there, well put together websites you’ve right now. http://it.t-booster2020.com/testosterone-propionato-bodybuilding/
integratori per aumentare il pene
Great internet site! It looks very expert! Maintain the excellent job! http://bkproma.it/integratori-per-aumentare-il-pene/
http://de.t-booster2020.com/testosteron-einnehmen/
Howdy, very good webpage you’ve at this time there. http://de.t-booster2020.com/testosteron-einnehmen/
Judson Gonyea
MS
Charli Chuter
QG
Benedict Seidel
OU
Nadine Enderby
HJ
Brittney Bateson
UF
Roman Heydon
PQ
Jon Nilsen
OO
Maura Francisco
BE
Otis Rankine
MQ
Ludie Jessop
BY
DC movers
Thank you for all your labor on this web page. My niece takes pleasure in engaging in investigation and it’s really obvious why. A number of us hear all relating to the compelling tactic you offer priceless suggestions through your web blog and even invigorate participation from other people about this area of interest and our princess is now learning so much. Have fun with the rest of the new year. You’re doing a really good job.
the park at 14th
Terrific work! This is the type of information that should be shared around the net. Shame on Google for not positioning this post higher! Come on over and visit my website . Thanks =)
Sheena Viera
OO
Bitmoneyflow
Very good article! We will be linking to this great content on our site. Keep up the good writing.
Latasha Lindley
KE
Mariel Devries
QK
Clara Ehret
RP
Wilbert MacDevitt
EJ
Krista Moorman
MF
Bobbye Main
BF
Jann Wilkinson
VU
Free V Bucks
Hi, yeah this article is actually fastidious and I have learned lot of things from it about
blogging. thanks.
buy viagra online
buy online hacklink viagra.
agen sbobet online
Hello, I think your blog might be having browser compatibility issues.
When I look at your blog site in Safari, it looks fine
but when opening in Internet Explorer, it has some overlapping.
I just wanted to give you a quick heads up! Other then that, fantastic blog!
King Correia
QY
navigate to this site
There are definitely plenty of details like that to take into consideration. That could be a great point to convey up. I provide the ideas above as general inspiration but clearly there are questions just like the one you deliver up the place an important factor shall be working in sincere good faith. I don?t know if finest practices have emerged around things like that, but I am certain that your job is clearly recognized as a fair game. Each boys and girls feel the influence of only a moment’s pleasure, for the remainder of their lives.
scammer
Hi, I do believe this is an excellent web site. I stumbledupon it 😉 I’m going to revisit once again since I book-marked it. Money and freedom is the greatest way to change, may you be rich and continue to guide others.
Shelly Withnell
FC
http://bkproma.it/viaman-spray-forum/
Thanks meant for offering like terrific subject material. http://bkproma.it/viaman-spray-forum/
http://publica-pr.de/l-arginin-wechselwirkung/
I love the information on your site. Thank you so much! http://publica-pr.de/l-arginin-wechselwirkung/
testosteron verhogend eten
Wow, attractive site. Thnx … http://nl.testosteron.space/testosteron-verhogend-eten/
http://de.detoxyn.org/entgiftung-rauchen/
Thanks, this site is extremely valuable. http://de.detoxyn.org/entgiftung-rauchen/
http://de.detoxyn.org/entgiftung-vom-korper/
thank so much for your website it helps a great deal. http://de.detoxyn.org/entgiftung-vom-korper/
http://juventusdomo.it/aumentare-massa-o-forza/
Passion the website– extremely user friendly and whole lots to see! http://juventusdomo.it/aumentare-massa-o-forza/
balance pour musculation
With thanks! It is definitely an impressive web site! http://fr.musclemass.space/balance-pour-musculation/
online shopping with free shipping
It’s very simple to find out any matter on net as compared
to textbooks, as I found this paragraph at this web page.
Jasmin Viney
EE
testosteron missbrauch
Amazing, such a invaluable websites. http://de.testosteron.space/testosteron-missbrauch/
http://de.t-booster.org/protein-testosteron/
Love the website– very individual pleasant and great deals to see! http://de.t-booster.org/protein-testosteron/
http://publica-pr.de/erogan-tabletid/
Just wished to state Now i am lucky that i came in your web site. http://publica-pr.de/erogan-tabletid/
http://nl.musclemass.space/vetverbranding-spieropbouw/
Thanks meant for furnishing many of these good posting. http://nl.musclemass.space/vetverbranding-spieropbouw/
Tommy Sis
Nice post. I learn something totally new and challenging on websites I stumbleupon every day. It’s always helpful to read articles from other writers and use something from their sites.
Earlene Drennen
EY
http://fr.detoxyn.org/detoxification-by-water/
Thanks intended for supplying this sort of terrific details. http://fr.detoxyn.org/detoxification-by-water/
http://es.t-booster2020.com/funciones-de-la-testosterona/
Amazing such a advantageous webpage. http://es.t-booster2020.com/funciones-de-la-testosterona/
http://publica-pr.de/roter-ginseng-dosierung/
Many thanks extremely helpful. Will share site with my good friends. http://publica-pr.de/roter-ginseng-dosierung/
maxman gel como usar
say thanks to a lot for your site it aids a whole lot. http://leuxiaavis.fr/maxman-gel-como-usar/
http://bkproma.it/pompa-per-il-pene/
Wow cuz this is excellent work! Congrats and keep it up. http://bkproma.it/pompa-per-il-pene/
http://de.global-box.net/entgiftung-schmerzmittel/
Truly educational looking forth to coming back. http://de.global-box.net/entgiftung-schmerzmittel/
ganar masa muscular y perder grasa dieta
Thanks extremely handy. Will certainly share site with my good friends. http://bloggg.org/ganar-masa-muscular-y-perder-grasa-dieta/
Pet Life Today
I blog often and I really thank you for your information. This article has truly peaked my interest. I will book mark your site and keep checking for new information about once a week. I subscribed to your Feed too.
http://bloggg.org/adquirir-masa-muscular/
Keep up the good job and generating the group! http://bloggg.org/adquirir-masa-muscular/
manque de testostérone chez l homme symptomes
Thanks! This is an impressive internet site! http://fr.t-booster.org/manque-de-testosterone-chez-l-homme-symptomes/
Pet Life Today
This is a topic that’s near to my heart… Take care! Where are your contact details though?
meilleur testosterone injectable
Incredible such a valuable website. http://fr.t-booster2020.com/meilleur-testosterone-injectable/
ingrassare velocemente uomo
Great website you have in here. http://juventusdomo.it/ingrassare-velocemente-uomo/
http://fr.t-booster2020.com/racine-ortie-testosterone/
thank a lot for your website it helps a lot. http://fr.t-booster2020.com/racine-ortie-testosterone/
centro desintoxicacion alicante
I appreciate the knowledge on your websites. Thanks a ton. http://es.global-box.net/centro-desintoxicacion-alicante/
thongtac24h.com
I have been exploring for a little for any high-quality articles or blog posts on this sort of area . Exploring in Yahoo I at last stumbled upon this site. Reading this info So i am happy to convey that I’ve a very good uncanny feeling I discovered exactly what I needed. I most certainly will make certain to do not forget this site and give it a look regularly.
testosteron cda
Thanks, this website is extremely useful. http://de.t-booster2020.com/testosteron-cda/
http://fr.musclemass.space/tenue-femme-pour-musculation/
Love the website– really individual pleasant and great deals
to see! http://fr.musclemass.space/tenue-femme-pour-musculation/
http://fr.musclemass.space/comment-prendre-en-muscle-rapidement/
Excellent Web site, Maintain the beneficial job.
Many thanks. http://fr.musclemass.space/comment-prendre-en-muscle-rapidement/
http://it.testosteron.space/testosterone-farmacia-senza-ricetta/
Hi, good web page you have in here. http://it.testosteron.space/testosterone-farmacia-senza-ricetta/
xtrasize bestellen
Incredibly individual friendly site. Immense information available on couple of gos
to. http://publica-pr.de/xtrasize-bestellen/
http://bloggg.org/6-comidas-al-dia-masa-muscular/
Exceptionally individual friendly website. Enormous information offered on couple of clicks on. http://bloggg.org/6-comidas-al-dia-masa-muscular/
taufkirchen entgiftung
I love this website – its so usefull and helpfull. http://de.detoxyn.org/taufkirchen-entgiftung/
Micheal Descoteaux
QV
Shanice La Trobe
GD
http://de.t-booster.org/testosteron-bestimmen/
You’ve among the finest sites. http://de.t-booster.org/testosteron-bestimmen/
General contracting services fort worth tx
Thank you for every other fantastic post. The place else may just anybody get that kind of information in such an ideal manner of writing?
I have a presentation subsequent week, and I’m on the look for such
info.
http://fr.t-booster.org/dosage-testosterone-homme/
Thanks really practical. Will certainly share website with
my pals. http://fr.t-booster.org/dosage-testosterone-homme/
barrier tape
Awesome issues here. I’m very happy to peer your article.
Thank you a lot and I am looking ahead to contact you.
Will you kindly drop me a e-mail?
Fix Samsung
Thank you for the good writeup. It actually was once a entertainment account it.
Look advanced to far introduced agreeable from you! However, how could we
keep in touch?
cleanse max review
Whoa this is a advantageous online site. http://http:/ko21.fr/prix-member-xxl/
welke voeding is goed voor spieropbouw
Great website! It looks very professional! Maintain the excellent job! http://nl.musclemass.space/welke-voeding-is-goed-voor-spieropbouw/
testosteron wiki
Wow, such a invaluable web page. http://de.t-booster2020.com/testosteron-wiki/
w88club
What’s up every one, here every one is sharing these kinds of familiarity, so it’s nice to read this webpage,
and I used to pay a visit this blog all the time.
printed barrier tape
If some one wants to be updated with hottest technologies afterward he must be pay a quick visit this web page and be up
to date everyday.
Julienne Fryett
OM
Viruses repair for mobile devices
What’s up Dear, are you actually visiting this web site on a
regular basis, if so then you will definitely take nice experience.
fun team building activities
Howdy just wanted to give you a quick heads up.
The text in your article seem to be running off the
screen in Safari. I’m not sure if this is a formatting issue or something to do with browser
compatibility but I thought I’d post to let you know. The
design look great though! Hope you get the issue solved soon. Kudos
http://it.global-box.net/dieta-disintossicante-per-celiaci/
Many thanks! This is definitely an astounding web-site! http://it.global-box.net/dieta-disintossicante-per-celiaci/
http://juventusdomo.it/testogen-250/
thank so considerably for your internet site it aids a whole lot. http://juventusdomo.it/testogen-250/
General contracting services fort worth tx
Hello, Neat post. There’s a problem together with your web site in internet explorer, might
check this? IE still is the market leader and a huge element of other folks will pass over
your excellent writing due to this problem.
Marcelino Brookshire
HU
MCI Screening Test Passing rate
What’s up, this weekend is fastidious for me, because this point in time i am reading this great educational post
here at my home.
cause mancata erezione maschile
Love the site– extremely individual pleasant and great deals
to see! http://www.swift-italia.it/cause-mancata-erezione-maschile/
http://bkproma.it/metodi-per-allungare-pene/
Good Web page, Continue the very good work.
Thanks for your time! http://bkproma.it/metodi-per-allungare-pene/
Betsey Illingworth
QJ
Real Guest Post
Spot on with this write-up, I honestly believe that this website needs much more attention. I’ll probably be back again to read through more, thanks for the information.
Tom Spragg
WN
my web
I just want to mention I am newbie to blogging and honestly loved your website. Almost certainly I’m going to bookmark your blog . You amazingly come with exceptional articles and reviews. Thanks for sharing with us your webpage.
great value
What’s up, the whole thing is going fine here and ofcourse every
one is sharing information, that’s truly good, keep
up writing.
webdesign
Do you have a spam problem on this website; I also am a blogger, and I was wondering
your situation; many of us have created some nice practices
and we are looking to swap strategies with others, why not shoot me
an e-mail if interested.
ww88
Hurrah! After all I got a weblog from where I be capable of genuinely take useful data regarding my study and knowledge.
http://www.merccentre.com/?option=com_k2&view=itemlist&task=user&id=125524
This is really fascinating, You are an excessively professional blogger.
I’ve joined your rss feed and look ahead to in search of more of your
excellent post. Additionally, I’ve shared your site in my
social networks
918kiss
I’m not that much of a internet reader to be honest but your sites really nice, keep
it up! I’ll go ahead and bookmark your website
to come back later on. All the best
brigade banyan price
Hi, everything is going nicely here and ofcourse every one is sharing
data, that’s really good, keep up writing.
토토사이트
Wow! Finally I got a website from where I be capable of truly obtain valuable data concerning my study and knowledge.
918kiss
Hi! I know this is kind of off topic but I was wondering which blog platform are you using for this site?
I’m getting tired of WordPress because I’ve had problems
with hackers and I’m looking at alternatives for another platform.
I would be great if you could point me in the direction of a good platform.
http://nitistone.kz/component/k2/itemlist/user/42343.html
Appreciate this post. Will try it out.
great value
It’s really a nice and helpful piece of info.
I’m happy that you shared this useful info with us.
Please keep us up to date like this. Thank you for sharing.
Epic Placess
Everything is very open with a really clear explanation of the challenges. It was truly informative. Your website is very helpful. Thanks for sharing!
918kiss apk
I have been exploring for a little bit for any high quality articles
or weblog posts in this kind of house . Exploring in Yahoo I finally stumbled upon this website.
Studying this information So i’m happy to exhibit that I’ve an incredibly just right uncanny feeling I came upon exactly
what I needed. I such a lot for sure will make sure
to don?t forget this website and provides it a glance regularly.
DC day party
Its great as your other blog posts : D, appreciate it for putting up. “The art of love … is largely the art of persistence.” by Albert Ellis.
webdesign
Having read this I believed it was really informative.
I appreciate you finding the time and effort to put this
article together. I once again find myself personally spending a lot of time
both reading and posting comments. But so what, it was still worth it!
security companies in redlands ca
bookmarked!!, I love your web site!
security companies in victorville ca
Its like you read my mind! You appear to know so much about this, like you wrote the book in it or something.
I think that you can do with a few pics to drive the message home a little bit, but other than that, this is great blog.
A great read. I’ll definitely be back.
안전놀이터
Valuable information. Fortunate me I found your website accidentally, and I’m shocked why this
coincidence didn’t came about in advance! I bookmarked it.
토토사이트
I would like to thank you for the efforts you have put in writing this blog.
I am hoping to check out the same high-grade content from you
in the future as well. In fact, your creative writing
abilities has inspired me to get my own site now
😉
안전놀이터
Pretty component to content. I simply stumbled upon your web
site and in accession capital to say that I acquire in fact loved account your blog posts.
Any way I’ll be subscribing to your augment or even I success you get right of entry to constantly quickly.
안전놀이터
Everything is very open with a clear description of the challenges.
It was truly informative. Your site is useful. Thank you
for sharing!
사설토토사이트
I think this is one of the most vital information for me.
And i am glad reading your article. But wanna remark on few general things, The site style is great, the
articles is really nice : D. Good job, cheers
travolocity
Marvelous, what a website it is! This web site gives useful
facts to us, keep it up.
사설토토사이트
Because the admin of this web site is working,
no doubt very quickly it will be well-known, due
to its quality contents.
918kiss
It’s hard to find experienced people on this topic, however, you sound like you know what
you’re talking about! Thanks
토토사이트
Thank you for sharing your thoughts. I truly appreciate your
efforts and I will be waiting for your further write ups thanks once again.
사설토토사이트
Greetings from California! I’m bored to death at work so I decided to browse your website on my iphone during lunch break.
I really like the info you present here and can’t wait to
take a look when I get home. I’m amazed at how fast your blog loaded on my mobile
.. I’m not even using WIFI, just 3G .. Anyhow, fantastic blog!
사설토토사이트
These are really wonderful ideas in regarding blogging. You have touched some fastidious factors here.
Any way keep up wrinting.
안전놀이터
I am sure this paragraph has touched all the internet visitors, its
really really nice paragraph on building up new web site.
토토사이트
Hello, i read your blog occasionally and i own a similar one and i was just
wondering if you get a lot of spam comments? If so how do you protect against it,
any plugin or anything you can suggest? I get so much lately it’s driving me insane so
any help is very much appreciated.
안전놀이터
I have read so many articles concerning the blogger
lovers however this paragraph is genuinely a fastidious paragraph, keep it up.
안전놀이터
What’s Happening i’m new to this, I stumbled upon this I’ve
discovered It absolutely useful and it has helped me out loads.
I am hoping to give a contribution & aid different customers like
its aided me. Good job.
web site
Keep on writing, great job!
사설토토사이트
This design is spectacular! You definitely know how to keep a reader
entertained. Between your wit and your videos, I was
almost moved to start my own blog (well, almost…HaHa!) Excellent job.
I really enjoyed what you had to say, and more than that, how you presented it.
Too cool!
사설토토사이트
Hi there just wanted to give you a quick heads up and let you know a few of the
pictures aren’t loading properly. I’m not sure why but
I think its a linking issue. I’ve tried it in two different web browsers and
both show the same outcome.
Deborah Titus
YR
사설토토사이트
Hi! I could have sworn I’ve been to this blog before but after browsing through some
of the post I realized it’s new to me. Anyhow, I’m definitely glad I found
it and I’ll be bookmarking and checking back frequently!
hacklink satın al
takipci.com.tr hacklink satın alarak sitenizi yükseltin.
web site
web site indexletme işi.
토토사이트
Hi there everyone, it’s my first pay a visit
at this web page, and article is truly fruitful for me, keep up posting
such articles or reviews.
Kellee Street
ZV
top5binarybrokers.com
Great blog here! Also your site loads up very fast!
What web host are you using? Can I get your affiliate link to your host?
I wish my web site loaded up as fast as yours lol
Nottingham Local News
Great blog! Do you have any suggestions for aspiring
writers? I’m hoping to start my own blog soon but I’m
a little lost on everything. Would you suggest starting with a free platform like WordPress or go for a paid option? There are so many choices out
there that I’m totally confused .. Any suggestions? Thanks!
Shopify
Howdy I am so excited I found your weblog, I really found you by
mistake, while I was looking on Aol for something else, Anyways I am
here now and would just like to say thanks a lot for a fantastic post and a all round entertaining blog (I also love the theme/design), I
don’t have time to look over it all at the moment but I
have bookmarked it and also added your RSS feeds, so when I have
time I will be back to read a great deal more, Please do keep up the awesome b.
google online viagra satın al
takipci.com.tr hacklink satın alarak sitenizi yükseltin.
Nottingham Times
you are really a just right webmaster. The site loading velocity is incredible.
It sort of feels that you are doing any unique trick.
Also, The contents are masterwork. you have performed a wonderful job
on this subject!
undercovercoid
Wow, this post is pleasant, my sister is analyzing these things, therefore I am going to let know her.
Shopify
Yes! Finally someone writes about Shopify.
Shopify
I’m gone to tell my little brother, that he should also visit this blog on regular basis to get updated from most
recent information.
brigade banyan
This text is worth everyone’s attention. How can I find out more?
brigade citadel metro
Hey I know this is off topic but I was wondering if you knew of any widgets I could add to my blog that automatically tweet my newest
twitter updates. I’ve been looking for a plug-in like this for quite some time and was hoping maybe you would have
some experience with something like this. Please let me know if you run into anything.
I truly enjoy reading your blog and I look forward to your new
updates.
brigade citadel hyderabad
This page really has all of the information I wanted about
this subject and didn’t know who to ask.
homepage
It’s the best time to make some plans for the future
and it’s time to be happy. I’ve read this post and
if I could I desire to suggest you some interesting things or advice.
Maybe you can write next articles referring to this article.
I desire to read even more things about it!
brigade citadel floorplan
For the reason that the admin of this web page is working,
no hesitation very rapidly it will be famous, due to its quality contents.
brigade banyan price
Now I am going to do my breakfast, when having my breakfast coming again to read more
news.
brigade citadel review
I need to to thank you for this wonderful read!!
I absolutely loved every bit of it. I have you bookmarked to check out new things you
post…
brigade citadel location
You actually make it seem so easy with your presentation but I find this topic to
be actually something that I think I would never understand.
It seems too complex and very broad for me. I’m looking forward for your
next post, I will try to get the hang of it!
brigade citadel sananth nagar
I blog quite often and I really thank you for your information. Your article has truly peaked my interest.
I’m going to book mark your blog and keep checking for new information about once a week.
I subscribed to your Feed as well.
brigade citadel location
Hello just wanted to give you a quick heads up. The text in your content seem to be running off the screen in Ie.
I’m not sure if this is a formatting issue
or something to do with internet browser compatibility but I figured I’d post to let
you know. The design look great though! Hope you get the
problem solved soon. Many thanks
brigade citadel review
Actually when someone doesn’t know afterward its up to other users that they will assist, so here
it takes place.
brigade citadel hyderabad
Good post. I definitely love this website. Stick with it!
brigade citadel price
Hello! I’ve been following your website for some
time now and finally got the bravery to go ahead and give you a shout out from Dallas
Tx! Just wanted to mention keep up the excellent
work!
brigade citadel hyderabad
Hi there, I want to subscribe for this web site
to get hottest updates, therefore where can i do it please
help.
brigade citadel
I’m now not sure where you are getting your info, but great topic.
I must spend some time studying much more or working out more.
Thank you for wonderful info I used to be in search of this info for my mission.
brigade banyan sanath nagar
You ought to take part in a contest for one
of the highest quality websites online. I’m going to recommend
this web site!
brigade banyan price
It’s a shame you don’t have a donate button! I’d most
certainly donate to this superb blog! I suppose for now i’ll settle for
book-marking and adding your RSS feed to my Google account.
I look forward to new updates and will talk about this blog with my Facebook group.
Talk soon!
brigade citadel sananth nagar
Hi there to every one, the contents present at
this website are really awesome for people knowledge,
well, keep up the good work fellows.
brigade citadel floor plan
You need to take part in a contest for one of
the highest quality blogs online. I most certainly will recommend this site!
brigade citadel price
I blog often and I really thank you for your content.
The article has really peaked my interest. I’m going to bookmark your
website and keep checking for new information about once per week.
I opted in for your Feed too.
brigade banyan floorplan
For most recent information you have to pay a quick visit world-wide-web and on internet I found this
web site as a most excellent web site for most up-to-date updates.
brigade citadel price
Hi, I do believe this is a great web site. I stumbledupon it
😉 I am going to revisit yet again since i have book marked
it. Money and freedom is the greatest way to change, may you be rich and continue to help other people.
brigade citadel sananth nagar
Hi there, You have done an excellent job. I’ll definitely digg it and personally recommend to
my friends. I’m sure they will be benefited from this website.
brigade banyan floorplan
I have been surfing online greater than three hours these
days, but I by no means discovered any attention-grabbing
article like yours. It’s lovely worth enough for me. In my opinion, if all website owners
and bloggers made excellent content as you did, the web will likely be much more
useful than ever before.
Julianne Real
Maintain the great work and producing in the crowd!
brigade banyan hyderabad
I am regular reader, how are you everybody? This piece of writing posted at this web page is genuinely fastidious.
brigade citadel price
I’m really enjoying the theme/design of your blog.
Do you ever run into any web browser compatibility issues?
A handful of my blog visitors have complained about
my site not working correctly in Explorer but looks great in Safari.
Do you have any ideas to help fix this issue?
brigade citadel hyderabad
It’s remarkable to pay a quick visit this website and reading the views of all
colleagues on the topic of this piece of writing, while I am also eager of getting experience.
brigade citadel hyderabad
Thanks for finally talking about >Enrollment, Tuition, and Discount
Rate: The Sweet Briar Story, Part 3 – Unsolicited Guru <Liked it!
Tructiepbongda8
Greetings! Very helpful advice within this post! It’s the little changes that will make the largest changes. Many thanks for sharing!
brigade citadel price
Very nice article, totally what I needed.
brigade citadel floor plan
I got this website from my buddy who informed me on the
topic of this website and now this time I am browsing this website and reading very informative articles
or reviews here.
free Robux Generator
I visited multiple sites however the audio feature for audio songs present at this web site is in fact excellent.
brigade citadel floor plan
Please let me know if you’re looking for a author for
your blog. You have some really great posts and I think
I would be a good asset. If you ever want to take some of
the load off, I’d absolutely love to write some material
for your blog in exchange for a link back to mine. Please blast me an e-mail if interested.
Thanks!
brigade citadel review
I’m really loving the theme/design of your site.
Do you ever run into any internet browser compatibility issues?
A small number of my blog readers have complained about my
site not operating correctly in Explorer but looks
great in Safari. Do you have any ideas to help fix this issue?
brigade citadel price
If you desire to improve your knowledge simply keep visiting this
web site and be updated with the latest news update posted
here.
Terri Magoffin
Maintain the great job and bringing in the crowd!
brigade citadel hyderabad
Hello there, just became aware of your blog through Google,
and found that it is truly informative. I am gonna watch out for
brussels. I’ll appreciate if you continue this in future.
Many people will be benefited from your writing.
Cheers!
Opal Cockle
thank a lot for your internet site it aids a great deal.
Anne Dodds
Thanks meant for furnishing such awesome subject material.
anabolika kaufen
so much superb info on here, : D.
Tructiepbongda8
Great site you have here.. It’s difficult to find good quality writing like yours these days. I truly appreciate individuals like you! Take care!!
Odette Bottrill
You have got the best online sites.
Buy Reductil online UK
It is really a nice and useful piece of info. I am glad that you shared this helpful info with us. Please stay us informed like this. Thanks for sharing.
Nannette Dunning
Great internet site! It looks really good! Sustain the good job!
Tructiepbongda8
bookmarked!!, I love your website.
Addie Cleburne
Many thanks really practical. Will share website with my pals.
ข่าวกีฬาฟุตบอล UFABET
This is very interesting, You are a very skilled blogger.
I’ve joined your rss feed and look forward to seeking
more of your magnificent post. Also, I’ve shared your web site in my
social networks!
เว็บแทงบอลออนไลน์
Heya! I know this is kind of off-topic but I needed to
ask. Does managing a well-established blog such as yours take a massive amount
work? I am brand new to blogging but I do write in my diary every day.
I’d like to start a blog so I will be able to share my own experience and views
online. Please let me know if you have any kind of ideas or tips for
brand new aspiring blog owners. Thankyou!
medical marijuana dispensaries near me
My relatives always say that I am wasting my time here at
web, except I know I am getting experience everyday by reading thes fastidious articles or reviews.
Kellee Smithson
Wow cuz this is great job! Congrats and keep it up.
Micki Smithies
You have one of the better webpages.
สมัครแทงบอล UFABET
What’s up, this weekend is fastidious in favor of me, because this time i am reading this enormous
informative paragraph here at my house.
Eartha Wingfield
Great web site! It looks extremely expert! Maintain the great job!
Lois Bejah
Incredibly insightful….look frontward to coming back.
Evie Sisley
Wow cuz this is very helpful job! Congrats and keep it up.
weed shop near me
This design is wicked! You most certainly know how to keep a reader entertained.
Between your wit and your videos, I was almost moved to start my own blog (well,
almost…HaHa!) Fantastic job. I really loved what you had
to say, and more than that, how you presented it. Too cool!
Pat Lacroix
Fantastic webpage you have in here.
เว็บคาสิโนออนไลน์
Excellent article! We are linking to this great content on our website.
Keep up the good writing.
Adolfo Nicolay
thank so much for your internet site it helps a whole lot.
Hayden Matteson
say thanks to a lot for your site it helps a great deal.
recreational weed near me
If you are going for finest contents like myself, simply visit this web page everyday because it offers feature contents, thanks
Tiffany Randell
Keep up the helpful work and bringing in the crowd!
Cara Thorton
Wow because this is extremely excellent work! Congrats and keep it up.
Tonja Hause
Basically wanted to say I am thankful that i stumbled in your page!
Kendra Singletary
Great looking internet site. Assume you did a great deal of your very own html coding.
Buy For Sale Penta Labs SARMs UK
My partner and I stumbled over here by a different page and thought I should check things out. I like what I see so now i’m following you. Look forward to going over your web page for a second time.
marijuana stores near me
I was suggested this website by my cousin. I am not sure whether this post is
written by him as nobody else know such detailed about my difficulty.
You’re amazing! Thanks!
Kristie Prowse
Much thanks! It is definitely an fantastic online site.
https://www.iptvtr.net/iptv-test-deneme/
iptv test 24 saatlik ücretsiz deneme.
เว็บคาสิโนออนไลน์
Ahaa, its good dialogue concerning this paragraph at this place at this webpage, I have read all
that, so now me also commenting here.
medical marijuanas dispensary near me
I am actually happy to glance at this web site posts which carries
plenty of helpful information, thanks for providing these statistics.
peptides
I view something truly interesting about your weblog so I saved to my bookmarks.
medical marijuanas dispensary near me
Having read this I believed it was really informative.
I appreciate you taking the time and energy to put this informative article
together. I once again find myself personally spending a lot of time
both reading and leaving comments. But so what, it was still worthwhile!
Adam Tindall
You have one of the better web-sites.
dispensary near me
When I originally commented I appear to have clicked the
-Notify me when new comments are added- checkbox and now every time a
comment is added I get 4 emails with the exact same comment.
There has to be an easy method you can remove me from that service?
Many thanks!
Marianne Digby
Amazing such a important internet site.
Adolph Garret
Many thanks very practical. Will share site with my pals.
Blake Weisz
Many thanks, this site is really practical.
Jamey Finn
You have the most impressive websites.
Federico Jersey
I like this site – its so usefull and helpfull.
Maryjo Drakeford
thank a lot for your web site it assists a whole lot.
Blythe Macgeorge
Many thanks extremely handy. Will certainly share site with my good friends.
Locksmiths Marple Bridge
Hey very interesting blog!
Lip Filler Horsham
Woah! I’m really enjoying the template/theme of this website.
It’s simple, yet effective. A lot of times it’s challenging to get that “perfect balance” between superb usability and appearance.
I must say you’ve done a fantastic job with this.
In addition, the blog loads very fast for me on Opera.
Outstanding Blog!
catalytic converters
Way cool! Some very valid points! I appreciate you penning this write-up plus the rest
of the site is really good.
Motor Club Of America
Its not my first time to visit this web page, i am
visiting this web site dailly and obtain pleasant data from here daily.
makeup artist
There is definately a great deal to find
out about this subject. I like all the points you’ve made.
bridal makeup
I was able to find good information from your content.
Motor Club Of America
Marvelous, what a webpage it is! This web site gives valuable
data to us, keep it up.
Chikankari
My spouse and I absolutely love your blog and find almost all
of your post’s to be what precisely I’m looking for. can you offer guest writers
to write content available for you? I wouldn’t mind writing a post or elaborating on a number of
the subjects you write with regards to here. Again, awesome web log!
Frederic Quong
Incredibly enlightening, looking onward to coming back.
Locksmiths Edgeley
My developer is trying to convince me to move to
.net from PHP. I have always disliked the idea because
of the expenses. But he’s tryiong none the less. I’ve been using
WordPress on a number of websites for about a year and am anxious about switching to another platform.
I have heard great things about blogengine.net. Is there a way I
can transfer all my wordpress posts into it?
Any help would be really appreciated!
Locksmiths Hale
I have read so many articles or reviews concerning the blogger
lovers however this post is genuinely a pleasant paragraph,
keep it up.
Lip Filler Horsham
Hello every one, here every one is sharing these
kinds of knowledge, therefore it’s nice to read this website, and I used to pay a quick visit
this website daily.
Boris Fortin
Many thanks, this site is very helpful.
Becky Flierl
Seriously, such a advantageous web page.
The Boot Store
hi!,I like your writing very a lot! percentage we keep
in touch extra approximately your post on AOL? I require a specialist in this house to solve my problem.
Maybe that’s you! Taking a look ahead to peer you.
Pakistani lawn
Hmm it looks like your site ate my first comment (it
was super long) so I guess I’ll just sum it up what I submitted and say, I’m thoroughly
enjoying your blog. I as well am an aspiring blog writer but I’m still
new to everything. Do you have any tips for inexperienced blog writers?
I’d genuinely appreciate it.
Clement Finnegan
Extremely individual friendly website. Tremendous info available on couple of gos to.
Free Robux Generator
I’m not sure exactly why but this web site is loading incredibly slow for me.
Is anyone else having this issue or is it a problem on my end?
I’ll check back later on and see if the problem still exists.
Childcare Wilmslow
My brother suggested I may like this web site. He used
to be entirely right. This submit actually made my day. You cann’t consider just how so much time I had spent for this info!
Thank you!
outboard motors yamaha
What’s up i am kavin, its my first occasion to commenting anywhere, when i read this paragraph i thought i could also make comment due to this brilliant piece of writing.
Madeline Porteus
I value the details on your website. Thanks for your time!
Estella Zakrzewski
Sustain the good work and generating the group!
Locksmiths Compstall
Currently it seems like Movable Type is the best blogging platform out there right now.
(from what I’ve read) Is that what you are using on your blog?
Locksmiths Hazel Grove
This site truly has all of the information I needed about this subject and didn’t know who to ask.
outboard motors yamaha
Aw, this was an exceptionally good post. Taking a few minutes and
actual effort to generate a superb article… but what can I
say… I put things off a lot and never seem to get anything done.
Quyen McKeel
Great looking web site. Assume you did a great deal of your very own coding.
Locksmiths Hazel Grove
Nice post. I was checking constantly this blog and I
am impressed! Extremely helpful information specifically the last
part 🙂 I care for such information a lot. I was seeking
this particular info for a long time. Thank you and
best of luck.
catalytic converters for sale
Keep this going please, great job!
Dan Paschall
You’re an extremely practical internet site; couldn’t make it without ya!
Locksmiths Barlow Moor
You can definitely see your skills within the article
you write. The arena hopes for more passionate writers like you who are not afraid
to say how they believe. Always go after your heart.
Lucile Glade
Your data is rather helpful.
Levi Edgley
You’re an extremely beneficial web site; could not make it without ya!
Veola Powlett
Really enlightening look frontward to returning.
Emery Hannam
You have got possibly the best online websites.
Vania Burbank
I adore this website – its so usefull and helpfull.
Yetta Nolen
Hello there, good internet site you’ve gotten presently.
tarotqq
Hi there very nice site!! Guy .. Excellent .. Superb .. I will bookmark your website and take the feeds also…I am satisfied to seek out numerous helpful information here in the put up, we want develop extra strategies in this regard, thank you for sharing.
Rochelle Pike
Thanks a bunch! This is definitely an awesome web page.
Ricky melodies
Usually I don’t learn article on blogs, however I wish to say that this write-up very compelled me to take a look at and do so! Your writing taste has been surprised me. Thanks, very great article.
anabole steroide kaufen Deutschland
I’ve recently started a website, the info you offer on this web site has helped me greatly. Thanks for all of your time & work.
Ouida Gulley
Unbelievably individual friendly site. Enormous information available on couple of clicks on.
Elma Maddock
Really this is a good websites.
Trilogy Fitness Tech
I blog frequently and I really appreciate your information. Your article has truly peaked my interest. I’m going to take a note of your blog and keep checking for new details about once a week. I opted in for your Feed as well.
Trilogy Fitness Tech
I really like it when individuals come together and share opinions. Great site, keep it up.
Trilogy Fitness Tech
This is a topic that’s near to my heart… Take care! Exactly where can I find the contact details for questions?
Simon Neuhaus
Passion the site– really user pleasant and lots to see!
Lon Bejah
Great looking internet site. Assume you did a bunch of your very own html coding.
Leah Schulte
Amazing Web site, Keep up the useful job. thnx!
Reggie McLaughlin
Seriously such a handy web-site.
Cortez Seiffert
Thanks! This a remarkable webpage!
Chantal Kruse
You’re a very helpful web site; could not make it without ya!
Willy Choate
Great internet site! It looks extremely professional! Sustain the good work!
Swing set assembly
This really answered my downside, thanks!
Fitness
Hi! I simply wish to give you a huge thumbs up for your great information you’ve got right here on this post. I’ll be returning to your site for more soon.
Lashawnda Allie
Many thanks very beneficial. Will share website with my friends.
series online
I’m extremely inspired along with your writing skills as smartly as with the structure on your weblog. Is this a paid subject matter or did you customize it yourself? Anyway stay up the excellent high quality writing, it’s rare to look a nice blog like this one these days..
Gino
My family members all the time say that I am wasting my time here at net, except I
know I am getting knowledge all the time by reading thes
good content.
Luciana Lade
GX
Loren Brill
Keep up the remarkable job !! Lovin’ it!
Margery Bocanegra
YQ
Jacki Briones
HC
Sang Ingamells
QN
Louise Mackinolty
VS
Dee Schwab
PQ
Denice Gatenby
GG
Winona Beeman
PZ
Quincy Logan
RY
Swing set assembly
Appreciating the commitment you put into your site and in depth information you offer. It’s nice to come across a blog every once in a while that isn’t the same old rehashed information. Wonderful read! I’ve bookmarked your site and I’m adding your RSS feeds to my Google account.
Leonie Roughley
Many thanks really helpful. Will share website with my buddies.
Sheree Norcross
WN
Cathleen Fryman
UV
Raquel Hodson
Really instructive….look forward to returning.
Johnie Navarro
EL
Colette Crumley
DE
Mitchel Gatlin
QB
Jon Wallin
BX
Donnell Oberle
YY
Leigh Gentry
VO
Lorri Roderic
RC
Veronique Lambrick
VJ
Maxwell Hartsock
LJ
Leonel Grover
HN
What you need to know about Diabetes
Next time I read a blog, Hopefully it does not fail me as much as this one. I mean, I know it was my choice to read through, nonetheless I really believed you would have something helpful to say. All I hear is a bunch of moaning about something you could possibly fix if you weren’t too busy searching for attention.
Uta Beebe
KD
Blanca Breeze
UO
Tami Farnsworth
EJ
Trey Mouton
LA
Edith Ackerman
BC
Bailey Earp
DP
Shayna Greville
DW
Brent Minaya
You’ve one of the greatest web pages.
Darrel Kinchen
CD
Everett Chambers
GF
Gudrun Benoit
UN
Wilford McNicoll
NE
Easy 3-Week Weight Loss Diet
bookmarked!!, I like your website.
Jennifer Grayson
GX
Clifton Benjafield
HF
Ward Banner
QJ
Elmer Tedeschi
AU
Leonel Blackham
SG
Erika Worthington
CF
Jamila Thalberg
NT
Andrew Whittemore
KE
Rosalina Mullagh
GS
Sara Lunsford
UZ
Jeramy Dellit
OX
Irwin Dubin
HD
Reva Kinne
I like reading your web site. Thank you so much!
Hayley Brewis
FY
Sabrina Curtin
KK
Rosemary Martinelli
JY
Abbie Barrett
MT
Celia Voss
say thanks to a lot for your site it aids a great deal.
Arron Spann
DO
Taylor Downard
MD
Carson Messina
FP
우리카지노
Article writing is also a fun, if you be acquainted with after
that you can write or else it is complex to write.
Gemma Malone
PD
Alexander Lillard
Great looking web site. Presume you did a great deal of your own coding.
Filomena Echols
QY
Magnolia Nunan
KD
Vanita Crump
BQ
Antoine Rickel
UK
Willian Whitis
LP
Michele Jarvis
OT
Jani Crenshaw
BY
Saul Shand
ND
Sherrie Freame
TX
Shelly Saywell
HF
Virgie Suggs
EJ
Loyd Nolette
JM
Daryl Ziemba
TV
Lavon Ison
QA
Melisa Gillam
Many thanks, this website is very beneficial.
Terra Vincent
TA
Trudy Loflin
AY
Archie Dube
Thanks for giving these kinds of fantastic content material.
Kristin Baylee
VN
Fannie Boyette
DV
Bernardo Holbrook
SQ
Julie Nicoll
AF
Christen Cocks
The knowledge is very intriguing.
Yolanda Flanigan
XL
India Visa for US Citizens
I’ve been browsing online more than 3 hours today, yet I never found any interesting article like yours.
It is pretty worth enough for me. Personally, if all
webmasters and bloggers made good content as you did,
the web will be much more useful than ever before.
Art Weir
GA
Willis Gosselin
NO
Kathleen Gambrel
WA
polymerase chain reaction
I’d like to find out more? I’d like to find out some additional
information.
Jaqueline Moreton
AP
Dusty Ramsbotham
PE
Ronda Julia
UT
Beulah Hatch
MG
Yvonne Longwell
SR
ww88
Thank you for any other informative web site. Where else could
I get that kind of information written in such a perfect approach?
I have a project that I’m just now working on, and
I’ve been at the glance out for such info.
Tegan Garran
FB
w88
I every time spent my half an hour to read this website’s articles or reviews every day along
with a mug of coffee.
ww88
This site certainly has all of the information and facts I wanted concerning this subject and didn’t know who
to ask.
Gus Bermudez
RT
Christy Henley
NQ
Pearl Hislop
PW
w88
Fantastic goods from you, man. I’ve be mindful your stuff previous to and you are just too great.
I really like what you’ve obtained here, really like what you are saying and the
way in which in which you assert it. You’re making it enjoyable and you continue to
take care of to keep it sensible. I cant wait to learn much more from you.
That is actually a terrific web site.
India Visa for US Citizens
We absolutely love your blog and find almost
all of your post’s to be just what I’m looking for.
can you offer guest writers to write content for yourself?
I wouldn’t mind publishing a post or elaborating on many of the
subjects you write about here. Again, awesome weblog!
Lashawnda Vanhoose
IX
Elva Chan
KW
Hazel Goldfarb
TB
Dorris Tate
Good Website, Preserve the wonderful job. Thanks!
Shelley Mill
NT
Ashlee Will
US
Demetrius Blackston
YN
http://blissasia.in/how-and-the-place-to-learn-music/
Nice blog here! Also your website loads up fast!
What host are you using? Can I get your affiliate link to your
host? I wish my website loaded up as fast as yours lol
Alisa Turriff
MX
https://kkpc.info/bez-rubriki-ru/how-one-can-listen-to-ambient-music/
Great post. I was checking continuously this blog and I am impressed!
Very useful info specially the last part 🙂 I care for such info a
lot. I was seeking this particular info for a very long time.
Thank you and best of luck.
Linette Ciantar
Wow because this is great work! Congrats and keep it up.
http://duque.co.uk/?option=com_k2&view=itemlist&task=user&id=307012
Admiring the dedication you put into your site and detailed information you present.
It’s nice to come across a blog every once in a while that isn’t the same out
of date rehashed information. Excellent read! I’ve saved your
site and I’m including your RSS feeds to my Google account.
Sean Diggs
Appreciate it! This is an remarkable web page!
w88
What’s up mates, how is all, and what you want to say about
this piece of writing, in my view its really amazing in favor of
me.
Connor Dullo
Nice webpage you’ve gotten right here.
Hanna Cockerill
I love browsing your site. thnx!
Hans Kopp
Incredibly individual friendly site. Great info available on couple of clicks.
Sommer Grabowski
Great looking internet site. Assume you did a great deal of your very own html coding.
https://learncenter.ru/2020/02/06/how-and-where-to-learn-music/
My developer is trying to persuade me to move to
.net from PHP. I have always disliked the idea because
of the expenses. But he’s tryiong none the less. I’ve been using WordPress
on numerous websites for about a year and am nervous about switching
to another platform. I have heard excellent things about blogengine.net.
Is there a way I can transfer all my wordpress content into
it? Any kind of help would be really appreciated!
ww88
It is appropriate time to make some plans for the future and it is time to be happy.
I’ve read this put up and if I may just I want to suggest you some interesting things or
advice. Maybe you could write next articles relating to this article.
I want to learn more things approximately it!
Ürün Standı
KheironStand, 2010 yılından itibaren kurumsal firmaların tüm saha teşhir ihtiyaçlarına eksiksiz olarak cevap vermektedir. Alanında yetişmiş uzman kadrosu ile, ihtiyaca yönelik stantları sizin için tasarlıyor ve üretiyoruz.
Cellofamily.Com
Hey there, I think your website might be having browser compatibility issues.
When I look at your blog site in Safari, it looks fine but when opening in Internet Explorer, it has some overlapping.
I just wanted to give you a quick heads up! Other then that,
superb blog!
Randall Beckman
BP
Sonia Mayers
ML
Holley Michaelis
SB
Star Bancks
CE
Schlüsseldienst München
You need to take part in a contest for among the finest blogs on the web. I will recommend this web site!
Dorie Cissell
CL
Otis Kallas
KC
best CBD oil for anxiety
You should be a part of a contest for one of the finest sites on the net. I most certainly will highly recommend this web site!
Chastity Theriot
I benefit from perusing your website. Thank you so much!
Trista McCarty
BB
Tuyet Ogrady
VP
Clara Scollen
WE
Lidia Antonio
PX
Rozella Soto
PF
Claudette Chesser
ZJ
Maddison Handley
Many thanks, this website is really handy.
nbastreams
Greetings from Idaho! I’m bored to death at work so I decided to browse your website on my iphone during lunch break. I enjoy the knowledge you present here and can’t wait to take a look when I get home. I’m shocked at how fast your blog loaded on my mobile .. I’m not even using WIFI, just 3G .. Anyways, awesome site!
Freddy Espinoza
BS
Velva Hooton
XC
Irene Higgs
YQ
Sbobet Asia Judi Online
Hello! Do you know if they make any plugins to help with Search Engine Optimization? I’m trying to get my blog to rank for some targeted keywords but I’m not seeing very good success. If you know of any please share. Cheers!
Antonia Glaspie
AR
Pat Wille
Love the website– very individual friendly and whole lots to see!
Ernestina Culp
You have got one of the best web sites.
Merlin Scobie
DC
Nina Staples
TX
Chanel Albright
KF
Valerie Broyles
JJ
Klaudia Aird
OI
Leonard Skillen
LG
Sara Glenny
EV
Kai Moeller
OT
Patrick Cleveland
GU
Brooke Dynon
YJ
Williemae Wilber
CA
Fleta Mebane
Many thanks extremely handy. Will share site with my good friends.
best CBD oil for anxiety
Excellent post! We will be linking to this particularly great article on our site. Keep up the good writing.
Louella Mclain
QS
Don Philpott
WP
Jacklyn Kleiman
JB
Denise Baeza
IN
Callie McLane
NB
Guy Marcum
CU
Latashia Tepper
WX
Shawn Bunting
JW
Kent Cleland
Wow, such a good websites.
Georgina Pettigrew
NV
Belle Hansell
BZ
Norberto Annois
WK
Manuela Fossey
Thanks intended for supplying many of these substantial post.
Leora Humphries
ZV
best CBD oil for anxiety
This is a topic which is close to my heart… Many thanks! Where are your contact details though?
Doyle Greenberg
GD
Tara Boatright
GX
Rosalinda Capuano
CZ
Jean Gist
PD
Gidget Krieger
Great web site! It looks really professional! Keep up the great job!
Jewel Dowdle
UB
Jacquetta Rawlins
UN
Katja Farmer
WC
Helaine Fryett
YF
Halley Cooper
QH
Shavonne Schurr
YA
Lizzie Mahaffey
RD
Angelo McGrowdie
IU
Stefan Butler
LL
Salvatore Kaufman
DU
Mirta Remer
I enjoy this site – its so usefull and helpfull.
Hayden Macklin
KJ
Val Schwab
OJ
Clay Gayle
UC
Trudi Neumayer
LL
Margret Boismenu
I treasure the details on your web site. Thanks a lot!
Scotty McLoud
TX
Benjamin Avera
Really had to point out I’m just pleased I came on your internet page!
Tracee Hargis
RF
Cameron Ivey
ZL
Juliane Payten
JW
Deanna Dedman
AY
Alfred Daves
Thanks for providing like superb post.
Alvin Hawdon
QF
Christi Tozier
MF
Elliot Barnette
RJ
Bud Worsnop
ZT
Gita Weiner
DM
Brendan Robillard
Great website! It looks extremely expert! Sustain the great work!
Leonardo Moulds
XQ
Ismael Stowers
XV
Hung Mattingley
PJ
Shirley McCourt
OP
Rafaela Broadhurst
WP
Lincoln Tryon
MJ
Elliott Cazneaux
AN
Spencer Appel
ZY
Reginald Criswell
HT
Suzanna Parmer
SL
Zara Leija
CE
Annett Bonney
NZ
Leonardo Seal
YD
Tara Bruner
DO
Emilia Shively
IB
Alba Bromilow
WO
Leandro Streeton
HN
Stephania McAlroy
Just wished to express I am just delighted I happened in your website page.
Bailey Crampton
CS
Demetrius Tilley
Your tips is very helpful.
Prince Fitz
LX
Brayden Halpern
SG
Nina Oakley
MO
Walter Rodd
VF
Kristine Martell
ML
Christoper Whitt
HS
Magda Beauregard
IT
Software
I’m not that much of a internet reader to be honest
but your sites really nice, keep it up! I’ll go ahead and bookmark your website to come
back in the future. Cheers
Lizette Fanning
PP
Susanne Llamas
NO
Blondell Shelby
NE
Antonia Mahaffey
QN
Chara Randell
NY
Loretta Dillion
UH
WIX
Howdy very nice web site!! Guy .. Beautiful ..
Superb .. I will bookmark your blog and take the feeds also?
I am happy to find numerous helpful info right here within the submit,
we want develop more techniques on this regard, thanks for
sharing. . . . . .
WIX
This site was… how do you say it? Relevant!! Finally I’ve found something that
helped me. Thanks a lot!
Camille Mansfield
HL
Joe Johnson
DG
Emery Church
PA
โต๊ะจีน
I don’t know whether it’s just me or if
everybody else experiencing problems with your blog.
It appears as if some of the written text on your content are running off the screen.
Can somebody else please provide feedback and let me know if this is happening to them too?
This might be a problem with my internet browser because I’ve had this
happen previously. Many thanks
Chester Nan
SR
Sherry Coode
VV
Fanny Carr
JB
Carey McCranie
ND
Sanford Frey
VI
https://Youtu.be/
I visited various web sites but the audio feature for audio songs existing at this site is
truly fabulous.
Margart Killough
IJ
Huey Swank
YO
Rigoberto Webb
CG
Joel Nothling
SW
JOBSMART
Excellent way of explaining, and nice paragraph to take data
on the topic of my presentation topic, which i am going to present in college.
heta proof gloves
It’s a shame you don’t have a donate button! I’d certainly donate to this outstanding blog!
I guess for now i’ll settle for book-marking and
adding your RSS feed to my Google account. I look forward to brand new updates
and will talk about this blog with my Facebook group.
Talk soon!
Micheal Gabel
QD
JOBsm.ART Jobs Smart
A person essentially lend a hand to make severely articles I would state.
This is the very first time I frequented your website page and
up to now? I surprised with the research you made to make this actual submit amazing.
Excellent task!
Ingrid Stamper
XU
Vince Fahey
EB
Tyrone Boler
BG
Everett Hillard
CP
Alejandro Caron
DN
Lola Algeranoff
LP
WELL SOUL
Good post. I learn something new and challenging on websites I stumbleupon every day. It’s always useful to read through articles from other authors and use a little something from their sites.
Louann Paige
JT
Lyle Rason
LM
Bridgette Oshea
FI
Marylou Amiet
MI
Hallie Plunkett
YY
Laurinda Albritton
XB
Sasha Witcher
AU
Melanie Maye
BV
Vivian Bunton
TT
Gita Baltes
With thanks for sharing this cool website.
Kennith Samuel
JX
Coleman Jeffers
AZ
Fidelia Dailey
FU
Porter Grayson
WR
Lilla Prell
EK
Mamie Shah
Simply just wished to emphasize Now i am delighted I came onto your page!
Meridith Letcher
YH
Sang Dresner
Many thanks, this site is very beneficial.
nasledstvo po zaveschaniyu
I’m no longer sure the place you are getting
your information, but great topic. I must spend some time studying more
or figuring out more. Thanks for excellent information I used
to be in search of this information for my mission.
Kevin Osgood
XT
Keenan Durham
FN
Emilie Pounds
XY
fleck 5600sxt 48000 grain water softener
Hello! I just wanted to ask if you ever have any trouble with hackers?
My last blog (wordpress) was hacked and I ended up losing a few
months of hard work due to no data backup. Do you have any methods to stop hackers?
Elvin Valliere
FF
Jayne Kemper
GG
Thurman Mullis
XT
Betsey Bettencourt
RS
Clyde Henderson
KU
Denisha Perea
AD
Christine Powell
ZN
Silver spring hair salon
We are a gaggle of volunteers and opening a brand new scheme in our community. Your website offered us with useful info to work on. You’ve done a formidable job and our whole neighborhood will likely be grateful to you.
Malcolm Albertson
Whoa this is a good web-site.
Gia Gilson
Hey there, awesome internet site you have got presently.
Kennith Renner
VK
Tilly Cantara
KV
Jerrell Cadle
Amazing Webpage, Keep up the useful job. Appreciate it!
Free V Bucks Generator
This article will help the internet people for building up new weblog or even a blog from start to end.
Willian Florence
Simply just want to state I am just delighted I stumbled in your website page.
Elbert Proctor
ZY
Zelda Kappel
I love the content on your web site. Many thanks.
Allie Monds
WQ
Kimber Pawsey
Howdy, well put together webpage you’ve gotten there.
Alexandria Kovar
MF
Renaldo Callender
Incredible….such a beneficial website.
Genia Wiles
DK
Bonny Hughes
VC
Cynthia Wymark
DJ
Bridgett Loeffler
How goes it, good website you’ve there.
Gina Littlejohn
KI
Angelica McConnan
BJ
Deloras Broinowski
KY
Pool table assembly
I’d must test with you here. Which is not something I normally do! I get pleasure from studying a submit that can make people think. Also, thanks for allowing me to remark!
Dario Woolacott
NU
Hazel Kidston
JO
Sherrie Kling
BV
Dewey Roseby
Thanks a bunch! This is definitely an superb webpage!
Maureen Gain
PC
Kandy Brice
WL
Iola Shapiro
PE
Genesis Rivett
FN
Free Robux
Heya i am for the first time here. I came across this board and I
find It truly useful & it helped me out a lot. I hope to give something back and aid
others like you helped me.
Brittney Arteaga
NM
Earnest Saxon
EO
Tina Kruger
MC
Dena Strahan
VN
Derrick Goloubev
OB
Fay Larry
Maintain the spectacular work !! Lovin’ it!
Jonah Schwing
LV
Merissa Meyers
YP
Blake Warfield
Great looking site. Think you did a great deal of your very own html coding.
Marti Davis
BX
Jewel Sawyer
I enjoy this site – its so usefull and helpfull.
Terra Flockhart
TB
Cleta Bozeman
QJ
Vania Raney
Truly….this is a handy web-site.
Stacy Shackleton
PI
Craig Upjohn
QH
Emelia Vera
SJ
Hester Guinn
JH
Rene Clibborn
Maintain the excellent work and generating the group!
Thao Wrenfordsley
AK
Delilah Darrow
PJ
Alethea Kersey
Love the website– really user friendly and lots to see!
Cherie Collee
SJ
Natisha Begin
I adore this site – its so usefull and helpfull.
Betty Playford
QP
Arnold Riemer
RZ
Nicholas Hamer
ON
Laurene Muncy
BE
Ferne Mark
BK
Rosario Silvers
Wow, attractive portal. Thnx …
Quentin Kirsch
LH
Jani Harms
SL
Chance Westbury
Great Web-site, Continue the beneficial work. Appreciate it!
Mazie Prichard
WC
W88
Hi there! I could have sworn I’ve been to this site before but
after browsing through many of the articles I realized it’s new to me.
Anyways, I’m definitely happy I came across it and I’ll be bookmarking it
and checking back often!
Michel Vasey
FR
Quentin Braun
FQ
โอลิมปิก 2020
I am extremely inspired with your writing skills and also with the layout in your blog.
Is that this a paid subject or did you customize it yourself?
Either way stay up the nice high quality writing, it’s rare to see a great
weblog like this one today..
Etta Beauvais
say thanks to so considerably for your website it helps a lot.
Kennith Escalante
I benefit from reading your website. Appreciate it!
jgl construction
There is definately a lot to know about this topic.
I love all the points you made.
Wesley Handfield
XZ
Merri Branch
TC
w88hello
Sweet blog! I found it while searching on Yahoo News.
Do you have any tips on how to get listed in Yahoo News?
I’ve been trying for a while but I never seem to get there!
Appreciate it
Benny Vine
RN
Trey Rischbieth
QF
national gridiron league
Definitely believe that which you stated. Your favourite reason appeared to be on the net the easiest factor
to take into account of. I say to you, I certainly get annoyed while folks
consider worries that they plainly do not recognise
about. You managed to hit the nail upon the top and also defined out the
whole thing with no need side effect , other folks can take
a signal. Will likely be again to get more.
Thanks
W88
Thank you for sharing your thoughts. I really appreciate
your efforts and I will be waiting for your further post thank you once again.
Bradly Rickert
JI
Theresa Preiss
WJ
Marlene Wiliams
Regards for sharing this cool internet site.
W88
Valuable info. Fortunate me I found your web site by chance, and I’m shocked why this coincidence didn’t came about in advance!
I bookmarked it.
Hannelore Tabor
DZ
รับจัดบุฟเฟ่ต์
Hurrah! After all I got a weblog from where I know
how to actually get useful facts concerning my study and
knowledge.
Octavio Nelms
LY
Luther Shell
Appreciate it! This a terrific web-site.
Randolph Carrasco
IL
Donte Cohn
KE
Mabel Franki
Wow cuz this is excellent job! Congrats and keep it up.
Titus Farmer
SC
Harvey Cheeseman
You’re a really helpful site; could not make it without ya!
Linnea Yeo
BT
w88
Hi! I just wanted to ask if you ever have any issues with hackers?
My last blog (wordpress) was hacked and I ended up losing many months of hard work due
to no backup. Do you have any solutions to protect against hackers?
Viola Ehmann
SA
Keesha Carlson
BZ
Suzette Genders
Thanks extremely handy. Will share site with my good friends.
Basil Vanguilder
YY
Cindy Regan
Superb web page you have going here.
w88
Unquestionably believe that that you stated. Your favorite reason appeared to be on the net the simplest thing to understand
of. I say to you, I certainly get irked at the same
time as other people consider concerns that they just
don’t realize about. You controlled to hit the nail upon the highest and also defined out the whole thing
with no need side-effects , other people can take a
signal. Will likely be back to get more. Thanks
Eric Pantano
Wow, beautiful site. Thnx …
Bailey Isabelle
RW
Angelika David
Exceptionally user friendly website. Great information available on couple of gos to.
Aurora Dorsett
The information is quite exciting.
Glenn Costa
Thanks pertaining to delivering this type of superb content material.
Winona Olsen
CX
Isabelle Adcock
You have one of the best internet sites.
Rhea Officer
Thanks extremely valuable. Will certainly share site with my pals.
Jason Shears
LD
Yukiko Rowlandson
MQ
Juliane Dominique
Thanks with regard to offering such superior details.
Gabriel Coombs
GD
buy cbd oil online
Very rapidly this website will be famous among all blogging and site-building users, due to it’s pleasant
content
Mabel Steel
I treasure the content on your internet site. Thanks for your time.
Rodney Keldie
IF
Orval Shipley
QS
best cbd oils
When I initially commented I clicked the “Notify me when new comments are added”
checkbox and now each time a comment is added I get three emails with the same comment.
Is there any way you can remove people from
that service? Thanks a lot!
Launa Pouncy
VO
Chu Martinez
NU
Mai Blake
Many thanks, this website is very useful.
Alana Preciado
Thanks a lot! This a remarkable online site.
Adam Martine
CW
buy cbd oil online
Hello it’s me, I am also visiting this site daily, this web page is truly good and the users are really sharing
nice thoughts.
cbd gummies
Attractive portion of content. I just stumbled upon your
website and in accession capital to assert that I acquire actually loved account your blog posts.
Any way I will be subscribing in your augment and even I achievement you get admission to constantly rapidly.
Latrice Rotton
Much thanks! This is definitely an incredible site!
best cbd oils
I every time spent my half an hour to read this website’s content every day along
with a mug of coffee.
best cbd oils
Hi friends, its enormous post on the topic of tutoringand completely explained, keep it up all the
time.
cbd oils
Howdy, i read your blog from time to time and i own a similar one and i was just curious if you get
a lot of spam remarks? If so how do you prevent it, any plugin or anything you
can advise? I get so much lately it’s driving me insane so any help is very much appreciated.
Danial Dickerson
Unbelievably individual friendly website. Huge information available on couple of clicks on.
Alejandrina Ranking
Love the website– really user friendly and whole lots to see!
buy cbd gummies online
Does your site have a contact page? I’m having a
tough time locating it but, I’d like to send you an e-mail.
I’ve got some suggestions for your blog you might be interested in hearing.
Either way, great blog and I look forward to
seeing it grow over time.
Ellis Durant
Keep up the spectacular job !! Lovin’ it!
Lorenza Faunce
Wow, stunning portal. Thnx …
buy cbd oil
Greetings from Colorado! I’m bored at work so I decided to
check out your website on my iphone during lunch break.
I enjoy the info you provide here and can’t wait to take a look when I
get home. I’m shocked at how fast your blog loaded on my phone ..
I’m not even using WIFI, just 3G .. Anyways, great site!
best cbd gummies
Its such as you learn my mind! You appear to understand so much about this,
such as you wrote the e book in it or something.
I believe that you just could do with some percent to pressure
the message home a little bit, but other than that, that is
wonderful blog. An excellent read. I’ll definitely be back.
buy cbd gummies online
I will immediately grab your rss as I can not in finding your e-mail subscription hyperlink or newsletter service.
Do you have any? Please allow me understand in order that I may just
subscribe. Thanks.
cbd oil
Amazing! Its truly remarkable piece of writing, I have got much
clear idea regarding from this post.
Anton Bird
VP
cbd oils
Hi, i read your blog from time to time and i own a similar one
and i was just wondering if you get a lot of spam remarks?
If so how do you prevent it, any plugin or anything you can recommend?
I get so much lately it’s driving me insane so any help is very much appreciated.
Camilla Enticknap
KK
Shane Claudio
You’re an extremely helpful site; couldn’t make it without ya!
cbd oil
Magnificent beat ! I would like to apprentice while you amend your
website, how can i subscribe for a blog web site? The account aided me a
acceptable deal. I had been tiny bit acquainted of this your broadcast provided bright clear idea
Trudy Vos
EZ
Philadelphia Pennsylvania divorce
Hi there, just became aware of your blog through Google, and found that it is truly informative. I’m going to watch out for brussels. I will be grateful if you continue this in future. Lots of people will be benefited from your writing. Cheers!
cbd oil buy
That is a really good tip particularly to those fresh to the
blogosphere. Short but very precise information… Thanks for sharing this one.
A must read post!
cbd oils
What’s Taking place i am new to this, I stumbled upon this I’ve
found It positively useful and it has helped me out loads.
I hope to give a contribution & aid other users like its aided
me. Great job.
Hildegarde Flockhart
RZ
Zak Broun
Very good website you’ve got in here.
Erma Donoghue
Thanks, this website is very beneficial.
Marissa Dyring
NQ
quad biking dubai price
These are really wonderful ideas in concerning blogging.
You have touched some nice factors here. Any
way keep up wrinting.
Theron Prewitt
Much thanks! It is definitely an very good web page!
Brigette Comeau
FE
Hassie Edmonson
LS
Ivory Troupe
ZZ
my website
you’re in reality a just right webmaster. The web site loading velocity is incredible. It sort of feels that you’re doing any distinctive trick. In addition, The contents are masterpiece. you’ve performed a great process on this topic!
Dessie Linthicum
SR
Samual Powers
SY
Phil Bachus
PQ
Stanton Kozlowski
Love the website– really user friendly and lots to see!
Hanna Vassallo
Wow, lovely site. Thnx …
Buster Burdick
Very educational….looking frontward to returning.
Zelda Hinkler
IZ
Esther Shirk
Wonderful website you’ve gotten there.
Luz Pickering
Sustain the helpful job and delivering in the crowd!
Buster McLean
KR
Aracelis Slapoffski
GD
Janna McLaughlin
ZP
Emerson Patteson
Incredible, this is a invaluable website.
Raleigh Honeycutt
Sustain the great job and bringing in the crowd!
Karolin Mackness
Wow, gorgeous site. Thnx …
Huge Male Secret Supplement
Good web site you have here.. It’s hard to find excellent writing like yours nowadays. I seriously appreciate people like you! Take care!!
w88
you are truly a good webmaster. The web site loading velocity is
incredible. It sort of feels that you’re doing any distinctive trick.
Moreover, The contents are masterwork. you have performed a magnificent task on this
topic!
Emilio Hauser
Great looking website. Assume you did a lot of your own html coding.
Gidget Nall
Incredibly individual pleasant website. Astounding information available on couple of clicks on.
Christoper Brentnall
MW
Newborn Photography
This excellent website certainly has all of the
info I wanted concerning this subject and didn’t know who to ask.
Reed Oberle
Thanks a lot for sharing this terrific web-site.
from this source
Thanks pertaining to discussing the following superb written content on your site. I ran into it on the search engines. I will check back again if you publish extra aricles.
Danielle Shanks
The material is incredibly helpful.
Bobbie Louque
You’ve got one of the best web-sites.
Trudy Dugan
Wow because this is excellent job! Congrats and keep it up.
Renaldo Dejesus
Wow, stunning site. Thnx …
boca raton luxury real estate
I used to be able to find good advice from your content.
w88 Thailand
Hi, i think that i noticed you visited my blog so i came to go back the choose?.I’m trying to to find things to enhance
my site!I guess its good enough to make use of a few of your concepts!!
gai lam tien tai da nang
My brother suggested I might like this blog. He was entirely
right. This post truly made my day. You cann’t imagine simply how much time I had spent for this information! Thanks!
Chase Ruggieri
IH
Bert Merz
YB
Kathrin Cropper
Thanks a bunch! It is an astounding online site!
Trey Kidwell
Thanks a bunch! This a astounding online site!
w88
Hmm it seems like your site ate my first comment (it was super long) so I guess I’ll just sum it up what I
had written and say, I’m thoroughly enjoying your blog.
I too am an aspiring blog writer but I’m still new to the whole thing.
Do you have any recommendations for novice blog writers?
I’d certainly appreciate it.
Marion Perin
XJ
w88
Hello! I simply would like to give you a big thumbs up for the excellent information you have got right here on this post.
I am coming back to your website for more soon.
Paypal Travel
Spot on with this write-up, I honestly believe that this amazing site needs much more attention. I’ll probably be returning to read through more, thanks for the information!
Drew Lemmons
I enjoy this site – its so usefull and helpfull.
w88
Having read this I thought it was rather enlightening.
I appreciate you taking the time and energy to put this information together.
I once again find myself personally spending a significant amount of time both reading and posting comments.
But so what, it was still worth it!
w88
When someone writes an post he/she maintains the plan of a user in his/her mind that how
a user can know it. So that’s why this post is outstdanding.
Thanks!
Naomi Stout
thnx for sharing your nice website.
Sommer Roemer
I value the content on your site. Appreciate it!
Florence Liversidge
CB
Jeremiah Alvarez
ID
Reina Fitzwater
thank a lot for your web site it assists a lot.
Paypal Travel
I was excited to find this great site. I want to to thank you for ones time just for this fantastic read!! I definitely really liked every bit of it and I have you saved as a favorite to see new stuff on your web site.
Randall Hagen
The stuff is quite exciting.
Ashley McKean
AW
Tiara Brass
AS
Cheryle Glasheen
KP
Willian McLaughlin
Amazing such a invaluable website.
Adalberto Hudgins
YR
Connie Glyde
RU
DMV furniture assembly
Definitely, what a magnificent blog and instructive posts, I will bookmark your blog.Have an awsome day!
Hildegard Winifred
I value the data on your website. Regards.
Free V Bucks
Ahaa, its nice dialogue concerning this piece of writing here at this
blog, I have read all that, so at this time me
also commenting here.
Elisabeth Shelby
Sustain the excellent work and producing in the group!
Best tools for PDF
You actually make it appear really easy along with your presentation however I find this topic to be really something that I feel I might by no means understand. It kind of feels too complex and very wide for me. I am having a look ahead to your subsequent submit, I¡¦ll attempt to get the grasp of it!
Mai Springfield
Rather instructive….looking forth to visiting again.
Sonja
Thanks for your marvelous posting! I truly enjoyed reading it,
you can be a great author.I will remember to bookmark your blog and may come
back sometime soon. I want to encourage you continue
your great job, have a nice day!
Rod Hyde
Good Web site, Maintain the good work. Regards!
Maddison O'Shanassy
Wow cuz this is extremely good job! Congrats and keep it up.
Marita Valenzuela
QQ
Glenn Denny
Thank you! It a astonishing online site!
Paypal Travel
Excellent post. I will be going through many of these issues as well..
Foster Groom
You’re a very valuable site; could not make it without ya!
Emery Gellert
Love the website– very user friendly and great deals to see!
Launa Hay
NQ
free fortnite skins
Thank you for some other wonderful article.
Where else may anybody get that type of information in such an ideal method of writing?
I have a presentation subsequent week, and I’m at the look for such information.
Holly Luker
JM
Lavonne Sidwell
You’ve the best sites.
Benny Burbach
Pretty helpful, look forwards to coming back.
Eulalia Crutchfield
QM
Matilda Vida
WT
Liliana Dunagan
Basically wanted to stress Now i’m lucky that i happened on your page.
Cliff Newman
JW
Alina Gorecki
JH
Johnette Harold
BG
Michele Madison
WV
Esther Whittle
Really such a useful web page.
Teri Austerlitz
Excellent page, Keep up the good job. Thanks a lot!
Darcy Cazneaux
MN
Denese Standish
Just needed to state I am glad I happened in your site.
Dorie Lehrer
Surprisingly user friendly site. Astounding information available on couple of clicks.
Royce Burge
Pretty helpful look ahead to coming back again.
Tammie Mayer
Many thanks, this site is very handy.
Anna Evatt
Thanks extremely useful. Will share website with my friends.
Ward Prevost
Many thanks, this website is extremely handy.
Archer Provost
Wow, stunning site. Thnx …
Cedric Mahaffey
Cool web site you possess there.
Ali Whitelaw
XT
Stryv Performance
Pretty! This was an incredibly wonderful article. Thank you for providing this info.
Merri Gatty
Great looking site. Assume you did a bunch of your very own html coding.
Marina Mendiola
Great looking site. Think you did a great deal of your own coding.
Otilia Lehner
RS
Lewis Coble
TL
Merlin Bromby
I love this website – its so usefull and helpfull.
Austin Bedford
GG
spadschina
Excellent way of explaining, and fastidious piece of writing to obtain facts regarding my
presentation subject, which i am going to present in college.
Renate Heimbach
QB
Norma Leibius
You have got the most impressive webpages.
web site
web site indexletme işi.
Jacquetta Crompton
WB
Frieda Chow
Maintain the amazing work !! Lovin’ it!
sàn forex uy tín
Greetings! Very helpful advice in this particular post! It’s the little changes that produce the largest changes. Thanks for sharing!
Tahlia Hollis
VC
Lashawn Reedy
RP
Lamar Milton
Great internet site! It looks really professional! Keep up the helpful job!
Free V Bucks
Hmm is anyone else encountering problems with the images
on this blog loading? I’m trying to determine if its a problem on my
end or if it’s the blog. Any feed-back would be greatly appreciated.
Audrey Levi
WM
sàn forex uy tín
Very good article. I am going through many of these issues as well..
sàn forex uy tín
Pretty! This has been an incredibly wonderful post. Many thanks for providing this info.
Magnolia Brickhouse
FH
Erika Wild
BX
Lanny Rader
Very good Web-site, Maintain the wonderful job. With thanks!
Demi Kim
KB
Bart Firkins
WB
Sylvia Gatty
XT
Katharina Lieb
Passion the site– extremely individual friendly and whole lots to see!
Glory Zaragoza
LP
Nadia Simpson
Passion the website– really user pleasant and great deals to see!
Hans Hymel
GJ
Karine Coxen
Surprisingly user pleasant site. Immense details readily available on couple of clicks on.
Clarence O'Ferrall
JT
Anita Andrzejewski
ZB
Sherrie Colon
I like looking through your website. Kudos!
Edison Lassiter
VJ
Marijuana Wax
Very good article. I will be facing some of these issues as well..
Judson Thomson
YF
Eldon Sanders
Hi-ya, good internet site you’ve got presently.
Carin Hurtado
Great internet site! It looks extremely expert! Maintain the great job!
Claribel Sverjensky
YD
Sonya Christie
Merely wished to state I am just grateful that i stumbled upon your internet page!
Delbert Canales
MX
mid century modern
Excellent post however I was wondering if you could write a litte more on this topic?
I’d be very thankful if you could elaborate a little bit more.
Thanks!
Teri Grenier
DQ
Web Hosting Services
Hi! Do you know if they make any plugins to assist with SEO?
I’m trying to get my blog to rank for some targeted keywords but I’m not seeing very good gains.
If you know of any please share. Appreciate it!
CBD near me
Everything is very open with a very clear clarification of the issues.
It was really informative. Your website is very helpful.
Thanks for sharing!
Risk Assessment
This design is steller! You definitely know how to keep a reader amused.
Between your wit and your videos, I was almost moved to start my own blog (well,
almost…HaHa!) Fantastic job. I really loved what
you had to say, and more than that, how you presented it.
Too cool!
Jackson Crider
CD
Cruz O'Keefe
SS
visit the site
Hi, yes this article is in fact fastidious and I have learned lot of things from it about blogging.
thanks.
Scotty Baxter
Incredible such a beneficial site.
CBD near you
I have been surfing on-line greater than three hours these days, but I never discovered any interesting article like yours.
It’s lovely price sufficient for me. Personally, if all site owners and bloggers made excellent content
as you did, the net will be much more helpful than ever before.
living room decorating ideas
Do you have a spam problem on this website; I also
am a blogger, and I was wondering your situation; we
have developed some nice methods and we are looking to trade methods with others, be sure to shoot me
an email if interested.
Brock Somerset
PL
Arlen Frawley
Passion the site– really individual pleasant and lots to see!
mid century home decor
Thank you a lot for sharing this with all folks you actually know what you
are speaking approximately! Bookmarked. Please also discuss with my website =).
We could have a hyperlink trade arrangement among us
Third Party Collaboration
Hi there! I realize this is kind of off-topic however I needed to ask.
Does building a well-established blog like yours require a massive amount work?
I’m brand new to blogging but I do write in my diary every day.
I’d like to start a blog so I can easily share my personal experience and thoughts online.
Please let me know if you have any recommendations or tips for
new aspiring blog owners. Thankyou!
w888
Can I simply just say what a relief to discover an individual who really understands what
they are talking about over the internet. You actually know how
to bring an issue to light and make it important. More and more people really
need to look at this and understand this side of your story.
I can’t believe you’re not more popular given that you definitely have the gift.
Jocelyn Leyva
EF
Elmer Broadhurst
UP
Rachel McKeon
Many thanks! This a awesome website!
Constance Layman
Incredibly useful, looking forth to visiting again.
Leoma Tavares
YY
Carmela Cannon
AV
Carroll McKeon
Maintain the awesome work !! Lovin’ it!
Jenna McGarry
FD
Chandeliers and Pendants
When someone writes an piece of writing
he/she retains the image of a user in his/her mind that how a user
can know it. Therefore that’s why this paragraph is great.
Thanks!
Web Hosting Services
If you would like to grow your experience simply keep visiting this site and be updated with
the most up-to-date news posted here.
Shane Burleson
MN
Kellye Scerri
The information is quite intriguing.
Caridad Allardyce
EH
Holly Rancourt
WT
Marijuana
Hi, just wanted to mention, I loved this article. It was inspiring.
Keep on posting!
Jeanna Mcnabb
Thanks for furnishing many of these amazing post.
CBD oil for sale near me
Fantastic site. Lots of useful information here.
I am sending it to some buddies ans also
sharing in delicious. And obviously, thanks on your
effort!
Marisol Schiffman
MP
Chandeliers and Pendants
Hey there! This post couldn’t be written any
better! Reading this post reminds me of my good old room mate!
He always kept talking about this. I will forward this post to him.
Pretty sure he will have a good read. Thank you for sharing!
Anthony Driver
Sustain the good work and producing in the crowd!
Alejandrina O'Keeffe
Many thanks really valuable. Will certainly share site with my buddies.
danish designs
Woah! I’m really loving the template/theme of this website.
It’s simple, yet effective. A lot of times it’s challenging to get that “perfect balance” between superb usability and visual
appearance. I must say you have done a great job with this.
In addition, the blog loads extremely fast for me on Internet
explorer. Outstanding Blog!
w888
What’s up everyone, it’s my first visit at this web page, and piece of writing is in fact fruitful in support of me,
keep up posting such articles or reviews.
Damien Leroy
ZH
Room & Home Décor
Greetings! Very useful advice within this article!
It is the little changes that produce the biggest changes.
Thanks for sharing!
Room & Home Décor
What’s Going down i am new to this, I stumbled upon this I’ve discovered It absolutely
useful and it has aided me out loads. I hope to contribute & help other customers like its aided me.
Great job.
Jeannette Maier
AK
Quentin Hass
EN
Roslyn Dudgeon
RC
Wanda Clore
AD
Celia Hagan
You have amazing knowlwdge at this point.
personal protective equipment
What’s up Dear, are you really visiting this web site on a regular
basis, if so afterward you will absolutely get fastidious knowledge.
Rosalind Chinn
Your information is extremely intriguing.
Consumer & Data Subject Rights Management
Heya i am for the first time here. I found this board and I find It really useful & it helped me out much.
I hope to give something back and help others like you helped me.
Carin Tompkins
TE
Lila Clymer
HT
Zelma Stapley
IK
Brigitte Barnet
Pretty insightful….looking ahead to coming back again.
Rafael Challis
Good Website, Continue the beneficial work. thnx.
buy CBD oil near me
Fascinating blog! Is your theme custom made or did you download it from somewhere?
A theme like yours with a few simple adjustements would really
make my blog shine. Please let me know where you
got your theme. Kudos
Blaine Rendall
Wow because this is really good work! Congrats and keep it up.
CBD near you
Thanks for some other informative site.
The place else could I am getting that type of info written in such an ideal approach?
I have a challenge that I am just now running on, and I’ve
been at the look out for such information.
protective work wear
This paragraph is actually a fastidious one it helps new web viewers, who are wishing
in favor of blogging.
click here for info
I really like your blog.. very nice colors & theme. Did you make this website yourself or did you
hire someone to do it for you? Plz answer back as I’m looking to create my own blog and would like to find out
where u got this from. appreciate it
Beatriz Comeaux
You’re an extremely practical web site; couldn’t make it without ya!
ww88
Whoa! This blog looks exactly like my old one!
It’s on a entirely different topic but it has pretty
much the same page layout and design. Outstanding choice of colors!
Clarice Drayton
Maintain the great work and generating the group!
find out more about this blog
Write more, thats all I have to say. Literally,
it seems as though you relied on the video to make your point.
You obviously know what youre talking about,
why throw away your intelligence on just posting videos to your weblog when you could be giving us
something informative to read?
Fatima Boyes
Extremely user friendly website. Huge information offered on couple of clicks on.
click for info
It’s an awesome paragraph designed for all the web users; they will
take advantage from it I am sure.
Joesph Farfan
QS
Thao Griggs
SK
ww88
Nice blog! Is your theme custom made or did you download it from somewhere?
A theme like yours with a few simple tweeks would really make
my blog jump out. Please let me know where you got your design. Appreciate
it
Wilfredo Doran
Appreciate it! This a amazing site.
Roger Streeten
Highly informative….looking forward to visiting again.
best camera
Pretty! This was a really wonderful article. Many thanks for supplying these details.
Leon Poole
Truly insightful, looking forward to coming back again.
Krystyna Schauer
GJ
Toronto Home Renovations
This blog was… how do you say it? Relevant!!
Finally I’ve found something which helped me. Thanks!
Jacquelyn Shrader
Exceptionally user pleasant website. Tremendous info offered on few clicks on.
Eulah Rosario
Thanks meant for providing these types of terrific knowledge.
Roy Newell
Rather insightful, looking onward to returning.
visit this website
Simply wish to say your article is as astonishing.
The clarity for your put up is simply great and
that i can think you’re a professional on this
subject. Well along with your permission let me to snatch your feed to stay updated with coming near near post.
Thank you one million and please keep up the enjoyable work.
Vendor Due Diligence
Hiya! Quick question that’s totally off topic.
Do you know how to make your site mobile friendly? My website looks
weird when browsing from my apple iphone.
I’m trying to find a theme or plugin that might be
able to resolve this issue. If you have any recommendations, please share.
Cheers!
Bahrain PDPL
Hi there, this weekend is fastidious in support of me, since this
occasion i am reading this impressive educational article here at
my residence.
Nicolas Wickham
AR
Elsa Knudson
LL
Jordan Heimbach
RE
chiara ferragni
Great weblog here! Also your website quite a bit up fast!
What host are you using? Can I get your affiliate
link on your host? I want my site loaded up as fast as yours lol
concrete
Everything is very open with a clear explanation of the challenges.
It was definitely informative. Your website is very useful.
Many thanks for sharing!
Janet McKinlay
Keep up the great job and bringing in the crowd!
Basil Hickson
Passion the site– really user friendly and great deals to see!
Lily Holden
FQ
Waylon Cormier
Thank you! This a good internet site.
Romaine Lawson
Thanks pertaining to delivering this kind of wonderful content material.
Upscale Pet Shop
Good article! We are linking to this particularly great article on our website. Keep up the good writing.
best camera
Wow, awesome blog layout! How long have you been blogging for?
you make blogging look easy. The overall look of your site is
wonderful, let alone the content!
Christi Allard
BK
space planning
We are a group of volunteers and starting a new scheme in our community.
Your website provided us with valuable information to work on. You’ve done an impressive job and
our entire community will be thankful to you.
Underground Subgrade Main Lines
Greetings, I do believe your website could be having web browser
compatibility problems. Whenever I look at your web
site in Safari, it looks fine however when opening in IE, it
has some overlapping issues. I just wanted to provide you with a quick heads up!
Other than that, great website!
Miles Masten
Fantastic website you have got there.
Janette Desailly
Many thanks really useful. Will certainly share site with my buddies.
Willis Stuckey
NV
Bryant Leidig
TY
Rosita Ritter
SU
Ashlee Hartin
Great looking site. Presume you did a bunch of your very own coding.
Gail Saulsbury
Merely want to express I am just thrilled that i came on the webpage.
Dieter Port
Many thanks extremely beneficial. Will certainly share site with my buddies.
Angelica Chirnside
SX
Matthias Post
Extremely user friendly website. Enormous details offered on couple of gos to.
Gino Norrie
VA
Blake Worrall
OC
Harold Ewen
YQ
Shakira Rajk
Very good post! We are linking to this particularly great content on our site. Keep up the great writing.
Zelda McAuley
Maintain the amazing job !! Lovin’ it!
James Laura
JD
mastering
Wow, incredible blog layout! How long have you ever been blogging for? you made blogging look easy. The whole look of your site is magnificent, let alone the content!
Krystle Zimmerman
IA
Sterling Corey
EK
Lenore Dillon
MI
Teresa Custer
You’re a really valuable internet site; couldn’t make it without ya!
Garry Reich
IO
Sharyl Israel
Thank you so much! It a fantastic online site!
Janessa Chipper
WC
Gina Gillott
WW
Ewan Griffis
OM
Maryland furniture installers
I’m impressed, I have to say. Actually hardly ever do I encounter a blog that’s both educative and entertaining, and let me inform you, you will have hit the nail on the head. Your thought is excellent; the problem is one thing that not enough persons are talking intelligently about. I’m very glad that I stumbled throughout this in my seek for one thing regarding this.
Demetria Piesse
XU
Alexis Brinkley
Thanks, this site is very beneficial.
how to get record deal
I absolutely love your blog and find almost all of your post’s to be exactly I’m looking for. Does one offer guest writers to write content available for you? I wouldn’t mind composing a post or elaborating on many of the subjects you write in relation to here. Again, awesome site!
Ermelinda McGowan
Love the site– extremely individual friendly and lots to see!
Brittny Gayle
RD
psp
Simply wish to say your article is as astounding. The clarity in your submit
is simply nice and that i could suppose you’re a professional in this subject.
Fine with your permission let me to seize your feed to keep updated with approaching post.
Thank you one million and please continue the rewarding
work.
Plumber in Kent
Hi to every single one, it’s actually a good for me to pay a visit this web page, it
contains valuable Information.
Scarlett Uribe
FO
Carolyn Hinojosa
SX
The park at 14th
You made some decent points there. I did a search on the topic and found most people will go along with with your blog.
Nan Moreira
NM
Nannie Ernst
Great web site! It looks really expert! Maintain the great work!
aluminum urd cable sizes
Thanks for sharing your thoughts on aluminum cable size chart.
Regards
Brenna Bidencope
Basically desired to express Now i am lucky I came onto your page!
cabinet dentar ieftin in uk
This is my first time go to see at here and i am
truly impressed to read all at one place.
Kathlene Heinig
Great looking web site. Think you did a whole lot of your own coding.
aluminum conductor or insulator
It is appropriate time to make some plans for the longer term and it is time to be happy.
I’ve learn this submit and if I may I want to recommend you some attention-grabbing things or tips.
Perhaps you could write next articles relating to this article.
I desire to learn even more issues approximately it!
romini in uk
If you desire to improve your knowledge simply keep visiting this web site
and be updated with the newest news update posted here.
myrnatoler Desert Rose Development
Hello, Neat post. There’s an issue along with your site in web explorer, may test this?
IE still is the marketplace chief and a good component to other people will pass over your
fantastic writing because of this problem.
myrnatoler Highline Ranch development
If some one needs expert view regarding blogging afterward i advise him/her to go to see this website, Keep up the nice job.
how to promote clickbank products without a website
Hello, this weekend is good designed for me, because this point in time i
am reading this great informative article here at my
home.
Julianne Willoughby
AE
Brigette Kaur
LI
Rosemary Nicolay
HX
Theo Harry
Thanks! It is definitely an good web-site!
Marty Dolling
Many thanks very helpful. Will share website with my buddies.
Valeria Martine
YS
Glinda Berry
OV
anunturi auto uk
Heya this is kind of of off topic but I was wanting to know
if blogs use WYSIWYG editors or if you have to manually code
with HTML. I’m starting a blog soon but have no coding
expertise so I wanted to get advice from someone with experience.
Any help would be greatly appreciated!
w88club
Heya i’m for the first time here. I found this board and I to find It truly useful & it helped me out much.
I hope to provide something back and aid others like you
aided me.
Ernest Merchant
TP
Jere Leighton
CV
Barry Carman
MI
Kenton Fossett
XZ
Valentin Holton
say thanks to a lot for your site it assists a whole lot.
Willard Spight
Way cool! Some very valid points! I appreciate you penning this write-up and the rest of the site is also really good.
Wesley Gaby
You’ve gotten remarkable knowlwdge here.
Dwayne Hodgkinson
JE
Debra Leary
Great looking internet site. Think you did a bunch of your very own html coding.
Plumber in Kent
I’m not sure exactly why but this weblog is loading incredibly slow for me.
Is anyone else having this issue or is it a problem on my end?
I’ll check back later and see if the problem still exists.
myrnatoler Desert Rose Development
Good post. I learn something new and challenging on websites I stumbleupon everyday.
It will always be useful to read articles from other writers and use something from their sites.
Therese Holler
Simply had to stress Now i’m thankful I came upon your internet page.
Gino Hardeman
KW
Plumber in Kent
Hello There. I found your blog using msn. This is an extremely well
written article. I will make sure to bookmark it and return to
read more of your useful information. Thanks for the post.
I’ll definitely comeback.
Beverly Carstensen
Many thanks, this site is very beneficial.
Porfirio Rogers
You’re a very valuable internet site; could not make it without ya!
รับจัดงานแต่งงาน
It is appropriate time to make some plans for the future and it’s time to be happy.
I have read this post and if I could I wish to suggest you few interesting
things or advice. Maybe you can write next articles referring to this article.
I wish to read more things about it!
Lazaro Albiston
AR
Agnes Ehrlichmann
ER
Cherie Peacock
KX
Earl Utter
You’ve got wonderful knowlwdge on this website.
Virgilio Daulton
Wow because this is very helpful work! Congrats and keep it up.
myrnatoler The Legacy Development
I absolutely love your blog and find the majority of your post’s to
be exactly I’m looking for. can you offer guest writers to write content for yourself?
I wouldn’t mind composing a post or elaborating on a number of the subjects you write regarding here.
Again, awesome web log!
Maude Varela
XD
Jefferson Michaelis
Keep up the excellent job !! Lovin’ it!
Zandra Carothers
VI
Pat Brookins
WD
Theron Bostick
PY
anunturi .uk
Appreciate this post. Let me try it out.
Galen Madison
IB
myrnatoler Desert Rose Development
I think this is among the most significant information for me.
And i’m glad reading your article. But should remark on few general things, The site style is
ideal, the articles is really nice : D. Good job, cheers
homepage
Appreciate this post. Let me try it out.
Eve Nakamura
EK
Marty Vrooman
Many thanks, this website is extremely beneficial.
movers Florida
I want to to thank you for this great read!! I absolutely loved every little bit of it.
I have you saved as a favorite to look at new
stuff you post…
myrnatoler Talasera Development
Do you have a spam issue on this website; I also am a blogger, and I was curious
about your situation; we have created some nice procedures and we are looking to exchange strategies with other folks, be sure to shoot me an e-mail if interested.
Debbie Jacobs
JW
Charmain Porras
ON
Claudio Bass
You’re a really helpful web site; could not make it without ya!
anuntul uk locuri de munca
Hi there i am kavin, its my first occasion to commenting anyplace,
when i read this article i thought i could also create comment due to this sensible article.
Dewayne Matthews
OR
Alda Heller
Thanks meant for providing many of these well put together information.
Brian Scarborough
You have got remarkable knowlwdge these.
Deborah Humphery
Seriously, this is a handy websites.
Daniele Monk
OW
Roxanne Bolliger
I enjoy the data on your web site. With thanks.
poker idn
Very good information. Lucky me I ran across your website by
chance (stumbleupon). I have bookmarked it for later!
Adam Scholl
Extremely individual pleasant site. Astounding details readily available on couple of gos to.
Leonore Armer
ON
Coy Laboureyas
EC
Lilla Rechner
WP
Gita Mansell
LT
Marquis Oliver
Many thanks really handy. Will share site with my friends.
Moshe Crumley
AE
Dante Lombardi
QL
Teodoro Godinez
AI
Ella Thompkins
DG
Dwain Jorgenson
Hi-ya, cool web page you possess going here.
Elbert Mckeever
DA
Joey Pratt
Wow because this is excellent work! Congrats and keep it up.
Operationalize Privacy by Design
Hi, Neat post. There is an issue together with your web site in web explorer,
may test this? IE still is the marketplace chief and a big
component of folks will omit your fantastic writing due to
this problem.
Donna Pittmann
FB
Moshe Henderson
KV
Patrick Brandow
You’ve one of the best webpages.
Stewart Santo
Surprisingly user friendly website. Huge details readily available on couple of clicks on.
Vickie Zox
DP
Rueben Steadman
Thanks with regard to offering these kinds of substantial information.
Enrique Ludlum
FY
Sergio Mauriello
Passion the site– extremely user friendly and great deals to see!
Gap Analysis and Risk Remediation
WOW just what I was searching for. Came here by searching for Vendor Risk
Assessment
Dallas McCauley
I love this site – its so usefull and helpfull.
Lloyd Holifield
AR
Personal Data Protection (PDPL)
I do not even know the way I ended up here, but I thought this
post used to be good. I do not realize who you might be however certainly
you are going to a well-known blogger if you aren’t already.
Cheers!
HIPAA
I need to to thank you for this very good read!! I absolutely enjoyed every bit
of it. I’ve got you book marked to check out new stuff you
post…
Qisume
Good web site you have got here.. It’s difficult to find good quality writing like yours nowadays. I seriously appreciate individuals like you! Take care!!
Jonah Irish
Appreciate it! It is definitely an outstanding web page.
Chester Broinowski
FZ
Lucile Cambell
Really….such a valuable online site.
Swing set installers
Great work! This is the type of information that should be shared around the web. Shame on Google for not positioning this post higher! Come on over and visit my website . Thanks =)
The park at 14th
Some really great content on this site, thank you for contribution. “Always aim for achievement, and forget about success.” by Helen Hayes.
Darcy Fife
PL
Laurel Singleton
GO
Robt Clutterbuck
SI
Qisume
It’s hard to find well-informed people on this subject, but you seem like you know what you’re talking about! Thanks
DC furniture installers
A person essentially help to make critically articles I’d state. This is the very first time I frequented your website page and to this point? I surprised with the analysis you made to create this particular submit extraordinary. Wonderful process!
Uta Cruse
GA
Rick and Morty shirts
I do not even understand how I stopped up here, however I thought this put up used to be
good. I don’t recognize who you are however definitely you are going to a famous blogger in the
event you aren’t already. Cheers!
Clinton Goodfellow
Maintain the helpful job and delivering in the crowd!
Rick and Morty LED lights
Do you have a spam problem on this website; I also am a blogger,
and I was wondering your situation; many of us have created some nice methods and we are looking to exchange solutions with other folks, be sure
to shoot me an email if interested.
Reyes McVeigh
DF
Shayna Hardin
Passion the site– really user friendly and lots to see!
Kermit Nevarez
HK
buy weed online Canada cheap
We are a bunch of volunteers and opening a brand
new scheme in our community. Your website offered us with valuable information to work on. You’ve done a formidable task and our entire group will probably
be thankful to you.
eco friendly products
Touche. Outstanding arguments. Keep up the good work.
yesgacasinoone
An outstanding share! I have just forwarded this onto a friend who had been conducting a little research on this. And he in fact ordered me dinner due to the fact that I discovered it for him… lol. So let me reword this…. Thank YOU for the meal!! But yeah, thanx for spending the time to talk about this issue here on your web page.
tyvek over shoes
It’s truly very difficult in this active life to listen news on Television,
so I simply use world wide web for that purpose,
and get the hottest news.
3m mask
Quality content is the main to attract the visitors to pay a visit the site, that’s what this website is providing.
Jessie Proud
LA
Paige Dingle
VJ
Cooper Fitzgerald
YN
Anne Miele
OI
Rocky Kyle
NO
detox kuur 5 dagen recepten
I enjoy this site – its so usefull and helpfull. http://nl.global-box.net/detox-kuur-5-dagen-recepten/
Moonrocks for sale
Please let me know if you’re looking for a article author for your
site. You have some really great articles and I feel I would
be a good asset. If you ever want to take some of
the load off, I’d love to write some material for your blog in exchange for a
link back to mine. Please blast me an email if interested.
Thanks!
lose excess weight
Great internet website! It looks very expert!
Maintain the excellent job! http://http:/ko21.fr/hotel-deseo-playa-del-carmen/
concrete sealer
May I just say what a comfort to uncover an individual who genuinely understands what they’re talking about
over the internet. You certainly know how to bring a problem to light and make it important.
More and more people really need to read this and understand this side of the story.
I was surprised that you are not more popular since you certainly have the gift.
personal protective equipment
Peculiar article, totally what I needed.
Shanice Beaurepaire
VE
Errol Kimmel
XT
macon concrete
Hi there very cool website!! Man .. Excellent .. Superb ..
I’ll bookmark your site and take the feeds also?
I’m satisfied to search out so many useful info right here within the post, we’d
like work out more strategies on this regard, thank you for sharing.
. . . . .
Darwin Rasmussen
QG
weight loss component
Love the website– extremely individual pleasant and lots to see! http://http:/ko21.fr/elargissement-du-pa
Madeline Salisbury
SH
why having sex in a clean room is better
A fascinating discussion is worth comment. There’s no doubt that that you ought to write more about this topic, it might not be a taboo matter but generally people do not speak about such topics. To the next! All the best!
Jared Alfaro
TJ
detox formule waar te koop
Basically needed to point out I am pleased that i happened on the web page! http://nl.cgtribc.org/detox-formule-waar-te-koop/
testosteron vrouwen aantrekken
Maintain the good work and generating the crowd! http://nl.t-booster2020.com/testosteron-vrouwen-aantrekken/
Alison Browne
QE
integratori net
I treasure the information on your web sites. Regards. http://juventusdomo.it/integratori-net/
Shona Cummins
WN
testosterona baja en hombres consecuencias
Regards for sharing your very good website. http://es.testosteron.space/testosterona-baja-en-hombres-consecuencias/
black highwaisted gym leggings
We absolutely love your blog and find most of your post’s to be exactly I’m
looking for. Would you offer guest writers to write content to suit your needs?
I wouldn’t mind producing a post or elaborating on some of
the subjects you write with regards to here. Again, awesome
web log!
Jeffrey Butcher
MW
http://fr.musclemass.space/bande-de-caoutchouc-pour-musculation/
You’re an extremely useful site; could not make it without ya! http://fr.musclemass.space/bande-de-caoutchouc-pour-musculation/
Buy Weed Online
I am genuinely delighted to read this website posts which carries tons of useful data,
thanks for providing these kinds of data.
http://it.musclemass.space/aminoacidi-per-muscoli/
Much thanks! It is definitely an terrific web site! http://it.musclemass.space/aminoacidi-per-muscoli/
http://nl.musclemass.space/spiermassa-verliezen-door-dieet/
Merely wished to mention I am just grateful I stumbled on your webpage. http://nl.musclemass.space/spiermassa-verliezen-door-dieet/
Lanny Skeens
RU
Abel Patch
GP
Eugenio Slavin
VM
tyvek suits
I blog often and I seriously appreciate your information. This article has really peaked my interest.
I am going to book mark your website and keep checking for new details about once per week.
I opted in for your Feed as well.
concrete contractors macon ga
whoah this blog is wonderful i really like reading your
articles. Keep up the great work! You realize, many persons are hunting round for
this information, you could aid them greatly.
macon concrete services
My brother suggested I might like this blog. He was totally right.
This post actually made my day. You cann’t imagine simply how
much time I had spent for this information! Thanks!
marijuana wax for sale
Hmm it looks like your site ate my first comment (it was extremely
long) so I guess I’ll just sum it up what I submitted and say, I’m thoroughly enjoying your blog.
I too am an aspiring blog blogger but I’m still new to everything.
Do you have any helpful hints for beginner blog
writers? I’d certainly appreciate it.
Linda Mickey
CJ
fire retardant gloves
It’s actually very difficult in this busy life to listen news on Television, therefore I only use web for that
purpose, and obtain the latest news.
safety spectacles
Hello! Quick question that’s completely off topic.
Do you know how to make your site mobile friendly?
My web site looks weird when viewing from my apple iphone.
I’m trying to find a theme or plugin that might be able to fix this problem.
If you have any recommendations, please share. Appreciate
it!
Annett Cockerill
WX
driveway repair macon ga
Everything is very open with a clear explanation of the challenges.
It was really informative. Your website is very helpful.
Many thanks for sharing!
Emory Brigham
Wow, stunning portal. Thnx …
why having sex in a clean room is better
This is a great tip particularly to those fresh to the blogosphere. Simple but very accurate information… Appreciate your sharing this one. A must read post.
Essie Crofts
IT
why having sex in a clean room is better
Greetings! Very useful advice within this post! It’s the little changes that produce the biggest changes. Many thanks for sharing!
Carlton Canipe
Sustain the excellent job and generating the group!
Harriet Benjafield
IS
porno izle
google online hacklink satın al.
Florida Steadman
NP
Natalie Willoughby
EC
Rosalina Foote
BS
Rhys Nale
GU
Jung Gullett
ZL
Alma Rummel
AL
Connor Pridham
WL
Lorena Taulbee
GA
Tanisha Beverly
CV
Free Robux Generator
Hi there, I log on to your blogs regularly. Your humoristic style is witty, keep doing what you’re doing!
Dustin Mcdade
HG
Thorsten Isenberg
CD
Jetta Male
OL
Gordon Canter
BQ
Candy Neubauer
TS
Blythe Groce
MB
Ralph Landreneau
QG
Lashawn McKelvey
FB
Novella Lhotsky
PH
google hacklink online
google online hacklink satın al.
Bobbie Maxted
TR
Marco Vance
DV
drone photography
Hi, Neat post. There is an issue along with your website in internet explorer, would check this… IE still is the market chief and a big component of folks will omit your magnificent writing because of this problem.
Casie Godley
UW
Tanisha Borchgrevink
ZM
Ashly Penrod
TI
click site
I’ll right away clutch your rss as I can not to find your email subscription hyperlink or e-newsletter service. Do you have any? Please allow me recognize in order that I may just subscribe. Thanks.
sexting on kik
Thanks for any other informative website. Where else may just I get that
type of information written in such an ideal method? I’ve a project that I’m just now running on, and I’ve been at the glance out for such information.
w88
My spouse and I stumbled over here coming from a different web address and thought I
should check things out. I like what I see so now i’m following
you. Look forward to looking over your web page again.
occupational health and safety courses
Valuable information. Lucky me I discovered your site by chance, and I am stunned
why this coincidence did not came about in advance! I
bookmarked it.
cruise ship
Saved as a favorite, I like your site.
Betsey Barff
GN
Corina Avila
KW
Sang Summerville
VT
electric cement mixers
I think this is among the so much vital information for me.
And i’m glad reading your article. However want
to commentary on few general issues, The website taste is perfect,
the articles is truly great : D. Excellent activity, cheers
Phil Kohn
AI
Filomena Mondragon
IA
Danuta Slavin
HS
justcbd wholesale
These are in fact fantastic ideas in regarding blogging.
You have touched some nice points here. Any way keep
up wrinting.
Deloras Thynne
MC
Criminal defense lawyer atlanta
Hey this is kinda of off topic but I was wondering if blogs use WYSIWYG editors or if you have to manually code with HTML.
I’m starting a blog soon but have no coding knowledge so I
wanted to get advice from someone with experience. Any help would
be greatly appreciated!
ตู้ม้าออนไลน์
Hey there! I just wanted to ask if you ever have any issues
with hackers? My last blog (wordpress) was hacked and I ended up losing
several weeks of hard work due to no data backup. Do you have any methods to protect against hackers?
seks videosu izle
google online hacklink satın al.
Soila Penington
SH
free sexting
Hey! Quick question that’s completely off topic.
Do you know how to make your site mobile friendly? My website looks weird when viewing from my iphone 4.
I’m trying to find a template or plugin that might be able to resolve this issue.
If you have any recommendations, please share.
Thanks!
Lavonne Bedard
WY
The Mangina Dialogues
I’d like to thank you for the efforts you have put in penning this website. I really hope to view the same high-grade content from you in the future as well. In truth, your creative writing abilities has motivated me to get my own, personal site now 😉
Elvira Parish
KT
bad credit atlanta
Spot on with this write-up, I truly believe this site needs much more attention. I’ll probably be returning to
read more, thanks for the information!
safety officer training
Greetings from Colorado! I’m bored to death at work so I decided to check out your blog on my iphone during
lunch break. I love the knowledge you provide here and can’t wait to take a look when I get home.
I’m shocked at how fast your blog loaded on my cell phone ..
I’m not even using WIFI, just 3G .. Anyhow,
awesome site!
Melinda Tinker
FK
occupational health and safety courses
Thanks for another wonderful article. Where else could anybody
get that kind of info in such an ideal way of writing?
I have a presentation next week, and I am at the search for
such information.
Juliane Collee
PE
Jacki Dewees
CZ
misdemeanor lawyer atlanta
I really like what you guys are up too. This kind
of clever work and reporting! Keep up the superb works guys I’ve incorporated you guys to our blogroll.
Anderson Houchens
DQ
Greg Alprin
Way cool! Some extremely valid points! I appreciate you penning this post and also the rest of the website is very good.
Penney Shellshear
JG
Meri Hewlett
SX
Anderson Ironside
XD
William Delany
ZL
Easy Facts
I like it when individuals get together and share ideas. Great site, keep it up.
Fred Shears
MO
hacklink satın al
google online hacklink satın al.
Gabriela Zimin
YE
Kraig Macklin
XT
Maisie Brownlee
WP
check it out
Pretty! This has been an incredibly wonderful article. Many thanks for providing this information.
Carmel Ellery
LJ
Ernie Ramey
LR
web site
web site indexletme çalışması.
Adipex bestellen
I’ve been absent for some time, but now I remember why I used to love this web site. Thanks, I will try and check back more frequently. How frequently you update your web site?
Luisa Swinburne
VI
Wiley Fink
GW
Ashlee Luttrell
OL
Michale Guardado
FK
Sibutramine kaufen
Hello, you used to write magnificent, but the last few posts have been kinda boring?K I miss your great writings. Past several posts are just a little bit out of track! come on!
Hannah Luevano
CB
beauty
I want to to thank you for this great read!! I definitely enjoyed every bit of it. I have you bookmarked to check out new stuff you post…
Hye Detwiler
TC
Frankie Devaney
LE
in Deutschland
I¦ve been exploring for a little bit for any high quality articles or blog posts in this kind of space . Exploring in Yahoo I ultimately stumbled upon this site. Studying this information So i¦m satisfied to exhibit that I have a very excellent uncanny feeling I discovered exactly what I needed. I such a lot definitely will make certain to do not forget this web site and provides it a glance on a continuing basis.
Porn
I was just seeking this information for some time. After 6 hours of continuous Googleing, finally I got it in your web site. I wonder what’s the lack of Google strategy that don’t rank this type of informative web sites in top of the list. Normally the top websites are full of garbage.
Kurtis Self
PN
Zulma Ballard
XM
Monika Kelley
AI
Fran Le Couteur
RQ
Clyde Richard
TL
pay per call affiliate
This info is worth everyone’s attention. How can I find out more?
Rashad Gregory
XA
Britney Canty
KN
Agueda McGoldrick
YU
ソフト闇金
Wow, amazing blog layout! How long have you been blogging for?
you make blogging look easy. The overall look of your site is wonderful,
let alone the content!
Charles Venuti
HD
Gus Wilcox
DF
watch here
It’s truly a nice and helpful piece of information.
I am glad that you shared this useful information with us.
Please stay us up to date like this. Thank you for sharing.
Shawn Hoffmann
FW
Marcelino Cash
IC
Margart Waugh
BE
forex-tv-online.ru
Heya i’m for the first time here. I found this board
and I to find It truly useful & it helped me out much.
I hope to give something again and aid others like you helped me.
Assetz Atmos and Aura
Since the admin of this site is working, no doubt very shortly it will be well-known, due to its feature contents.
acheter steroides en ligne
Hi there very nice web site!! Guy .. Excellent .. Amazing .. I’ll bookmark your web site and take the feeds also…I am glad to find so many helpful information right here within the put up, we need work out more strategies in this regard, thank you for sharing.
Kasey Delong
ZL
Ella Nellis
BB
Rosetta Dunford
KJ
acheter steroides anabolisants
It’s actually a nice and useful piece of information. I’m happy that you simply shared this useful info with us. Please keep us informed like this. Thank you for sharing.
cheap vpn
hello there and thank you for your info – I have certainly picked up something new from right here. I did then again expertise some technical points using this website, since I experienced to reload the website a lot of occasions previous to I may get it to load correctly. I had been puzzling over if your web host is OK? Now not that I’m complaining, however sluggish loading instances instances will very frequently affect your placement in google and could harm your quality rating if advertising and ***********|advertising|advertising|advertising and *********** with Adwords. Anyway I’m adding this RSS to my e-mail and can glance out for a lot extra of your respective exciting content. Ensure that you replace this once more soon..
check these guys out
Hello there, I found your web site via Google while looking for a related topic, your site came up, it looks good. I’ve bookmarked it in my google bookmarks.
pharm4all.ru
I really like it when individuals come together and share
ideas. Great site, keep it up!
https://jrbola.com
I’m amazed, I have to admit. Rarely do I encounter a blog that’s equally educative and engaging, and without a doubt, you’ve hit
the nail on the head. The issue is something not enough
folks are speaking intelligently about. Now i’m very happy
that I found this in my hunt for something concerning this.
George Disney
You have got the most effective web pages.
Madeline Sturdivant
I appreciate browsing your internet site. Regards!
Devon Beeston
Greetings, well put together websites you’ve got in here.
spadschina za zapovtom
Hello, yeah this article is genuinely fastidious and I have learned lot of things from it about blogging.
thanks.
steroide kaufen
I truly enjoy looking through on this web site, it holds excellent posts.
Ebony Fuller
This blog was… how do you say it? Relevant!! Finally I’ve found something which helped me. Kudos!
Ebony Fuller
I wanted to thank you for this fantastic read!! I definitely enjoyed every little bit of it. I have you book marked to check out new stuff you post…
Ebony Fuller
I truly love your site.. Great colors & theme. Did you develop this web site yourself? Please reply back as I’m looking to create my very own site and would like to find out where you got this from or what the theme is called. Cheers!
Trackingice.com
bookmarked!!, I really like your blog!
pokeridn
Hi colleagues, how is everything, and what you desire to say on
the topic of this article, in my view its truly awesome in support of me.
soi keo dem nay
I could not resist commenting. Perfectly written!
perfopil.ru
I constantly emailed this website post page to all my friends,
since if like to read it after that my friends will too.
Silver spring Hair Salon
I really wanted to make a small word in order to thank you for the splendid tips and hints you are giving out on this site. My rather long internet search has finally been rewarded with really good facts and techniques to write about with my family. I would mention that most of us visitors are rather endowed to exist in a superb place with very many perfect professionals with helpful opinions. I feel truly fortunate to have encountered the web site and look forward to so many more entertaining moments reading here. Thanks again for a lot of things.
soikeohomnay
You made some good points there. I looked on the net for more info about the issue and found most individuals will go along with your views on this site.
soi keo hom nay
I really like looking through an article that will make men and women think. Also, thank you for permitting me to comment.
free fortnite skins
Pretty nice post. I just stumbled upon your blog and wanted to say that I have truly enjoyed browsing
your blog posts. In any case I will be subscribing to your rss feed and I hope you write again very soon!
xalotintuc.club
Pretty! This has been an extremely wonderful post. Thanks for supplying this info.
xalotintuc.club
bookmarked!!, I like your website!
free fortnite skins
If you want to take much from this post then you have to apply such strategies to your won web site.
xalotintuc
Hi, I do think this is an excellent website. I stumbledupon it 😉 I’m going to come back yet again since i have book-marked it. Money and freedom is the greatest way to change, may you be rich and continue to guide other people.
steroide kaufen
Fantastic web site. Plenty of useful information here. I am sending it to a few friends ans also sharing in delicious. And naturally, thanks for your effort!
DMV Happy hour
It¡¦s really a nice and useful piece of info. I¡¦m happy that you shared this helpful information with us. Please stay us informed like this. Thanks for sharing.
web
fantastic submit, very informative. I ponder why the other
experts of this sector do not notice this. You must continue
your writing. I’m sure, you have a great readers’ base already!
DC Movers
I would like to thnkx for the efforts you have put in writing this website. I am hoping the same high-grade web site post from you in the upcoming as well. Actually your creative writing skills has encouraged me to get my own blog now. Actually the blogging is spreading its wings quickly. Your write up is a good example of it.
large wall clock modern
That is very attention-grabbing, You’re an excessively skilled blogger. I’ve joined your rss feed and sit up for seeking more of your excellent post. Additionally, I have shared your site in my social networks!
Menschliches Wachstumshormone Kaufen Online
Hello, i think that i saw you visited my site so i came to “return the favor”.I’m trying to find things to enhance my web site!I suppose its ok to use a few of your ideas!!
travel itinerary
Hello there! This post could not be written any better!
Reading through this article reminds me of my previous roommate!
He constantly kept talking about this. I will
forward this information to him. Pretty sure he will have a good read.
Thank you for sharing!
Samsung Galaxy S20
Hi! Someone in my Facebook group shared this site with us so I came to check it out.
I’m definitely loving the information. I’m book-marking
and will be tweeting this to my followers! Superb blog and
fantastic style and design.
W88
Fantastic website you have here but I was wanting to know if
you knew of any discussion boards that cover the same topics discussed here?
I’d really like to be a part of group where I can get feedback from other experienced people that share the same interest.
If you have any recommendations, please let me know. Kudos!
W88
Hi I am so glad I found your weblog, I really found you by mistake,
while I was researching on Digg for something else, Anyhow I am here now and would just
like to say cheers for a remarkable post and a all round enjoyable blog (I also
love the theme/design), I don’t have time to read through it all at the minute but I have book-marked it
and also added in your RSS feeds, so when I have time I will be back to read a lot more, Please do keep up the excellent
b.
เว็บแทงบอลออนไลน์
It’s enormous that you are getting ideas from this article as well as from our argument made here.
W88
Nice weblog right here! Additionally your site rather a lot up fast!
What host are you the use of? Can I am getting your affiliate link on your host?
I want my web site loaded up as quickly as yours lol
W88
Hello there! This blog post couldn’t be written any better!
Looking at this post reminds me of my previous roommate! He constantly kept
talking about this. I will send this post to him. Pretty sure he will have a very good read.
Thank you for sharing!
W88
Post writing is also a fun, if you know then you can write if not
it is complicated to write.
เว็บแทงบอลที่ดีที่สุด
My developer is trying to convince me to move to .net from PHP.
I have always disliked the idea because of the costs.
But he’s tryiong none the less. I’ve been using Movable-type
on various websites for about a year and am nervous about switching to another platform.
I have heard excellent things about blogengine.net. Is there a way I can transfer all my wordpress content into
it? Any kind of help would be greatly appreciated!
w88
After exploring a handful of the articles on your website, I truly like your
way of writing a blog. I book marked it to my bookmark site list and will be checking back soon. Take a look at my website too and tell me what you think.
W88
Aw, this was a very nice post. Taking a few minutes and actual effort
to generate a superb article… but what can I say…
I procrastinate a lot and don’t seem to get nearly anything done.
reductil kaufen
Wonderful goods from you, man. I’ve remember your stuff previous to and you are just extremely great. I really like what you’ve bought here, certainly like what you are stating and the best way wherein you say it. You are making it enjoyable and you continue to care for to keep it smart. I can not wait to learn much more from you. This is really a tremendous site.
เว็บแทงบอลออนไลน์
Greetings! Very helpful advice within this post! It is the little changes that make the most
significant changes. Many thanks for sharing!
W88
If you desire to improve your familiarity simply keep visiting this site and be
updated with the hottest gossip posted here.
ephedrin kaufen
Some really howling work on behalf of the owner of this web site, dead great content.
เว็บแทงบอลที่ดีที่สุด
Hey! I’m at work browsing your blog from my new iphone!
Just wanted to say I love reading through your blog and look
forward to all your posts! Carry on the superb work!
W88
It’s remarkable to pay a visit this site and reading the views of all colleagues regarding
this paragraph, while I am also keen of getting experience.
taxi utrecht
This website really has all of the info I wanted about this subject and didn’t know who to ask.
เว็บแทงบอลที่ดีที่สุด
I was suggested this blog via my cousin. I am no longer sure whether this submit is written via him as no one else understand such precise about my trouble.
You are wonderful! Thank you!
w88
Howdy! Would you mind if I share your blog with my twitter group?
There’s a lot of folks that I think would really
enjoy your content. Please let me know. Thanks
thiết kế nhà đẹp 3 tầng
First of all I would like to say excellent blog! I had a quick question in which I’d like to ask if you don’t mind.
I was curious to find out how you center yourself and clear
your thoughts before writing. I have had difficulty
clearing my mind in getting my ideas out. I truly do enjoy writing however it just seems like the first
10 to 15 minutes are generally lost just trying to figure
out how to begin. Any recommendations or tips? Cheers!
qqlucky8
This blog was… how do you say it? Relevant!! Finally I’ve found something that helped me.
Thanks!
Reductil Online Kaufen
Hi my friend! I wish to say that this post is amazing, nice written and include almost all vital infos. I’d like to see more posts like this.
thiết kế nhà đẹp
Thanks for a marvelous posting! I really enjoyed reading it, you might be a great
author. I will always bookmark your blog and will come back later on. I
want to encourage one to continue your great work, have a nice evening!
mpo slot
It’s an awesome article for all the web visitors; they will obtain benefit from
it I am sure.
acrylic prints miami fl
Nice post. I was checking constantly this blog and I am impressed!
Very useful information specifically the last part 🙂 I care for such information much.
I was seeking this particular info for a very long time. Thank you and good luck.
Ordine Sibutril in Italia
I am extremely inspired with your writing abilities and also with the format on your weblog. Is that this a paid topic or did you customize it yourself? Anyway keep up the nice quality writing, it’s rare to peer a great blog like this one nowadays..
Best CBD Oil
Now I am going to do my breakfast, after having my breakfast coming over again to read additional news.
Evie
I am sure this piece of writing has touched all the internet visitors, its really
really good paragraph on building up new weblog.
http://www.mastersparknetwork.com/does-hashish-have-a-possible-to-revolutionize-cancer-remedy/
Fantastic beat ! I wish to apprentice while you amend your site,
how can i subscribe for a blog web site? The account helped me a
acceptable deal. I had been a little bit acquainted of this your broadcast provided
bright clear concept
5 Awesomely Easy Landscaping Projects
This is the right website for anybody who really wants to understand this topic. You realize a whole lot its almost tough to argue with you (not that I personally would want to…HaHa). You definitely put a new spin on a topic that’s been written about for many years. Great stuff, just wonderful.
Best CBD Oil
Heya i am for the primary time here. I found this
board and I find It really helpful & it helped me out much.
I hope to provide one thing back and help others such as you helped me.
Best CBD Oil
Hi there, every time i used to check weblog posts here in the early hours in the dawn, as i love to gain knowledge of more and more.
5 Awesomely Easy Landscaping Projects
Your style is unique compared to other people I’ve read stuff from. Thank you for posting when you have the opportunity, Guess I’ll just book mark this blog.
5 Awesomely Easy Landscaping Projects
An impressive share! I’ve just forwarded this onto a co-worker who has been doing a little research on this. And he in fact bought me dinner simply because I discovered it for him… lol. So let me reword this…. Thanks for the meal!! But yeah, thanks for spending some time to discuss this issue here on your web site.
Best CBD Oil
When some one searches for his necessary thing, therefore he/she wishes to be available
that in detail, so that thing is maintained over here.
https://www.showgaloo.com/the-health-effects-of-cannabis-knowledgeable-opinions-2/
You need to take part in a contest for one of the highest
quality websites online. I will highly recommend this blog!
web design in Tanzania
I think other web-site proprietors should take this site as an model, very clean and wonderful user friendly style and design, as well as the content. You’re an expert in this topic!
https://www.danielsalsa.com.br/who-should-use-the-best-cbd-oil-2/
Ridiculous quest there. What happened after? Take care!
steroide kaufen
I appreciate, cause I found exactly what I was looking for. You have ended my four day long hunt! God Bless you man. Have a nice day. Bye
Best CBD products
Hi there, I check your new stuff like every week.
Your writing style is witty, keep it up!
Christiane
Its like you read my mind! You seem to know a lot about this, like you
wrote the book in it or something. I think that you
could do with some pics to drive the message home a little bit, but instead of that,
this is excellent blog. A great read. I’ll definitely be back.
http://www.enderyener.com/utilizing-cbd-to-achieve-balance-and-wellness-4/
Hi there, I desire to subscribe for this blog to obtain most up-to-date updates,
thus where can i do it please help.
steroide kaufen
You have brought up a very good points, thanks for the post.
Judson
Magnificent goods from you, man. I have understand your stuff previous
to and you are just extremely excellent. I really like what you have acquired here, really like what
you’re saying and the way in which you say it. You make it entertaining and you still care for to keep it smart.
I can not wait to read much more from you. This
is really a great web site.
Kai
Simply desire to say your article is as astounding. The clearness in your post is just nice and i could assume
you’re an expert on this subject. Fine with your permission let me to grab
your RSS feed to keep updated with forthcoming post.
Thanks a million and please continue the rewarding
work.
Best CBD Oil
Hello to every body, it’s my first visit of this website; this website carries
amazing and actually good data in favor of visitors.
Jestine
I was suggested this web site by my cousin. I am not sure whether this post is written by him as
no one else know such detailed about my difficulty.
You’re amazing! Thanks!
Acheter Melanotan 2 en ligne
I just like the valuable info you provide to your articles. I’ll bookmark your blog and check once more right here frequently. I’m moderately sure I will be told lots of new stuff right here! Good luck for the following!
Buy Phentermine UK
I went over this site and I conceive you have a lot of excellent info , saved to fav (:.
Acheter Phentermine
Hi! Someone in my Facebook group shared this site with us so I came to take a look. I’m definitely enjoying the information. I’m book-marking and will be tweeting this to my followers! Outstanding blog and brilliant style and design.
Comprar Reductil
I have learn a few just right stuff here. Definitely value bookmarking for revisiting. I wonder how so much attempt you put to create any such fantastic informative website.
Acquistare Reductil in linea
whoah this blog is wonderful i love reading your articles. Keep up the great work! You know, lots of people are searching around for this information, you could aid them greatly.
Mã giam giá azdigi
Hey there! I just wish to give you a huge thumbs up for your great info you have got here on this post. I am returning to your web site for more soon.
dich vu backlink tay
Very nice blog post. I absolutely appreciate this website. Continue the good work!
buy cheap erectile dysfunction online
I carry on listening to the newscast speak about getting boundless online grant applications so I have been looking around for the best site to get one. Could you advise me please, where could i get some?
1 Pro Vancouver movers
You’re so awesome! I don’t believe I have read a single thing like this before. So good to discover someone with some original thoughts on this subject matter. Seriously.. thank you for starting this up. This site is something that’s needed on the internet, someone with a bit of originality.
anabole steroide kaufen
Great write-up, I am normal visitor of one?¦s blog, maintain up the excellent operate, and It’s going to be a regular visitor for a lengthy time.
bandar poker online
Oh my goodness! Impressive article dude! Thanks, However I am experiencing troubles with your RSS.
I don’t understand the reason why I cannot join it.
Is there anyone else getting the same RSS issues?
Anybody who knows the solution will you
kindly respond? Thanks!!
vijimambo
Thank you for some other informative blog. Where else may just I am getting that type of info written in such a perfect approach? I’ve a venture that I am just now working on, and I’ve been at the look out for such information.
Anh
Nice respond in return of this difficulty with genuine arguments and telling
all about that.
All The posters
Good day! I simply would like to offer you a big thumbs up for the great info you have got right here on this post. I will be coming back to your web site for more soon.
how can I help israel
I am actually thankful to the owner of this web page who has shared this fantastic paragraph at here.
Fine art of photography
I used to be able to find good information from your blog articles.
hair transplant Malaysia
Very rapidly this website will be famous among all
blogging people, due to it’s good articles or
reviews
best forged wheels
I’m not sure why but this blog is loading incredibly slow for
me. Is anyone else having this problem or is it
a issue on my end? I’ll check back later on and see if the problem
still exists.
site
Thank you for some other fantastic post.
Where else may just anybody get that kind of info in such a perfect method
of writing? I have a presentation next week, and I
am at the look for such info.
Fine art of photography
Having read this I thought it was extremely enlightening. I appreciate you finding the time and effort to put this informative article together. I once again find myself personally spending way too much time both reading and leaving comments. But so what, it was still worthwhile.
buy louis vuitton carpet online
This is a really good tip especially to those fresh to
the blogosphere. Brief but very accurate info… Many thanks for
sharing this one. A must read post!
Top CBD Companies
Genuinely when someone doesn’t understand afterward its up to other users that they will help,
so here it takes place.
israel security
Hello, its good post about media print, we all know media is
a wonderful source of information.
hair transplant Malaysia
I quite like reading an article that can make men and women think.
Also, thank you for allowing for me to comment!
Clean cut windows and doors
I am sure this piece of writing has touched all the internet viewers, its really really
pleasant piece of writing on building up new webpage.
https://rico.by/what-is-the-correct-cbd-oil-dosage-2/
Wonderful work! This is the type of information that are
meant to be shared around the web. Disgrace
on Google for not positioning this publish upper! Come on over and talk over with my web site .
Thank you =)
donate to israel projects
Fantastic beat ! I would like to apprentice while
you amend your web site, how could i subscribe for a blog web site?
The account helped me a acceptable deal. I had
been a little bit acquainted of this your broadcast offered bright clear idea
nhà dat quy nhon
It’s nearly impossible to find well-informed people in this particular topic, however, you seem like you know what you’re talking about! Thanks
mua bán nhà dat quy nhon
This site really has all of the info I needed concerning this subject and didn’t know who to ask.
CBD Oil
Do you have a spam issue on this website; I also am a blogger, and I was
wanting to know your situation; we have created some nice practices and we are
looking to exchange strategies with others, be sure to shoot me an email if interested.
Best CBD products
Undeniably believe that which you stated. Your favorite reason seemed
to be on the net the simplest thing to be aware of.
I say to you, I definitely get irked while people think about
worries that they plainly don’t know about. You managed to hit
the nail upon the top and also defined out the whole thing without having
side effect , people could take a signal. Will probably
be back to get more. Thanks
Clean mold on roof
This paragraph is truly a fastidious one it helps new internet
people, who are wishing in favor of blogging.
nhà dat quy nhon
This is the perfect web site for everyone who wishes to understand this topic. You know so much its almost tough to argue with you (not that I personally will need to…HaHa). You definitely put a new spin on a topic that has been discussed for a long time. Excellent stuff, just wonderful.
Jeffery
What i do not understood is actually how you’re no longer really much more well-liked than you may be now.
You’re so intelligent. You already know therefore considerably when it comes to
this topic, produced me in my opinion consider it from so many varied angles.
Its like women and men don’t seem to be involved except it is one
thing to do with Woman gaga! Your personal stuffs excellent.
Always handle it up!
brilliantlighttherapy
Wow, marvelous blog layout! How long have you been blogging for? you make blogging look easy. The overall look of your web site is great, let alone the content!
http://www.wknh.org/2020/02/17/how-to-select-the-proper-cbd-oil-for-you/
What’s up, all is going nicely here and ofcourse every one is sharing information,
that’s really good, keep up writing.
Top CBD Companies
Hi! Quick question that’s entirely off topic.
Do you know how to make your site mobile friendly?
My weblog looks weird when browsing from my iphone.
I’m trying to find a theme or plugin that might be able to resolve this issue.
If you have any recommendations, please share. Appreciate it!
business coach cairns
Can I just say what a relief to discover someone who truly knows what they are talking about on the net. You definitely know how to bring a problem to light and make it important. A lot more people ought to check this out and understand this side of your story. I can’t believe you aren’t more popular given that you definitely possess the gift.
professional training and coaching
An interesting discussion is worth comment. There’s no doubt that that you should publish more on this subject, it might not be a taboo subject but usually people don’t discuss such issues. To the next! Many thanks.
leadership development coaching
Great article. I’m facing a few of these issues as well..
stud earrings
The very next time I read a blog, I hope that it doesn’t disappoint me as much as this particular one. After all, Yes, it was my choice to read through, but I actually thought you would probably have something helpful to say. All I hear is a bunch of moaning about something you could possibly fix if you were not too busy searching for attention.
W88
You have made some good points there. I looked on the net to find out more about the issue and found most people will go along with your views on this web site.
Event Organizer in Jakarta - Indonesia
I was very happy to discover this site. I wanted to thank you for your time just for this wonderful read!! I definitely enjoyed every bit of it and i also have you bookmarked to look at new information in your website.
Federico Calderon Real Estate
I used to be able to find good info from your articles.
nettcasino
super slots casino download
spilleautomater
internet online casino
Las Vegas Real Estate
You made some good points there. I checked on the web to learn more about the issue and found most individuals will go along with your views on this site.
Federico Calderon Real Estate
This site was… how do I say it? Relevant!! Finally I’ve found something which helped me. Thanks a lot!
porn for you
you’re really a excellent webmaster. The web site loading pace is incredible. It kind of feels that you are doing any unique trick. In addition, The contents are masterpiece. you have performed a fantastic job on this matter!
Photography service
Thanks for every other great post. The place else may
just anybody get that kind of info in such an ideal way of writing?
I’ve a presentation next week, and I’m on the look for such information.
Kevin
Hmm it looks like your blog ate my first comment (it was extremely long) so I guess I’ll just sum it up what
I wrote and say, I’m thoroughly enjoying your
blog. I too am an aspiring blog writer but I’m still new to the whole thing.
Do you have any helpful hints for newbie blog writers?
I’d genuinely appreciate it.
Family Photography
Excellent post. I was checking constantly this weblog and I’m inspired!
Extremely helpful information specially the last
phase 🙂 I handle such info much. I was looking for this certain info for a very lengthy time.
Thank you and best of luck.
Naoussa Paros car rentals
I’m not that much of a online reader to be honest but your
sites really nice, keep it up! I’ll go ahead and bookmark your
website to come back in the future. Many thanks
Hire a car paros
What’s up, all is going well here and ofcourse every one is sharing information, that’s genuinely excellent, keep up writing.
Best CBD products
My brother suggested I might like this web site.
He was totally right. This post actually made my day.
You can not imagine simply how much time I had spent for this info!
Thanks!
#CAITLINMARTIN
Hi! I’ve been following your blog for some time now and finally got
the courage to go ahead and give you a shout out from Houston Texas!
Just wanted to mention keep up the great work!
Naoussa Paros car rentals
Wow, this post is good, my sister is analyzing these things, therefore I am going to tell
her.
Purva Between The Parks
I every time used to study article in news papers but now as I
am a user of internet thus from now I am using
net for content, thanks to web.
w88ok
Hello, i think that i saw you visited my web site thus i came to “return the favor”.I’m trying to
find things to enhance my website!I suppose its ok to use a few of
your ideas!!
top 10 hottest harry potter characters
Wow, fantastic blog layout! How long have you been blogging for?
you make blogging look easy. The overall look of your site is
magnificent, let alone the content!
w88ok
Wonderful beat ! I wish to apprentice while
you amend your site, how could i subscribe for a blog site?
The account helped me a acceptable deal. I had been tiny bit acquainted of this your broadcast provided bright clear concept
Rent a Moto Paros
I am really grateful to the owner of this web site who has shared this
fantastic article at at this place.
top 10 hottest female actresses
Hi! I know this is kind of off topic but I was wondering which blog platform
are you using for this site? I’m getting tired of WordPress because I’ve had issues with
hackers and I’m looking at alternatives for another platform.
I would be fantastic if you could point me in the direction of a good platform.
CBD Oil
Thanks for every other informative site. The place else could I am getting that type of info written in such an ideal
approach? I have a challenge that I’m just now operating
on, and I have been on the glance out for such information.
w88ok
Hello there, I found your website via Google even as searching for a comparable subject, your website got here up, it seems great.
I have bookmarked it in my google bookmarks.
Hello there, simply become alert to your weblog thru Google, and located that it is really informative.
I am gonna be careful for brussels. I’ll be grateful in case you continue this in future.
Numerous other folks will probably be benefited from your
writing. Cheers!
technical and vocational training lab equipments
Right here is the perfect website for anybody
who would like to find out about this topic. You understand so much
its almost hard to argue with you (not that I actually will need to…HaHa).
You certainly put a new spin on a topic which has been discussed for a long time.
Great stuff, just excellent!
http://ingiarethaibinh.com.vn/?option=com_k2&view=itemlist&task=user&id=1233834
Everything is very open with a very clear description of the issues.
It was really informative. Your site is extremely helpful.
Thank you for sharing!
Purva Between The Parks
Greetings! I’ve been reading your weblog for a while now and finally got the
courage to go ahead and give you a shout out from Austin Texas!
Just wanted to tell you keep up the excellent work!
Best CBD products
Hi! This post couldn’t be written any better! Reading this
post reminds me of my good old room mate! He always
kept talking about this. I will forward this page to him.
Pretty sure he will have a good read. Thank you for sharing!
uniben courses departments university benin
An outstanding share! I have just forwarded this onto a friend who was doing a little homework on this. And he in fact bought me breakfast because I discovered it for him… lol. So allow me to reword this…. Thank YOU for the meal!! But yeah, thanks for spending time to talk about this matter here on your web page.
free fortnite account
I am extremely impressed with your writing skills as well as
with the layout on your blog. Is this a paid theme
or did you modify it yourself? Anyway keep up the nice quality
writing, it is rare to see a nice blog like this one nowadays.
forex-watchers.com
An impressive share! I’ve just forwarded this onto a friend
who was doing a little homework on this. And he in fact bought me dinner due to
the fact that I discovered it for him… lol. So allow me to reword this….
Thank YOU for the meal!! But yeah, thanx for spending some time to
discuss this issue here on your internet site.
wholesale from china
Saved as a favorite, I like your site!
anunturi Londra
Thank you for the good writeup. It in fact was a amusement account it.
Look advanced to far added agreeable from you! However, how
could we communicate?
moving company sarasota
Thank you for the auspicious writeup. It in reality was once a enjoyment account it. Glance advanced to more brought agreeable from you! However, how can we keep in touch?
wholesale from china
Useful information. Fortunate me I discovered your web site
by chance, and I’m surprised why this twist of fate did not came about in advance!
I bookmarked it.
dotafrog
Pretty nice post. I just stumbled upon your blog and wished to say that I’ve really enjoyed browsing your blog posts. After all I’ll be subscribing to your rss feed and I hope you write again soon!
reclama uk
Undeniably consider that that you said. Your favorite justification appeared to be on the
web the easiest factor to be mindful of. I say to you, I certainly get annoyed
even as other people think about concerns that they plainly do not know about.
You managed to hit the nail upon the top as neatly as defined out the whole thing with no need side-effects ,
people can take a signal. Will probably be again to get more.
Thanks
w88
Hmm is anyone else encountering problems with the images on this
blog loading? I’m trying to find out if its a problem on my end or if it’s
the blog. Any suggestions would be greatly appreciated.
w88
You’ve made some really good points there.
I checked on the web to learn more about the issue and found
most people will go along with your views on this site.
online survey creator
A fascinating discussion is worth comment. There’s no doubt that that you ought to
publish more on this subject, it might not be a taboo subject but typically people do not discuss these
issues. To the next! Best wishes!!
w88
Thanks in favor of sharing such a fastidious thinking, post
is pleasant, thats why i have read it completely
w88
Does your blog have a contact page? I’m having problems locating it but, I’d like to send you an email.
I’ve got some creative ideas for your blog you might be interested in hearing.
Either way, great site and I look forward to seeing it
improve over time.
w88
This design is steller! You most certainly know how to keep
a reader amused. Between your wit and your videos, I was
almost moved to start my own blog (well, almost…HaHa!) Wonderful
job. I really enjoyed what you had to say, and more than that, how you presented it.
Too cool!
survey creator
Good post. I learn something new and challenging on sites I stumbleupon on a
daily basis. It’s always exciting to read articles from other authors and practice
something from their sites.
w88
Do you have a spam problem on this site; I also am a blogger, and I was wanting to know your situation; many of us have created
some nice practices and we are looking to swap methods with
other folks, please shoot me an e-mail if interested.
w88
I blog quite often and I seriously appreciate your information. This
great article has truly peaked my interest. I am going to take a note
of your website and keep checking for new information about
once per week. I subscribed to your RSS feed too.
Financial advisers Australia
I am actually grateful to the owner of this
site who has shared this enormous piece of writing at here.
belajarforexoption.com
I wanted to thank you for this good read!! I absolutely
enjoyed every little bit of it. I have got you book marked to
check out new stuff you post…
plumber financial advice
Wow, wonderful weblog format! How long have you been blogging for?
you make blogging glance easy. The entire glance of your site is fantastic, as neatly
as the content material!
w88
My partner and I stumbled over here by a different web page and thought
I may as well check things out. I like what I see so now i’m following you.
Look forward to checking out your web page for a second time.
free fortnite skins
When someone writes an piece of writing he/she keeps the thought of
a user in his/her brain that how a user can know it. Therefore that’s
why this paragraph is great. Thanks!
reclama Londra
Greetings, I do think your site could be having browser compatibility issues.
When I take a look at your web site in Safari, it looks fine however, if opening in Internet Explorer, it’s got some overlapping issues.
I merely wanted to give you a quick heads up! Apart from that,
excellent blog!
free survey creator
I really like reading a post that can make men and women think.
Also, many thanks for allowing me to comment!
پنل اس ام اس
Very nice write-up. I absolutely love this website.
Thanks!
bond services
I am regular reader, how are you everybody? This paragraph posted at this web page is really good.
free survey creator
If some one desires to be updated with most recent technologies therefore he
must be visit this website and be up to date all the time.
MMA Live stream
I am regular visitor, how are you everybody? This paragraph posted at this web
page is truly good.
w88
When someone writes an article he/she maintains the plan of
a user in his/her brain that how a user can know it. Therefore that’s why this post is perfect.
Thanks!
CBD pre roll
When someone writes an paragraph he/she keeps the idea of a user in his/her mind that how a
user can be aware of it. Therefore that’s why this article is perfect.
Thanks!
http://advancededmconsulting.com/index.php/2020/02/19/an-sincere-overview-about-the-benefits-of-cbd-products/
Actually when someone doesn’t be aware of after that
its up to other people that they will help, so here it
occurs.
Hershel
Everyone loves what you guys are up too. Such clever
work and reporting! Keep up the wonderful works guys
I’ve included you guys to our blogroll.
W88
It’s an amazing paragraph designed for all the web viewers;
they will obtain benefit from it I am sure.
Lavonda
I’m not that much of a online reader to be honest but your blogs really
nice, keep it up! I’ll go ahead and bookmark your site to come back in the future.
Many thanks
w88
I think this is among the most significant information for me.
And i am glad reading your article. But should remark on few general things, The web site style is wonderful, the articles is really nice : D.
Good job, cheers
Annie
Pretty nice post. I just stumbled upon your blog and wanted to say
that I have really enjoyed browsing your blog posts. In any case I will be subscribing to your feed and I hope you write again soon!
Best CBD products
Right here is the right blog for everyone who wants
to find out about this topic. You realize so much its almost hard to
argue with you (not that I actually will need to…HaHa).
You definitely put a new spin on a subject that has been discussed
for ages. Wonderful stuff, just wonderful!
https://consumersearchamz.com/cbd-oil-tincture-one-of-best-sleep-aids-4/
Quality articles is the key to interest the
viewers to go to see the web site, that’s what this web page is providing.
w88
Heya are using WordPress for your site platform?
I’m new to the blog world but I’m trying to get started and create my own. Do you
require any html coding expertise to make your own blog?
Any help would be really appreciated!
http://roudah.com/index.php/en/component/k2/itemlist/user/925950
Excellent blog you have here.. It’s hard to find good quality writing like
yours these days. I honestly appreciate individuals like you!
Take care!!
http://27.124.27.125
Howdy great website! Does running a blog like this require a large amount of work?
I have no expertise in programming however I was hoping to start my own blog in the near future.
Anyways, if you have any suggestions or tips for new blog
owners please share. I understand this is off topic however I just needed to ask.
Appreciate it!
Moroccan Handicrafts
If you are going for finest contents like I do, only pay a visit this web site
all the time since it presents feature contents, thanks
ffp3 mask
I want to to thank you for this very good read!! I definitely loved every little bit of it.
I’ve got you bookmarked to look at new things you
post…
ffp2 dust mask
Thanks for sharing your thoughts about gloves. Regards
w88
Whats up very nice website!! Man .. Excellent .. Superb ..
I will bookmark your site and take the feeds also? I’m happy to find so many useful information here within the
publish, we want develop more techniques in this regard, thank you for sharing.
. . . . .
Brand
I was suggested this blog by my cousin. I’m not sure whether this post is written by him as no one else know such detailed about my trouble.
You’re incredible! Thanks!
Online Store
Hiya! Quick question that’s completely off topic. Do you know how to make your site mobile friendly?
My weblog looks weird when browsing from my iphone 4.
I’m trying to find a template or plugin that might
be able to fix this issue. If you have any suggestions, please share.
Appreciate it!
w88
Hey, I think your site might be having browser compatibility issues.
When I look at your blog in Ie, it looks fine but when opening in Internet Explorer,
it has some overlapping. I just wanted to give you a quick heads up!
Other then that, great blog!
Purva Promenade
Wow, this paragraph is pleasant, my younger sister is analyzing these things, thus I am going to inform her.
coronavirus mask
Greetings! Very helpful advice within this post! It is the little changes that will
make the most important changes. Thanks a lot
for sharing!
w88
each time i used to read smaller articles that also clear their motive, and that is also
happening with this piece of writing which I am reading now.
Medium
Hello there, I believe your site might be having internet browser compatibility problems.
When I look at your website in Safari, it looks fine however when opening in IE, it’s got some overlapping issues.
I simply wanted to provide you with a quick heads up!
Apart from that, great blog!
Clothing
Nice post. I used to be checking constantly this blog
and I am inspired! Very useful information specially the closing part 🙂
I handle such information much. I was looking for this particular information for a long time.
Thanks and best of luck.
best cbd for athletes uk
It’s a shame you don’t have a donate button! I’d without a doubt donate to this outstanding blog!
I guess for now i’ll settle for book-marking and adding your RSS feed to
my Google account. I look forward to fresh updates and will share this site with my Facebook
group. Talk soon!
boutique artisanat marocain
What’s up to every one, it’s genuinely a nice for
me to pay a quick visit this web page, it contains useful Information.
caftan marocain
After checking out a few of the blog articles
on your web site, I seriously appreciate your
technique of blogging. I saved it to my bookmark website
list and will be checking back in the near future. Take a look at my web site too and tell me how you feel.
coronavirus mask
I think that everything said was actually very logical.
However, think on this, suppose you typed a catchier title?
I ain’t saying your content is not solid., but suppose you
added a title that grabbed folk’s attention? I mean Enrollment, Tuition,
and Discount Rate: The Sweet Briar Story, Part 3 –
Unsolicited Guru is kinda vanilla. You ought to glance at Yahoo’s
front page and watch how they create article headlines to get viewers to click.
You might add a video or a related pic or two to grab people excited about everything’ve got to
say. In my opinion, it would make your posts a little livelier.
Wedding Venue in Fort Lauderdale
Greetings! This is my first visit to your blog!
We are a collection of volunteers and starting a new initiative in a community in the same
niche. Your blog provided us beneficial information to work on. You have
done a marvellous job!
moroccan handicraft store
I feel that is one of the most vital information for me.
And i’m satisfied studying your article. But should statement on few general things,
The web site taste is ideal, the articles is in point of fact nice :
D. Good job, cheers
Free Robux Generator
Hey there! This is kind of off topic but I need some
advice from an established blog. Is it difficult to set up your
own blog? I’m not very techincal but I can figure things out pretty
fast. I’m thinking about making my own but I’m not sure where to start.
Do you have any tips or suggestions? Thank you
W88
Hey There. I discovered your blog the usage of msn. This is a
very smartly written article. I’ll be sure to bookmark it and return to learn more of
your useful info. Thank you for the post. I will certainly return.
steampunk jewellery
Great blog you have got here.. It’s hard to find excellent writing like yours nowadays. I seriously appreciate people like you! Take care!!
Moroccan handicraft
Do you mind if I quote a few of your articles as long as
I provide credit and sources back to your webpage?
My blog is in the very same niche as yours and my users would truly benefit from
a lot of the information you present here. Please
let me know if this ok with you. Thank you!
w88
Wonderful web site. Lots of helpful info
here. I am sending it to a few buddies ans also sharing in delicious.
And obviously, thanks to your effort!
coronavirus dust mask
Superb site you have here but I was curious about
if you knew of any user discussion forums that cover the same topics discussed here?
I’d really love to be a part of group where I can get responses from other knowledgeable individuals that share the same interest.
If you have any suggestions, please let me know. Appreciate it!
Online Store
I just like the valuable information you supply to your articles.
I’ll bookmark your blog and take a look at once more right here regularly.
I am slightly sure I’ll be told a lot of new stuff right
here! Best of luck for the next!
CBD Oil Companies
Hello to every one, the contents existing at this web site are genuinely awesome for people
knowledge, well, keep up the nice work fellows.
Louise
I have learn some excellent stuff here. Definitely worth bookmarking for revisiting.
I wonder how a lot attempt you put to make this sort of excellent
informative website.
Best CBD Oil
What i don’t understood is in fact how you’re not actually a lot more well-favored than you may
be now. You are so intelligent. You recognize thus considerably on the subject of this matter, made me in my opinion consider it from a lot of numerous angles.
Its like women and men don’t seem to be interested unless it is
one thing to do with Lady gaga! Your individual stuffs excellent.
At all times maintain it up!
sony vegas pro crack
Pretty! This was a really wonderful post. Thanks for supplying this info.
Moroccan Djellaba for men
I love your blog.. very nice colors & theme.
Did you design this website yourself or did you hire someone to do it for you?
Plz answer back as I’m looking to design my own blog and
would like to find out where u got this from. kudos
portwest dust mask
Hi, i think that i noticed you visited my web site thus i got here
to go back the prefer?.I am attempting to
find issues to improve my website!I assume its
good enough to use some of your ideas!!
w88
Wow, this paragraph is fastidious, my sister is analyzing these kinds of things,
so I am going to convey her.
Brand
Hello, the whole thing is going well here and ofcourse every one is sharing data,
that’s truly fine, keep up writing.
Best CBD Oil
I believe everything said made a bunch of sense. But, what about this?
what if you typed a catchier post title? I ain’t saying your information is
not solid., however suppose you added something to possibly get folk’s attention? I mean Enrollment,
Tuition, and Discount Rate: The Sweet Briar Story, Part 3 – Unsolicited Guru is kinda plain. You might
glance at Yahoo’s home page and watch how they create post titles to get people to open the links.
You might try adding a video or a pic or
two to get people interested about what you’ve written. In my opinion, it might make your website a little livelier.
http://www.enderyener.com/why-you-need-to-have-the-best-cbd-oil-at-home-4/
I was wondering if you ever thought of changing the page layout of your site?
Its very well written; I love what youve got to say. But maybe you
could a little more in the way of content so people could connect with it better.
Youve got an awful lot of text for only having 1 or two
pictures. Maybe you could space it out better?
Clinton
Hi to every , since I am in fact eager of reading
this webpage’s post to be updated regularly.
It includes good data.
Bakhour
Wow that was strange. I just wrote an very long comment but after I
clicked submit my comment didn’t show up. Grrrr…
well I’m not writing all that over again. Anyhow, just wanted to say excellent blog!
http://www.garytonkin.com/2020/02/20/is-cbd-oil-worth-the-hype-5/
Hi there to every one, the contents existing at this website
are truly amazing for people knowledge, well, keep up the nice work fellows.
Vallie
Wow, awesome weblog structure! How lengthy have you
been blogging for? you make running a blog look easy.
The whole look of your web site is great, let alone the content material!
CBD Oil Companies
I need to to thank you for this great read!! I absolutely loved every bit of it.
I have you book-marked to check out new stuff you post…
http://ortodent.spb.ru/index.php/en/component/k2/itemlist/user/1953154.html
Good post however , I was wondering if you could write a litte more on this subject?
I’d be very grateful if you could elaborate a little bit more.
Appreciate it!
Effie
If some one wishes expert view concerning blogging and site-building then i suggest him/her to visit this blog, Keep up the pleasant job.
Best CBD Oil
What’s up it’s me, I am also visiting this web page on a regular
basis, this web page is actually good and the users are genuinely
sharing pleasant thoughts.
Best CBD Oil
I blog quite often and I really appreciate your content.
This article has truly peaked my interest. I will take a note of your site and keep checking for new details about once a week.
I opted in for your Feed too.
Legal justice Advocates
Your style is so unique in comparison to other people I have read stuff from. Thanks for posting when you’ve got the opportunity, Guess I will just bookmark this blog.
Best CBD products
I used to be recommended this web site via my cousin. I am not sure whether this post is written through him as no one else know
such specified about my difficulty. You’re incredible!
Thank you!
Buy Phone Battery Online
Wow! This could be one particular of the most helpful blogs We have ever arrive across on this subject. Basically Fantastic. I’m also a specialist in this topic so I can understand your effort.
http://www.zigzadsmedia.com/business/stunning-ways-folks-are-using-cbd/
Howdy! This post could not be written much better!
Going through this article reminds me of my
previous roommate! He continually kept talking
about this. I will send this post to him. Fairly certain he will have
a good read. Thanks for sharing!
Mahalia
certainly like your web-site but you have to check the spelling on quite
a few of your posts. Several of them are rife with spelling problems
and I in finding it very troublesome to inform the truth however I will definitely come back again.
reff.net.ua
Heya excellent blog! Does running a blog like this take a lot
of work? I have no expertise in computer programming however I was hoping to start my
own blog in the near future. Anyway, if you have any suggestions or techniques for new
blog owners please share. I understand this is off subject however I just wanted to ask.
Cheers!
maleextra
This page certainly has all the information and facts I wanted about this subject and didn’t know who to ask.
coronavirus face mask
When I initially left a comment I appear to have clicked the -Notify me when new comments are added- checkbox
and now whenever a comment is added I recieve four emails with the exact same comment.
Perhaps there is an easy method you can remove me from that service?
Appreciate it!
DJI
Hey! I know this is somewhat off topic but I was wondering if you knew where
I could locate a captcha plugin for my comment form? I’m using the same blog platform as yours and I’m
having difficulty finding one? Thanks a lot!
http://tiaphari.online/2020/02/22/lorrinemckenzie/the-usefelness-of-udemy/
What’s up friends, how is everything, and what you wish for to
say on the topic of this paragraph, in my view its really awesome in support
of me.
cbd oil houston
I am extremely impressed together with your writing talents
and also with the structure for your blog.
Is this a paid topic or did you customize it your self?
Either way stay up the nice high quality writing, it
is rare to peer a great blog like this one today..
seo digital marketing agency
Link exchange is nothing else except it is only placing
the other person’s website link on your page at suitable place and other person will also do same in favor of you.
web site
Enerji Danışmanlığı Merkezi. İşin uzmanları bir arada. SKTT, Enerji Satın Alma, Çift Terim,Tarife Yönetimi, Verimlilik Artırıcı Projeler, Çatı GES, Enerji Kimlik …
coronavirus mask
Hi there everyone, it’s my first visit at this site, and article is in fact
fruitful for me, keep up posting these types of content.
Georgetown Texas cbd oil
Amazing! Its in fact remarkable paragraph, I have got much clear idea regarding from this paragraph.
https://www.grandviewinternational.ca/the-usefelness-of-udemy/
Amazing things here. I’m very satisfied to peer your post.
Thank you a lot and I am having a look forward to touch you.
Will you please drop me a mail?
crazy bulk avis
I quite like reading through an article that will make men and women think. Also, thank you for allowing for me to comment.
cell phones
Great article. I’m dealing with some of these issues as well..
organic products
Having read this I thought it was really informative. I appreciate you spending some time and energy to put this article together. I once again find myself personally spending way too much time both reading and commenting. But so what, it was still worth it!
USB Powered LED Mosquito Killer Lamp Insect Trap
Good day! I simply wish to offer you a big thumbs up for the excellent info you’ve got here on this post. I am coming back to your blog for more soon.
mailing labels sticker
Good post. I learn something new and challenging on blogs I stumbleupon every day. It will always be exciting to read content from other writers and use something from their websites.
betgram
Usually I do not learn post on blogs, however I wish to say that this write-up very forced me to take a look at and do it! Your writing taste has been amazed me. Thank you, very great post.
super peach wear
Hello there! I could have sworn I’ve visited this blog before but after going through a few of the posts I realized it’s new to me. Nonetheless, I’m certainly delighted I came across it and I’ll be book-marking it and checking back often!
mobil bahis bedava bahis
Hi, i read your blog occasionally and i own a similar one and i was just wondering if you get a lot of spam comments? If so how do you prevent it, any plugin or anything you can advise? I get so much lately it’s driving me crazy so any help is very much appreciated.
free fortnite skins Generator
Today, while I was at work, my sister stole my apple ipad and tested to see if it can survive a forty foot drop,
just so she can be a youtube sensation. My apple ipad
is now broken and she has 83 views. I know this is totally off topic but I had to share it with
someone!
Placenta benefits
I need to to thank you for this fantastic read!! I certainly enjoyed every bit of it. I have got you book marked to look at new stuff you post…
pet hair vacuum
Heya i’m for the first time here. I came across this board and I find
It really useful & it helped me out much. I hope to give something back and
aid others like you aided me.
3m n95 price
My relatives always say that I am wasting my time here at web, except I know I am getting know-how daily by reading such nice articles
or reviews.
pregnancy classes near me
I like the valuable info you provide in your articles. I
will bookmark your weblog and check again here regularly.
I’m quite certain I will learn a lot of new stuff right here!
Good luck for the next!
prenatal education Denver Colorado
Why viewers still make use of to read news papers when in this technological
world the whole thing is existing on web?
hardware wholesaler
Whoa! This blog looks just like my old one! It’s on a totally different subject but it
has pretty much the same page layout and design. Great
choice of colors!
热玛吉 英国
Hello friends, how is everything, and what you wish for to say regarding
this piece of writing, in my view its really remarkable
designed for me.
dog grooming
magnificent issues altogether, you just won a new reader.
What may you recommend about your publish that you simply made a
few days in the past? Any positive?
伦敦热玛吉
If you are going for best contents like I do, only visit
this site all the time since it gives feature contents, thanks
car pet hair remover
I read this article fully regarding the comparison of most up-to-date and preceding technologies, it’s awesome article.
website
em@gmail.com
free fortnite skins
Hello! Do you know if they make any plugins to help with SEO?
I’m trying to get my blog to rank for some targeted keywords but I’m not seeing very good success.
If you know of any please share. Kudos!
热玛吉英国
As the admin of this web site is working, no doubt very rapidly it
will be famous, due to its quality contents.
best pet hair remover
Greetings from California! I’m bored to death at work so I decided to browse your website on my iphone during lunch break.
I enjoy the info you provide here and can’t wait to take a look when I get home.
I’m shocked at how quick your blog loaded on my phone ..
I’m not even using WIFI, just 3G .. Anyhow, fantastic site!
英国热玛吉
Hi there, this weekend is pleasant for me, since this occasion i am reading this
great informative piece of writing here at my residence.
surgical face shield
I think that what you typed made a bunch of sense. However, think on this,
what if you added a little information? I ain’t saying
your information is not solid., however suppose you added a headline that grabbed folk’s attention? I mean Enrollment, Tuition,
and Discount Rate: The Sweet Briar Story, Part 3 – Unsolicited Guru is
a little boring. You ought to look at Yahoo’s home page and
watch how they create article titles to grab people to click.
You might add a video or a related pic or two to grab readers excited about everything’ve written. Just my opinion, it might bring your blog a little livelier.
free fortnite skins
Hey there! Do you use Twitter? I’d like to follow you if that would be okay.
I’m absolutely enjoying your blog and look forward to new
posts.
Bed assembly service
I enjoy the efforts you have put in this, thank you for all the great content.
CBD
Your style is very unique in comparison to other people I’ve read stuff from. Thank you for posting when you’ve got the opportunity, Guess I’ll just bookmark this blog.
read more
May I simply say what a relief to find someone that really knows what they are discussing on the net. You actually know how to bring a problem to light and make it important. A lot more people really need to check this out and understand this side of the story. I was surprised you aren’t more popular given that you surely have the gift.
source
Way cool! Some very valid points! I appreciate you penning this write-up and also the rest of the website is really good.
read more
I couldn’t refrain from commenting. Well written.
here
I’m impressed, I must say. Rarely do I come across a blog that’s both equally educative and engaging, and without a doubt, you’ve hit the nail on the head. The issue is something which too few people are speaking intelligently about. I’m very happy that I came across this in my search for something relating to this.
source
I have to thank you for the efforts you have put in penning this site. I really hope to check out the same high-grade blog posts by you later on as well. In truth, your creative writing abilities has motivated me to get my very own site now 😉
here
I would like to thank you for the efforts you’ve put in penning this blog. I am hoping to see the same high-grade blog posts by you in the future as well. In fact, your creative writing abilities has encouraged me to get my own blog now 😉
here
Having read this I thought it was really informative. I appreciate you spending some time and effort to put this information together. I once again find myself personally spending a lot of time both reading and posting comments. But so what, it was still worth it!
cheap beverages
Magnificent goods from you, man. I’ve be aware your stuff previous to and you are just extremely magnificent. I actually like what you have bought right here, certainly like what you are stating and the way in which during which you say it. You make it entertaining and you continue to take care of to keep it smart. I can not wait to learn much more from you. That is really a terrific web site.
click here
Having read this I believed it was very informative. I appreciate you spending some time and energy to put this short article together. I once again find myself personally spending way too much time both reading and posting comments. But so what, it was still worth it!
trap out
Hurrah, that’s what I was searching for, what a stuff!
existing here at this web site, thanks admin of this website.
performance marketing
I do not even know how I ended up here, but I thought this post was great.
I don’t know who you are but definitely you’re
going to a famous blogger if you aren’t already 😉 Cheers!
Personal Trainer Apeldoorn
I’ll immediately snatch your rss as I can not to find your email subscription link or newsletter service.
Do you’ve any? Please allow me understand so that I may just subscribe.
Thanks.
Personal Trainer
I like what you guys tend to be up too. Such clever work and exposure!
Keep up the very good works guys I’ve added you guys to my personal blogroll.
top bar beehive
Hmm it looks like your blog ate my first comment (it was super long) so I guess I’ll just sum
it up what I had written and say, I’m thoroughly
enjoying your blog. I too am an aspiring blog blogger
but I’m still new to everything. Do you have any helpful hints for first-time
blog writers? I’d really appreciate it.
buy weed in eu
hi!,I like your writing so much! proportion we communicate extra about your article on AOL? I require a specialist on this space to unravel my problem. Maybe that’s you! Looking ahead to peer you.
Jaisalmer escorts service
It¡¦s truly a great and useful piece of info. I¡¦m satisfied that you just shared this helpful info with us. Please stay us informed like this. Thank you for sharing.
Houses To Buy
This info is invaluable. When can I find out more?
mega888
I know this website offers quality depending articles or reviews and additional stuff, is there any other
site which provides these kinds of things in quality?
Bathroom remodeling
I used to be able to find good info from your blog articles.
Leefstijlcoach Arnhem Apeldoorn
hello!,I really like your writing very so much! proportion we keep in touch extra about
your post on AOL? I need a specialist on this house to unravel my problem.
May be that is you! Having a look ahead to look you.
w88
When some one searches for his necessary thing, thus he/she wishes to be available
that in detail, so that thing is maintained over here.
ww88
Very good site you have here but I was wanting
to know if you knew of any message boards that cover the same topics talked about here?
I’d really like to be a part of online community where I can get responses from other
experienced individuals that share the same interest. If you have any suggestions,
please let me know. Bless you!
free fortnite account
Hello it’s me, I am also visiting this web site daily, this site
is in fact nice and the visitors are really sharing
pleasant thoughts.
Free Robux
I know this web page provides quality dependent
articles and other data, is there any other website which
gives these stuff in quality?
here
Very good blog post. I definitely appreciate this website. Thanks!
this contractor
I’ve been exploring for a bit for any high-quality articles or weblog posts
on this kind of area . Exploring in Yahoo I eventually stumbled upon this web site.
Studying this info So i’m satisfied to show that I have a very
just right uncanny feeling I found out exactly what I needed.
I such a lot definitely will make certain to don?t overlook this
website and provides it a look regularly.
here
Everyone loves it when folks get together and share ideas. Great website, continue the good work!
ww88
Fantastic site. Plenty of helpful info here. I am sending it to some buddies ans additionally sharing in delicious.
And certainly, thanks in your sweat!
mega888
Saved as a favorite, I really like your web site!
Best egusi soup in La
Everyone loves it when individuals come together and share ideas. Great site, continue the good work!
green planet builders
Spot on with this write-up, I actually believe this site needs a lot more attention. I’ll probably be back
again to read more, thanks for the information!
Motion graphics agency
Wonderful goods from you, man. I’ve remember your stuff previous
to and you are simply too wonderful. I actually like what you’ve obtained
here, really like what you are stating and the way in which you assert it.
You are making it enjoyable and you continue to take care of to keep
it sensible. I can’t wait to learn far more from you. This is actually a
wonderful website.
this company
Thanks for your marvelous posting! I genuinely enjoyed reading it, you can be a great author.I will remember to bookmark your blog and definitely will come back from
now on. I want to encourage you to continue your great work, have a nice weekend!
Best grapes (the fruit) in La
Everything is very open with a clear explanation of the issues. It was definitely informative. Your website is very useful. Thanks for sharing!
Web design & maintenance
Hi there! Do you know if they make any plugins to protect against hackers?
I’m kinda paranoid about losing everything I’ve worked hard on. Any tips?
Leefstijlcoach Arnhem Apeldoorn
Hello there, I found your website by means of Google whilst looking for a similar subject,
your web site came up, it appears to be like good.
I have bookmarked it in my google bookmarks.
Hi there, just become alert to your weblog through Google, and
found that it is truly informative. I am gonna watch out for brussels.
I will appreciate for those who continue this in future.
A lot of folks will likely be benefited from your
writing. Cheers!
Laverne
Hello! I understand this is sort of off-topic but I needed to ask.
Does managing a well-established website such as yours require a
lot of work? I am completely new to writing a blog however I do write in my diary on a daily basis.
I’d like to start a blog so I can easily share my experience and thoughts online.
Please let me know if you have any kind of suggestions or tips for brand new aspiring blog owners.
Appreciate it!
Raleigh NC
Very good post. I am dealing with some of these issues as well..
Property Inspection Fayetteville NC
Good article. I am experiencing a few of these issues as well..
Website
Can I simply say what a relief to find an individual who truly understands what they are talking about on the net. You actually realize how to bring a problem to light and make it important. A lot more people ought to check this out and understand this side of the story. I can’t believe you are not more popular given that you most certainly possess the gift.
free fortnite skins Generator
Wow, incredible weblog layout! How lengthy have you been blogging for?
you make running a blog look easy. The total look
of your site is magnificent, as neatly as the content!
درب اتوماتیک شیشه ای
of course like your web site but you need to test the spelling on several of your posts.
Many of them are rife with spelling problems and I
in finding it very troublesome to tell the truth then again I’ll definitely come again again.
Bathroom Fitters in Fulham
Heya i am for the first time here. I came across this
board and I in finding It really useful & it helped me out a
lot. I’m hoping to present something again and aid others such as you helped me.
gclub
I’ve learn some just right stuff here. Certainly price
bookmarking for revisiting. I wonder how a lot attempt you set to make the sort of fantastic
informative website.
800 Remodeling
My brother suggested I might like this web site. He was entirely right.
This submit actually made my day. You cann’t consider just how a lot time I had spent
for this info! Thank you!
emergency
I’ve been browsing online greater than 3 hours nowadays, yet I by no
means found any interesting article like yours. It is lovely worth enough for
me. In my view, if all web owners and bloggers
made excellent content as you probably did, the internet can be much more
helpful than ever before.
Bathroom Fitters in Fulham
Hi there, this weekend is fastidious for me,
as this moment i am reading this fantastic informative
piece of writing here at my house.
w888
Useful information. Lucky me I found your
web site unintentionally, and I’m stunned why this coincidence did not took place
in advance! I bookmarked it.
Abbruch aus Lübeck
I used to be able to find good advice from your articles.
adcada
Great post.
mi service kannur
Appreciation to my father who stated to me regarding this weblog, this weblog is
in fact amazing.
دانلود رام موبایل
Wow, this post is good, my sister is analyzing these kinds
of things, thus I am going to let know her.
agencia mkt digital
We’re a group of volunteers and starting a new scheme in our community.
Your website offered us with valuable information to work on. You have done
an impressive job and our whole community will be grateful to you.
school safety training
Very good post. I am experiencing some of these issues as well..
Incense Burners
Hiya! I know this is kinda off topic however I’d figured I’d ask.
Would you be interested in trading links or maybe guest writing a blog article or
vice-versa? My website addresses a lot of the same topics as
yours and I think we could greatly benefit from each other.
If you’re interested feel free to shoot me an email. I
look forward to hearing from you! Superb blog by the way!
Free Robux
Why visitors still use to read news papers when in this technological globe
everything is available on web?
SEO Services in MD
After going over a few of the articles on your site, I truly appreciate your technique of writing a blog. I saved it to my bookmark webpage list and will be checking back in the near future. Take a look at my web site as well and let me know how you feel.
financial technology news
I know this if off topic but I’m looking into starting my own weblog and
was wondering what all is needed to get setup?
I’m assuming having a blog like yours would cost a
pretty penny? I’m not very web savvy so I’m not 100% sure.
Any recommendations or advice would be greatly appreciated.
Cheers
درب اتوماتیک شیشه ای
Very energetic blog, I enjoyed that a lot. Will there be a part 2?
adcada
I have to thank you for the efforts you have put in penning this website.
I really hope to view the same high-grade blog posts by you in the
future as well. In fact, your creative writing abilities has inspired me to get my very own blog now
😉
เช่าเก้าอี้
Hi, I log on to your blogs daily. Your story-telling style is witty,
keep up the good work!
800 Remodeling
When someone writes an post he/she keeps the idea of a user in his/her mind that how a user can know it.
Thus that’s why this piece of writing is perfect. Thanks!
mi service center kannur
I don’t even know how I ended up here, but I thought this post was good.
I don’t know who you are but definitely you’re going to
a famous blogger if you are not already 😉 Cheers!
درمان بیماری پسوریازیس - درمان بیماری صدف
I have been surfing online more than three hours
today, yet I never found any interesting article
like yours. It is pretty worth enough for me. Personally, if
all web owners and bloggers made good content as you did, the internet will
be a lot more useful than ever before.
Your trusted South London window & door company
Nice blog here! Also your website loads up fast!
What web host are you using? Can I get your affiliate link
to your host? I wish my site loaded up as quickly as yours lol
دانلود رام موبایل
I used to be suggested this web site by way of my
cousin. I’m no longer sure whether this post is written by way of him as nobody else recognize
such special about my trouble. You’re amazing! Thank you!
Royal Online V2
Wow, that’s what I was exploring for, what a data!
present here at this weblog, thanks admin of this website.
agencia marketing digital
Hey very interesting blog!
درب شیشه ای اتوماتیک در کرج
I’m not that much of a online reader to be honest but your blogs really nice, keep it up!
I’ll go ahead and bookmark your site to come back down the road.
All the best
medical face masks
excellent submit, very informative. I’m wondering why the opposite experts of this sector do not notice
this. You should proceed your writing. I’m sure, you have a great readers’ base already!
hosptality management course philippines
Superb blog! Do you have any suggestions for aspiring writers?
I’m hoping to start my own site soon but I’m a
little lost on everything. Would you recommend starting with a free
platform like WordPress or go for a paid option? There are so many options out there that I’m totally
confused .. Any recommendations? Thank you!
เช่าเก้าอี้
Wonderful, what a blog it is! This webpage presents useful facts to us, keep it up.
bitcoin wallet
Hey there are using WordPress for your site platform?
I’m new to the blog world but I’m trying to get started and set up my
own. Do you need any coding knowledge to make your own blog?
Any help would be greatly appreciated!
ฤกษ์แต่งงาน 2563
Hello would you mind stating which blog platform you’re using?
I’m going to start my own blog in the near future but I’m
having a difficult time selecting between BlogEngine/Wordpress/B2evolution and
Drupal. The reason I ask is because your design and style seems different then most blogs and I’m looking for something completely unique.
P.S My apologies for getting off-topic but I had to ask!
ฤกษ์แต่งงาน 2563
Sweet blog! I found it while surfing around on Yahoo News. Do you have any suggestions
on how to get listed in Yahoo News? I’ve been trying for
a while but I never seem to get there! Many thanks
ฤกษ์แต่งงาน 2563
That is a great tip especially to those new to the blogosphere.
Simple but very accurate information… Many thanks for sharing this one.
A must read post!
culinary schools in the philippines
Heya i am for the first time here. I came across this board and I find It truly useful & it helped me out a lot.
I hope to give something back and aid others like you aided me.
n95 mask
Hello There. I discovered your blog the use of msn. This is a very neatly written article.
I will make sure to bookmark it and come back to learn more of your useful information. Thanks for the post.
I will definitely return.
surgical face masks
I like what you guys are usually up too. This sort of clever work and reporting!
Keep up the fantastic works guys I’ve included you guys to
my blogroll.
agencia mkt digital
My partner and I stumbled over here coming from a different website and thought I might
check things out. I like what I see so i am just following
you. Look forward to exploring your web page for a second time.
จีคลับ
It’s going to be end of mine day, except before
ending I am reading this wonderful paragraph to improve my experience.
Best kratom for pain and anxiety
you’re in point of fact a good webmaster. The web site loading
velocity is amazing. It sort of feels that you are doing any distinctive trick.
Also, The contents are masterpiece. you have done a
excellent job on this matter!
Your trusted South London window & door company
Hi, yeah this piece of writing is truly pleasant and I have learned
lot of things from it about blogging. thanks.
area rug cleaning fayetteville nc
The very next time I read a blog, I hope that it won’t disappoint me just as much as this particular one. After all, Yes, it was my choice to read through, but I really believed you would have something useful to talk about. All I hear is a bunch of complaining about something that you can fix if you were not too busy looking for attention.
safety specs
Excellent way of describing, and good article to take
information regarding my presentation subject matter, which i am going to deliver in school.
protective workwear
Do you have a spam issue on this site; I also am a blogger, and
I was curious about your situation; we have developed some nice methods and we are
looking to exchange solutions with other folks, please
shoot me an email if interested.
ffp3 respirator
I do not even know how I ended up here, but I thought this post was good.
I don’t know who you are but definitely you’re going to a famous blogger if you aren’t already 😉 Cheers!
ffp3 respirator
I am actually thankful to the owner of this web site who has shared this
impressive article at here.
Wilmington NC Locksmith
After I originally left a comment I seem to have clicked on the -Notify me when new comments are added- checkbox and from now on every time a comment is added I get four emails with the exact same comment. There has to be a means you are able to remove me from that service? Many thanks.
ffp1
Excellent, what a web site it is! This webpage provides helpful information to us, keep it up.
indie music videos
Very nice blog post. I absolutely appreciate this site. Stick with it!
MBBS Education in Bangladesh
Hi are using WordPress for your site platform? I’m new to the blog world but I’m trying to get started and set up my own.
Do you require any html coding expertise to make your own blog?
Any help would be greatly appreciated!
music promotion
I quite like reading an article that will make people think. Also, many thanks for allowing me to comment.
music promotion
Good article. I’m going through some of these issues as well..
Heavyweight Boxing
Good post. I learn something totally new and challenging on sites I stumbleupon on a daily basis. It’s always interesting to read articles from other writers and use something from their web sites.
Marketing Digital Colombia
Nice post. I was checking continuously this weblog and I’m inspired!
Extremely helpful info specifically the ultimate part 🙂
I maintain such info a lot. I was looking for this
particular info for a very long time. Thanks and best of luck.
먹튀검증
What’s up to every single one, it’s truly a nice for me to pay a visit this site, it includes helpful Information.
male enlargement oil
I couldn’t refrain from commenting. Very well written!
african herbal oil in pakistan
Ahaa, its nice conversation about this paragraph at this place at this weblog, I have read all that, so now me also commenting here.
Diseño Gráfico Colombia
I’m not sure where you are getting your information,
but great topic. I needs to spend some time learning more or understanding more.
Thanks for wonderful info I was looking
for this info for my mission.
Web Development
I enjoy what you guys are usually up too. This kind of
clever work and exposure! Keep up the good works guys I’ve added
you guys to my own blogroll.
먹튀사이트
Its like you learn my mind! You seem to know so much
about this, like you wrote the e book in it or something.
I think that you simply could do with some percent to pressure the
message house a bit, but instead of that, that
is magnificent blog. A great read. I’ll certainly be back.
파워볼클럽
I just couldn’t leave your web site prior to suggesting
that I really enjoyed the standard information a person supply for your visitors?
Is gonna be again often to inspect new posts
Diseño Gráfico Colombia
I am not positive the place you are getting your information, however great topic.
I needs to spend a while learning much more or figuring out more.
Thanks for excellent information I used to be in search of this
info for my mission.
male enlargement oil
Touche. Sound arguments. Keep up the great work.
undetected league of legends script
I really like your blog.. very nice colors & theme.
Did you make this website yourself or did you hire someone to do it
for you? Plz respond as I’m looking to construct my own blog and would like to find out
where u got this from. kudos
road test appointment NY
Great post but I was wondering if you could write a litte more on this topic?
I’d be very grateful if you could elaborate
a little bit further. Bless you!
5 hour pre licensing course ny
Hi! I know this is somewhat off topic but I was wondering if you
knew where I could get a captcha plugin for my comment form?
I’m using the same blog platform as yours and I’m having
trouble finding one? Thanks a lot!
먹튀검증업체
I was suggested this website via my cousin. I am not positive whether or not this post is written through
him as no one else recognise such unique approximately my problem.
You are amazing! Thank you!
male enlargement oil
I have read so many content about the blogger lovers except this piece of writing is actually a nice
piece of writing, keep it up.
Driving schools near me
I’m really enjoying the theme/design of your weblog.
Do you ever run into any browser compatibility problems?
A small number of my blog visitors have complained about my blog not operating correctly in Explorer but looks great in Safari.
Do you have any recommendations to help fix this problem?
SEO services
Hi! I know this is kinda off topic but I’d figured I’d ask.
Would you be interested in trading links or maybe guest writing a blog article
or vice-versa? My site goes over a lot of the same topics as yours and I believe we could greatly benefit
from each other. If you happen to be interested feel free to send me an email.
I look forward to hearing from you! Fantastic blog by
the way!
Paid Online Advertising
Hiya! Quick question that’s entirely off topic. Do you
know how to make your site mobile friendly? My weblog looks
weird when browsing from my iphone4. I’m trying to find a template or plugin that might be able to correct this issue.
If you have any suggestions, please share. Appreciate it!
african herbal oil in pakistan
Awesome post.
does medicaid cover long term care
Good day! Do you use Twitter? I’d like to follow you if that would be ok.
I’m undoubtedly enjoying your blog and look forward to new updates.
Air Conditioning Dublin
With havin so much content and articles do
you ever run into any problems of plagorism or
copyright violation? My blog has a lot of completely unique content I’ve either created myself or outsourced but
it looks like a lot of it is popping it up all over
the internet without my permission. Do you know any techniques to
help protect against content from being ripped off? I’d definitely appreciate it.
Paid Online Advertising
My brother suggested I might like this website.
He was totally right. This post truly made my day.
You cann’t imagine simply how much time I had spent for this info!
Thanks!
road test appointment NY
I used to be able to find good info from your blog
posts.
Architect
Hi to all, the contents present at this web
page are in fact amazing for people knowledge, well, keep up the good
work fellows.
banks in west allis
Hi! Someone in my Myspace group shared this website with us so I came
to give it a look. I’m definitely loving the information.
I’m book-marking and will be tweeting this to my followers!
Terrific blog and fantastic design.
Marketing Digital Colombia
I don’t even understand how I finished up right here, however I thought this put up was great.
I don’t know who you are but definitely you are going to a famous blogger when you aren’t
already. Cheers!
5 hour driving course nyc
excellent post, very informative. I’m wondering why the
opposite experts of this sector don’t notice this.
You must continue your writing. I am confident, you’ve a great readers’ base already!
how to transfer medicaid to another state
Very soon this web page will be famous amid all blog people,
due to it’s good articles
used laptops
Keep up the superb piece of work, I read few content on this web site and I think that your web site is very interesting and has got bands of fantastic information.
APK
What i don’t understood is actually how you’re now not really much more neatly-liked than you might be right now. You’re so intelligent. You recognize therefore considerably in terms of this topic, produced me for my part believe it from a lot of varied angles. Its like women and men are not involved until it’s something to do with Lady gaga! Your personal stuffs outstanding. At all times maintain it up!
best hosting 2020
Why users still use to read news papers when in this technological globe
all is presented on net?
Air Conditioning Dublin
I really like your blog.. very nice colors & theme.
Did you make this website yourself or did you hire someone to do it for you?
Plz answer back as I’m looking to design my own blog and would
like to know where u got this from. thanks
largo cream in pakistan
My developer is trying to convince me to move to .net from PHP.
I have always disliked the idea because of the costs.
But he’s tryiong none the less. I’ve been using Movable-type on a variety of websites for about a year and am worried about switching to another
platform. I have heard very good things about blogengine.net.
Is there a way I can transfer all my wordpress content into it?
Any kind of help would be really appreciated!
Architect
What a data of un-ambiguity and preserveness
of precious experience on the topic of unexpected feelings.
Web Designing Course
I could not resist commenting. Perfectly written.
Bikes
Good web site you have got here.. It’s difficult to find high-quality writing like yours these days. I seriously appreciate people like you! Take care!!
Electric Off-road Bikes
I’m impressed, I must say. Rarely do I come across a blog that’s both equally educative and entertaining, and without a doubt, you’ve hit the nail on the head. The problem is something that too few men and women are speaking intelligently about. I’m very happy I found this during my hunt for something concerning this.
tortured for Christ
You made some really good points there. I checked on the net to learn more about the issue and found most people will go along with your views on this website.
follow this
I was just searching for this info for a while. After 6 hours of continuous Googleing, finally I got it in your web site. I wonder what’s the lack of Google strategy that don’t rank this type of informative sites in top of the list. Normally the top sites are full of garbage.
{cbd oil|cbd|cb2|cbd gummies|cbd oil near me|what is cbd|cbdistillery|best cbd oil|cbd oil for pain|cbd oil for dogs|cbd near me|doterra login|charlotte's web cbd|what is cbd oil|cbd oil benefits|cbd oil for anxiety|cbdmd|cannabidiol|cbd vape juice|cbd products|cbd for dogs|cbd vape|cbd oil side effects|benefits of cbd oil|cbd flower|cbd oil reviews|cbd benefits|full spectrum cbd oil|cbd cream|green roads cbd|koi cbd|cbt nuggets|epidiolex|cbd vape pen|cbd for anxiety|pure cbd oil|medterra|cannabinoid|cbd oil for sale|cannabis oil|is cbd oil legal|cbd isolate|buy cbd oil|cbd vape oil|dont|cbd tincture|cbd coffee|purekana|cbd oil amazon|where to buy cbd oil|cbd vs thc|cbd cigarettes|cbd store|spectrum down|charlottes web cbd|hemp oil vs cbd oil|charlotte's web cbd oil|select cbd|plus cbd oil|cannabinoids|cbd for sale|cbd capsules|cbd dosage|your cbd store|cbd store near me|cbd lotion|cbd dog treats|just cbd|cbd american shaman|compound definition|hemp oil vs cbd|diamond cbd|what does cbd stand for|cbd side effects|cbd cartridge|cbd edibles|cbd for sleep|cbd oil vape|cbd effects|effect definition|lazarus cbd|is cbd legal|cbd cream for pain|benefit definition|cbd pills|physiology definition|ignite cbd|cbd oil for cats|cbd juul pods|best cbd gummies|nuleaf cbd|wtf 101|what does cbd do|best cbd products|full spectrum cbd|cbd pen|thc vs cbd|how to take cbd oil|cbd for pain|cbd books|we don't do that here|hemp oil benefits|used to|side effects of cbd oil|benefits of cbd|cbd oil dosage|green roads cbd oil|cbd oil with thc|cbd oil drug test|how to make cbd oil|cbd oil uses|cbd oil texas|cbd gummies near me|cbd oils|cbd drug test|pure kana|cbd plus|cbd water|does cbd oil work|ahn my chart|infinite cbd|cbd tea|cbd vs hemp oil|cbd hemp flower|cbs 60 minutes|drug definition|how much cbd should i take|hempworx cbd oil|cbd kratom|how to use cbd oil|cbd oil vs hemp oil|cbd stocks|cbd salve|cbd stores near me|cbd vape cartridge|cbd dosage for anxiety mg|young living cbd oil|what is cbd oil good for|cbdmedic|cbd for cats|how to
This web site definitely has all of the info I needed about this subject and didn’t know who to ask.
{cbd oil|cbd|cb2|cbd gummies|cbd oil near me|what is cbd|cbdistillery|best cbd oil|cbd oil for pain|cbd oil for dogs|cbd near me|doterra login|charlotte's web cbd|what is cbd oil|cbd oil benefits|cbd oil for anxiety|cbdmd|cannabidiol|cbd vape juice|cbd products|cbd for dogs|cbd vape|cbd oil side effects|benefits of cbd oil|cbd flower|cbd oil reviews|cbd benefits|full spectrum cbd oil|cbd cream|green roads cbd|koi cbd|cbt nuggets|epidiolex|cbd vape pen|cbd for anxiety|pure cbd oil|medterra|cannabinoid|cbd oil for sale|cannabis oil|is cbd oil legal|cbd isolate|buy cbd oil|cbd vape oil|dont|cbd tincture|cbd coffee|purekana|cbd oil amazon|where to buy cbd oil|cbd vs thc|cbd cigarettes|cbd store|spectrum down|charlottes web cbd|hemp oil vs cbd oil|charlotte's web cbd oil|select cbd|plus cbd oil|cannabinoids|cbd for sale|cbd capsules|cbd dosage|your cbd store|cbd store near me|cbd lotion|cbd dog treats|just cbd|cbd american shaman|compound definition|hemp oil vs cbd|diamond cbd|what does cbd stand for|cbd side effects|cbd cartridge|cbd edibles|cbd for sleep|cbd oil vape|cbd effects|effect definition|lazarus cbd|is cbd legal|cbd cream for pain|benefit definition|cbd pills|physiology definition|ignite cbd|cbd oil for cats|cbd juul pods|best cbd gummies|nuleaf cbd|wtf 101|what does cbd do|best cbd products|full spectrum cbd|cbd pen|thc vs cbd|how to take cbd oil|cbd for pain|cbd books|we don't do that here|hemp oil benefits|used to|side effects of cbd oil|benefits of cbd|cbd oil dosage|green roads cbd oil|cbd oil with thc|cbd oil drug test|how to make cbd oil|cbd oil uses|cbd oil texas|cbd gummies near me|cbd oils|cbd drug test|pure kana|cbd plus|cbd water|does cbd oil work|ahn my chart|infinite cbd|cbd tea|cbd vs hemp oil|cbd hemp flower|cbs 60 minutes|drug definition|how much cbd should i take|hempworx cbd oil|cbd kratom|how to use cbd oil|cbd oil vs hemp oil|cbd stocks|cbd salve|cbd stores near me|cbd vape cartridge|cbd dosage for anxiety mg|young living cbd oil|what is cbd oil good for|cbdmedic|cbd for cats|how to
A fascinating discussion is definitely worth comment. I do think that you should write more about this subject, it might not be a taboo subject but usually people don’t talk about these topics. To the next! Cheers!
cbd and cancer
I’m excited to find this web site. I need to to thank you for ones time for this particularly wonderful read!! I definitely savored every bit of it and I have you bookmarked to check out new stuff in your blog.
cbd clinic level 5
I love it when people come together and share thoughts. Great blog, stick with it!
Free Robux Generator
I think this is among the most important info for me. And i’m glad
reading your article. But wanna remark on few general things, The
website style is ideal, the articles is really excellent :
D. Good job, cheers
telefonu priedai
Please let me know if you’re looking for a article writer for your weblog.
You have some really great posts and I feel I
would be a good asset. If you ever want to take some of the load off, I’d love to write some material
for your blog in exchange for a link back to mine.
Please send me an e-mail if interested. Thank you!
is cbd legal federally
It’s hard to find educated people for this subject, however, you sound like you know what you’re talking about! Thanks
Wedding planners company in marrakech
Peculiar article, just what I needed.
feals cbd
Your style is unique compared to other people I’ve read stuff from. Thank you for posting when you have the opportunity, Guess I will just bookmark this site.
cbd for acne
I must thank you for the efforts you have put in writing this site. I’m hoping to check out the same high-grade blog posts by you later on as well. In truth, your creative writing abilities has encouraged me to get my own, personal website now 😉
Ajmera Florenza
I would like to thank you for the efforts you’ve put
in writing this website. I really hope to see the same high-grade content by you later on as well.
In fact, your creative writing abilities has encouraged me to get my own, personal blog now 😉
w88
Remarkable things here. I am very satisfied to see your post.
Thanks so much and I am looking ahead to contact you. Will you kindly
drop me a e-mail?
Stud walls Perth
I am curious to find out what blog platform you’re working with?
I’m experiencing some small security issues with my latest website and I’d like to find something more safeguarded.
Do you have any recommendations?
w88
Oh my goodness! Impressive article dude! Thanks, However
I am experiencing problems with your RSS. I don’t understand why I cannot subscribe to it.
Is there anybody else having the same RSS problems?
Anybody who knows the solution will you kindly respond?
Thanks!!
Virginia office furniture removal
Hello there, I found your web site via Google at the same time as looking for a similar subject, your web site got here up, it looks great. I have bookmarked it in my google bookmarks.
Maryland office furniture removal
Nice read, I just passed this onto a friend who was doing a little research on that. And he actually bought me lunch as I found it for him smile So let me rephrase that: Thanks for lunch!
File ontwijken
Hello, i feel that i saw you visited my weblog thus i got here to
return the favor?.I’m attempting to to find things to improve my site!I suppose its ok to
make use of a few of your ideas!!
Event management company in morocco
What’s up, I would like to subscribe for this webpage to
take latest updates, therefore where can i do it please assist.
turkish kilim pillows
Excellent beat ! I would like to apprentice while you amend your site,
how can i subscribe for a blog website? The account helped me a acceptable deal.
I had been tiny bit acquainted of this your broadcast offered bright clear concept
apartment movers
Hello! I could have sworn I’ve been to this website before but after reading through some of the post I realized it’s new to me.
Anyways, I’m definitely happy I found it and I’ll be book-marking and
checking back frequently!
w88
Tremendous issues here. I am very satisfied to peer your article.
Thank you a lot and I’m taking a look ahead to touch you.
Will you kindly drop me a e-mail?
local movers
I blog often and I really thank you for your content.
The article has truly peaked my interest.
I’m going to bookmark your site and keep checking for new information about once a week.
I opted in for your Feed too.
Movers
Hello! I know this is sort of off-topic but I needed to ask.
Does running a well-established website like yours take a lot of
work? I am brand new to running a blog however I do write
in my journal daily. I’d like to start a blog so I can easily share my own experience and thoughts online.
Please let me know if you have any kind of ideas or tips for new aspiring
bloggers. Appreciate it!
kilim pillows
Hello there! I could have sworn I’ve been to this blog before but
after going through many of the posts I realized it’s
new to me. Nonetheless, I’m certainly happy I found it and I’ll be book-marking it and checking back frequently!
kilim cushions
This web site certainly has all of the info I needed concerning this subject and didn’t know who to ask.
sucks
Everything is very open with a very clear clarification of the challenges. It was definitely informative. Your website is very helpful. Thanks for sharing.
ads classifieds
Good post. I will be going through some of these issues as well..
comb binding London
Good post. I learn something totally new and challenging on sites I stumbleupon on a daily basis. It will always be helpful to read through content from other authors and practice something from other websites.
http://green-barley-plus-review.eu/
Maintain the exceptional work !! Lovin’ it! http://green-barley-plus-review.eu/
batidos para adelgazar marcas
Greetings, great web site you possess going here. http://mejor-suplemento-muscular2018.ovh/
pillola per acne dopo quanto fa effetto
Thanks meant for offering this kind of amazing post. http://curaperacneibrufoli.info/
meilleur creatine pour prise de masse
Sustain the spectacular job !! Lovin’ it! http://prise-de-masse-musculaire-rapide2018.ovh/
HMHB
I could not resist commenting. Perfectly written.
buy CBD oil near me
This website really has all of the information and facts I wanted about this subject and didn’t know who to ask.
elan townhouses
This is the perfect site for anyone who wants to find out about this topic. You understand a whole lot its almost tough to argue with you (not that I really would want to…HaHa). You certainly put a fresh spin on a topic that has been written about for a long time. Excellent stuff, just great.
integratori per massa muscolare
Great internet site! It looks really good! Sustain the helpful job! http://aumentaremassa2018.ovh/
junk removal san diego
Its like you read my mind! You seem to know a lot about this, like you wrote
the book in it or something. I think that you can do with some pics to drive the message home
a bit, but instead of that, this is magnificent blog.
A great read. I will certainly be back.
แต่งงาน
It’s really a nice and useful piece of information. I’m satisfied that you shared this helpful info with us.
Please stay us up to date like this. Thanks for sharing.
cleaning service company san diego
Fantastic goods from you, man. I’ve understand your stuff previous to
and you’re just too excellent. I actually like what you have acquired here, really like what you are saying and the way in which you say it.
You make it entertaining and you still care for to keep it
wise. I cant wait to read far more from you. This is really a tremendous site.
Godrej Royale Woods
Good day! Do you know if they make any plugins to protect against hackers?
I’m kinda paranoid about losing everything I’ve worked hard on. Any tips?
film izle
Film meraklısı olarak her gün vizyona giren filmleri sizin için takip ediyor ve
ücretsiz bir şekilde sizlere sunuyoruz. 2020 yılına
damga vuran filmci dayı olarak sunuyoruz.
Web sitemize bakacak olursanız eğer en yeni filmleri ve dizileri ilk bizim paylaştığımızı görüceksiniz.
Evde, işyerinde, okulda, bahçede, sokakta her yerde full film izle seçeneği ile donmadan ve HD bir şekilde rahatça film izleyebilirsiniz.
En çok şikayet alan konu genelde film izlerken donma problemi
olduğu herkes tarafınca kabul edilir. Biz filmci dayı olarak size donmadan rahatça kesintisiz film izleme keyfini sunuyoruz.
Hergün yeni bir film, her gün çeşit çeşit dizi
ve içerikler ile zengin menüsü sayesinde sizin isteğiniz tarzda filmleri izlemek ve seçmek çok kolay.
Sitemizin en büyük özelliği aradığınızı en kolay şekilde bulmanızdır.
Bütün kategoriler özenle hazırlanır ve
düzenlenir, IMDB Puan ve film konusu özenle seçilir doğru
kategoride yer alır ve bu sayede full film izleyebilirsiniz.
ßizleri sosyal medya hesaplarımızdan takip
etmeyi ihmal etmeyi unutmayın…
İYİ SEHİRLER HERKESE.
film izle
film izle film izle film izle film izle film izle
film izle film izle film izle film izle film izle film izle
film izle film izle film izle film izle film izle film izle film izle film izle film izle film izle film izle
muscat bay
Next time I read a blog, Hopefully it doesn’t fail me as much as this particular one. After all, Yes, it was my choice to read, however I really believed you would have something useful to say. All I hear is a bunch of moaning about something that you could possibly fix if you were not too busy looking for attention.
townhouses in dubai
Good blog post. I definitely appreciate this website. Continue the good work!
cv's
Great awesome things here. I am very glad to peer your post. Thank you so much and i’m having a look forward to touch you. Will you kindly drop me a mail?
software deal
I do agree with all the ideas you’ve presented in your post. They are really convincing and will definitely work. Still, the posts are too short for beginners. Could you please extend them a little from next time? Thanks for the post.
Xiaomi Mi 10 5G 128GB Price In USD
It’s in point of fact a great and helpful piece of info. I am happy that you simply shared this useful info with us. Please keep us up to date like this. Thank you for sharing.
getdataback Download
You ought to take part in a contest for one of the most useful blogs on the web. I’m going to recommend this website!
norgesautomaten
on line gambling
roulette
best australian online casino sites
Hardware Virtualization
Hi, I do think this is a great blog. I stumbledupon it 😉 I may come back yet again since i have bookmarked it. Money and freedom is the greatest way to change, may you be rich and continue to help other people.
cyber security protection
I love reading through a post that can make people think. Also, thank you for allowing me to comment.
independent escort girls lucknow
I wanted to thank you for this very good read!! I certainly enjoyed every bit of it. I have you book-marked to check out new stuff you post…
dating girls lucknow
Hi! I could have sworn I’ve visited this web site before but after looking at some of the articles I realized it’s new to me. Anyhow, I’m certainly delighted I came across it and I’ll be book-marking it and checking back regularly!
anti aging eye cream natural
I always spent my half an hour to read this webpage’s posts all the time along with a cup of coffee.
Hedge Trimming Huddersfield
Thanks designed for sharing such a pleasant thinking, post is
fastidious, thats why i have read it entirely
Déodorant naturel
I will immediately snatch your rss as I can not find your email subscription link or e-newsletter service.
Do you’ve any? Kindly let me recognise so that I may just subscribe.
Thanks.
ok boomer
Hi there! I just wanted to ask if you ever have any trouble with
hackers? My last blog (wordpress) was hacked and I ended up losing many months of hard work due to no data backup.
Do you have any solutions to protect against hackers?
website design diamond creek
Hi! I know this is kinda off topic but I’d figured I’d ask.
Would you be interested in trading links or maybe guest writing a
blog post or vice-versa? My site addresses a lot of the same subjects as yours and I believe we could greatly benefit
from each other. If you’re interested feel free to shoot
me an email. I look forward to hearing from you!
Superb blog by the way!
Dentifrice naturel
Hello! This post couldn’t be written any better! Reading
this post reminds me of my old room mate! He always kept
talking about this. I will forward this page to
him. Pretty sure he will have a good read. Thanks
for sharing!
Good morning wallpapers
You made some decent points there. I seemed on the internet for the difficulty and located most people will associate with along with your website.
Best CBD Oil Companies
If you want to get a good deal from this article then you have to
apply these methods to your won website.
Prints on Dibond
I haven’t checked in here for a while because I thought it was getting boring, but the last few posts are great quality so I guess I’ll add you back to my daily bloglist. You deserve it my friend 🙂
dactrisuimaoga.com
Would you be occupied with exchanging links?
buy kratom powder
I couldn’t resist commenting. Well written!
CBD Oil Companies
Hello would you mind stating which blog platform you’re working with?
I’m going to start my own blog soon but I’m having a
tough time choosing between BlogEngine/Wordpress/B2evolution and Drupal.
The reason I ask is because your design and style seems different then most blogs and I’m
looking for something unique. P.S Sorry for getting off-topic but I had to ask!
hydrocycle
Hello there I am so thrilled I found your web site,
I really found you by error, while I was searching on Digg for something
else, Anyways I am here now and would just like
to say many thanks for a tremendous post and a all round thrilling blog (I also love the
theme/design), I don’t have time to look over it all
at the moment but I have book-marked it and also included your RSS feeds,
so when I have time I will be back to read a great deal more, Please do keep up
the great job.
CBD Oil Companies
Hmm is anyone else encountering problems with the pictures on this
blog loading? I’m trying to find out if its a problem on my end or if it’s the blog.
Any feed-back would be greatly appreciated.
Best CBD Oil Companies
Undeniably consider that that you stated. Your favourite reason seemed to be at the net the simplest factor to take into accout of.
I say to you, I definitely get annoyed whilst folks think about worries that they just do not recognise about.
You managed to hit the nail upon the highest and defined out the entire thing without having side effect , folks could take a signal.
Will probably be again to get more. Thank you
CBD Oil Companies
It’s not my first time to pay a quick visit this web page, i
am visiting this site dailly and obtain good information from here all the time.
explore businesses through videos and podcasts
Normally I do not read article on blogs, but I wish to say that this write-up very
forced me to check out and do so! Your writing taste has
been amazed me. Thanks, very nice post.
Best Mens Eye Cream
I visit each day a few websites and information sites to read articles, except this web site
gives quality based posts.
pesistica
Very good article! We are linking to this great post on our website.
Keep up the good writing.
Buy CBD Oil
I know this web site offers quality dependent posts and other information, is there any other site which
offers these kinds of stuff in quality?
men's skin care amazon
Unquestionably believe that which you stated.
Your favorite reason appeared to be on the web the simplest thing to be aware of.
I say to you, I certainly get irked while people think about worries that they plainly don’t know about.
You managed to hit the nail upon the top and also defined
out the whole thing without having side effect , people
could take a signal. Will probably be back to get more.
Thanks
Best CBD Oil Companies
It’s wonderful that you are getting ideas from this paragraph as well as from our dialogue made here.
Best CBD Oil
This page truly has all of the info I needed concerning
this subject and didn’t know who to ask.
Déodorant naturel
Wonderful, what a web site it is! This web site gives helpful data to us, keep it up.
Best CBD Oil Companies
Hello, of course this paragraph is really fastidious and
I have learned lot of things from it regarding blogging.
thanks.
CBD Oil Companies
Hi there just wanted to give you a quick heads up. The text in your article seem to be running off the screen in Chrome.
I’m not sure if this is a format issue or something to do with web browser compatibility but
I figured I’d post to let you know. The layout look great though!
Hope you get the issue resolved soon. Thanks
sem hamilton
Hi, Neat post. There is an issue along with your web site in web explorer, could test this?
IE nonetheless is the market leader and a large portion of other
people will miss your wonderful writing due to this problem.
leathertoolkits blog
Thanks for the auspicious writeup. It in truth was
once a amusement account it. Look complex to
more added agreeable from you! By the way, how can we be in contact?
kratom extract
Thanks for sharing your thoughts about website.
Regards
Best CBD Oil Companies
This site was… how do you say it? Relevant!! Finally I’ve found something which helped me.
Thanks!
acquagym
Hi there friends, how is the whole thing, and what you want to say about this
article, in my view its actually amazing designed for me.
intolleranza
I used to be able to find good advice from your content.
perfect binding london
This is a topic that’s close to my heart… Thank you! Exactly where can I find the contact details for questions?
business cards London
I really like it when individuals come together and share views. Great site, stick with it.
adcada
I¡¦ve read some good stuff here. Definitely price bookmarking for revisiting. I wonder how much attempt you place to create any such great informative website.
Paid Online Advertising
Valuable info. Lucky me I found your website by chance,
and I am surprised why this accident didn’t happened in advance!
I bookmarked it.
카지노사이트
Do you mind if I quote a couple of your posts as long
as I provide credit and sources back to your webpage? My blog
site is in the exact same niche as yours and my visitors would really benefit from some of the information you present here.
Please let me know if this ok with you. Appreciate it!
안전놀이터
Greetings I am so grateful I found your blog page, I really found you by
error, while I was searching on Yahoo for something else, Anyhow I am here now and would just like to
say thank you for a remarkable post and a all round thrilling blog (I also love the
theme/design), I don’t have time to look
over it all at the minute but I have saved it and also added your RSS feeds, so when I have time I will be back to read much more,
Please do keep up the awesome jo.
온라인바카라
It’s a shame you don’t have a donate button! I’d most certainly donate to this superb blog!
I guess for now i’ll settle for bookmarking and adding your RSS feed to my Google account.
I look forward to new updates and will talk about this website with my Facebook group.
Chat soon!
카지노사이트
Attractive section of content. I just stumbled upon your site and in accession capital to assert that I get actually enjoyed
account your blog posts. Anyway I will be subscribing to your augment and even I achievement you access consistently
quickly.
Marketing Agency in Massachusetts
Pretty! This was a really wonderful post.
Thank you for supplying this info.
Social Media Marketing
Incredible story there. What occurred after?
Take care!
토토사이트
I have to thank you for the efforts you have put in writing this blog.
I am hoping to check out the same high-grade blog posts by you in the future as well.
In truth, your creative writing abilities has encouraged me
to get my own, personal blog now 😉
Social Media Marketing
We are a bunch of volunteers and starting a new scheme in our
community. Your website offered us with useful info to work on. You’ve performed a formidable process and our entire group might
be thankful to you.
918kiss download
Right now it looks like WordPress is the preferred blogging platform out there right now.
(from what I’ve read) Is that what you’re using on your
blog?
SEO services
Very good article! We are linking to this particularly great article
on our site. Keep up the good writing.
Marketing Agency in Massachusetts
I every time emailed this web site post page to all my
contacts, since if like to read it afterward my contacts will too.
Digital Marketing Agency
Wow, marvelous blog layout! How long have you been blogging for?
you made blogging look easy. The overall look of your site
is magnificent, let alone the content!
카지노사이트
Hello, I enjoy reading all of your article post. I wanted to write a little comment to
support you.
안전놀이터
My brother recommended I might like this blog.
He was totally right. This post truly made my day.
You cann’t imagine simply how much time I had spent for this information! Thanks!
사설토토사이트
Hi, I do think this is a great website. I stumbledupon it 😉 I
may revisit once again since i have bookmarked it.
Money and freedom is the best way to change, may you be rich and continue to
help others.
사설토토사이트
I have learn several excellent stuff here. Certainly price bookmarking for revisiting.
I surprise how so much effort you set to create this sort of excellent informative website.
Bin Hire
Hi to all, since I am genuinely eager of reading this blog’s post to be
updated daily. It carries fastidious information.
circle neckalce
Hi to every one, the contents present at this site are in fact remarkable for people knowledge, well, keep up the good work
fellows.
Gypsum Concrete contractors
hi!,I like your writing so much! percentage we be in contact more about your
article on AOL? I need a specialist in this house to solve my
problem. Maybe that is you! Taking a look forward to look you.
안전놀이터
Hi, i read your blog occasionally and i own a similar one and i was just wondering if you get a lot of
spam responses? If so how do you prevent
it, any plugin or anything you can recommend? I get so much lately it’s driving me mad
so any assistance is very much appreciated.
dangle hoop earrings
This page definitely has all the info I needed about this subject and didn’t know who to ask.
Marketing Agency in Massachusetts
Hi there just wanted to give you a brief heads up and let you
know a few of the pictures aren’t loading properly.
I’m not sure why but I think its a linking
issue. I’ve tried it in two different internet browsers and both
show the same outcome.
silver climber earrings uk
Great article! We will be linking to this great post on our site.
Keep up the good writing.
토토사이트
If you want to grow your knowledge just keep visiting this site and
be updated with the most recent news posted here.
Paid Online Advertising
Attractive portion of content. I just stumbled upon your web site and in accession capital to assert that I acquire
actually loved account your blog posts. Anyway I will be subscribing on your augment or even I achievement you get entry to
persistently fast.
온라인바카라
Pretty! This was an incredibly wonderful post.
Many thanks for supplying this info.
온라인바카라
I’ve been browsing on-line greater than 3 hours these days, but I
by no means found any interesting article like yours.
It is pretty worth enough for me. In my opinion, if all website owners and bloggers made just right content material as you did, the
net shall be much more helpful than ever before.
온라인바카라
Great post. I was checking constantly this blog and I’m impressed!
Very useful info specifically the last part :
) I care for such info a lot. I was seeking this particular information for a long time.
Thank you and best of luck.
Bin Hire
I could not refrain from commenting. Very well written!
온라인바카라
My brother suggested I may like this web site. He used to be entirely right.
This publish actually made my day. You can not believe simply how
much time I had spent for this info! Thank you!
dangle hoop earrings
Howdy, i read your blog occasionally and i own a similar one and i was just curious if you get a
lot of spam feedback? If so how do you stop it, any plugin or anything you can recommend?
I get so much lately it’s driving me insane so any
help is very much appreciated.
Gypsum contractors
I am sure this paragraph has touched all the internet viewers, its really really good post on building up new web
site.
918kiss download
When I initially commented I clicked the “Notify me when new comments are added” checkbox
and now each time a comment is added I get three e-mails with
the same comment. Is there any way you can remove me from that service?
Thank you!
918kiss
Hey there! This is my first visit to your blog! We are a collection of
volunteers and starting a new project in a community in the same niche.
Your blog provided us beneficial information to work on. You have done a outstanding job!
circle bracelet
I’d like to thank you for the efforts you’ve put
in writing this website. I’m hoping to see the same high-grade content
from you in the future as well. In truth, your creative writing abilities has inspired me to get my own, personal site now
😉
how to insert ben wa balls
We are a group of volunteers and starting a new initiative in our community. Your blog provided us with valuable information to work on|.You have done a marvellous job!
Buy Clenbuterol
I conceive this site contains some really good information for everyone : D.
Messi Music
I am usually to blogging and i actually respect your content. The article has actually peaks my interest. I’m going to bookmark your website and hold checking for new information.
จีคลับ
When someone writes an paragraph he/she retains the idea of a user in his/her mind that how a user can know it.
Therefore that’s why this piece of writing is great. Thanks!
distributed team templates
Very good info. Lucky me I came across your website by accident (stumbleupon).
I’ve saved it for later!
CBD Oil
What i do not realize is in truth how you are not actually much more smartly-preferred
than you might be now. You’re very intelligent.
You understand therefore significantly in relation to this
subject, produced me individually consider it from a lot of various angles.
Its like men and women aren’t fascinated unless it’s something to
do with Girl gaga! Your own stuffs nice. At all times maintain it up!
skip hire near me
Hey! This is kind of off topic but I need some guidance from an established blog.
Is it tough to set up your own blog? I’m not very techincal but I can figure things
out pretty fast. I’m thinking about setting up my own but I’m not sure where to begin. Do you have any ideas or suggestions?
Cheers
inspiring
Howdy would you mind stating which blog platform you’re using? I’m going to start my own blog in the near future but I’m having a difficult time selecting between BlogEngine/Wordpress/B2evolution and Drupal. The reason I ask is because your design seems different then most blogs and I’m looking for something completely unique. P.S Apologies for being off-topic but I had to ask!
LUCKYNIKI
Hi there i am kavin, its my first occasion to commenting anyplace, when i read this paragraph i thought i could also make comment due to
this brilliant post.
cheap skip hire
Your method of explaining everything in this article
is truly pleasant, every one be capable of effortlessly understand it, Thanks a lot.
オンラインカジノ
Wow that was odd. I just wrote an extremely long comment but after I clicked submit my comment didn’t show up.
Grrrr… well I’m not writing all that over again. Anyway, just
wanted to say great blog!
aquaponics dashboard
I couldn’t refrain from commenting. Exceptionally well written!
Salvatore Olvedo
Thank you for any other informative site. Where else could I get that type of information written in such an ideal approach? I’ve a challenge that I am just now running on, and I have been at the glance out for such info.
team productivity templates
Good way of explaining, and nice post to get facts about my presentation subject matter, which
i am going to deliver in college.
Jordan Stevano
You have brought up a very excellent points , regards for the post.
Best CBD Oil Companies
It is the best time to make some plans for the future and it is time to be happy.
I have read this post and if I could I wish to suggest you some interesting things or advice.
Maybe you could write next articles referring to this article.
I desire to read even more things about it!
free fortnite skin
I know this web page gives quality based articles or reviews and extra material, is there any other web page which gives such stuff in quality?
Industrial Protective Paints
Excellent blog you’ve got here.. It’s difficult to find quality writing like yours these
days. I truly appreciate people like you! Take care!!
cheap skip hire
I like the helpful info you provide in your articles. I will bookmark your weblog and check again here frequently.
I am quite certain I’ll learn plenty of new stuff right here!
Good luck for the next!
Skip hire prices
It is appropriate time to make some plans for the future and it is time to be happy.
I have read this post and if I could I desire to recommend you some interesting issues or advice.
Maybe you can write next articles relating to this article.
I desire to learn more things about it!
Punto de venta para restaurantes
My relatives all the time say that I am killing my time here at net, however I know I am getting familiarity everyday by
reading such good articles.
Royal Online V2
Superb, what a website it is! This blog provides helpful facts
to us, keep it up.
จีคลับ
Thank you, I have recently been looking for info approximately this
topic for a while and yours is the best I’ve found out so far.
However, what concerning the bottom line? Are you sure concerning the supply?
w88
Thank you for any other informative website. Where else could
I am getting that kind of info written in such an ideal approach?
I’ve a challenge that I’m simply now working on, and
I have been on the glance out for such information.
team workflow templates
I know this site provides quality depending articles or reviews
and additional stuff, is there any other web site which provides these kinds
of data in quality?
how to get phone number details
With havin so much content do you ever run into any problems of plagorism or copyright violation? My website has a lot of completely unique content I’ve either written myself or
outsourced but it looks like a lot of it is popping
it up all over the web without my agreement. Do you know any techniques
to help protect against content from being stolen? I’d certainly appreciate it.
CBD Oil Companies
Thanks for finally talking about >Enrollment, Tuition, and Discount Rate: The Sweet Briar Story, Part 3 – Unsolicited Guru <Loved it!
Punto de venta para restaurantes
Thank you for the good writeup. It in fact was
a amusement account it. Look advanced to more added agreeable
from you! By the way, how can we communicate?
whose number is this calling me
I know this if off topic but I’m looking into starting my own weblog and was curious what all is
needed to get set up? I’m assuming having a blog like yours would cost a pretty penny?
I’m not very internet savvy so I’m not 100% positive.
Any suggestions or advice would be greatly appreciated.
Thanks
How to become a leader
Superb blog! Do you have any suggestions for aspiring writers?
I’m planning to start my own blog soon but I’m a little lost on everything.
Would you advise starting with a free platform like
Wordpress or go for a paid option? There are so many
choices out there that I’m totally overwhelmed .. Any tips?
Bless you!
Auto Insurance
What i don’t realize is in fact how you’re not actually much more smartly-preferred than you
might be now. You are very intelligent. You already know thus significantly in the case of this subject, made me in my opinion believe it from so
many numerous angles. Its like women and men are not fascinated until it is something to
accomplish with Girl gaga! Your own stuffs nice.
At all times take care of it up!
w88club
I know this website offers quality dependent articles or reviews and other data, is there any other website
which presents such data in quality?
whose number is this calling me
Awesome! Its truly awesome piece of writing, I have got much clear idea on the topic of from this
paragraph.
Life Insurance
Great article. I’m experiencing a few of these issues as well..
How to get salary raise
For the reason that the admin of this web site is working, no question very quickly it will be well-known, due
to its quality contents.
Unlimited music downloads
Wow, superb blog layout! How long have you been blogging for? you made blogging glance easy. The whole look of your website is fantastic, as well as the content material!
google admob kya hai
Very well written post. It will be valuable to anyone who employess it, as well as myself. Keep doing what you are doing – can’r wait to read more posts.
Fast cash
Awsome article and straight to the point. I am not sure if this is actually the best place to ask but do you people have any thoughts on where to employ some professional writers? Thanks 🙂
mrublackboard
I’m not that much of a internet reader to be honest but your blogs really nice, keep it up! I’ll go ahead and bookmark your website to come back in the future. Cheers
whose number is this calling me
Great article! We are linking to this great content on our
site. Keep up the good writing.
จีคลับ
Fabulous, what a web site it is! This blog presents valuable data to us,
keep it up.
Best CBD Oil Companies
Definitely imagine that that you said. Your favourite justification seemed to be on the internet the easiest
factor to remember of. I say to you, I definitely get annoyed whilst
other folks consider concerns that they plainly do not
understand about. You managed to hit the nail upon the
top and defined out the whole thing with no need side effect ,
other folks could take a signal. Will probably be again to get more.
Thank you
Buy CBD Oil
I’m impressed, I have to admit. Seldom do I encounter a blog that’s both equally educative and amusing, and without a doubt, you’ve hit the nail on the head.
The problem is something which not enough men and women are speaking intelligently about.
I am very happy that I stumbled across this during my search for something concerning this.
Belen Hierholzer
Having read this I believed it was rather informative. I appreciate you spending some time and energy to put this information together. I once again find myself personally spending a significant amount of time both reading and commenting. But so what, it was still worth it.
Brittney Foder
I blog quite often and I truly thank you for your information. The article has truly peaked my interest. I will bookmark your website and keep checking for new information about once per week. I subscribed to your Feed too.
styluxitalian
I like reading a post that can make people think. Also, thank you for allowing me to comment.
Ebony Fuller Shopp
You should take part in a contest for one of the finest websites online. I am going to recommend this website!
Web Development
It’s remarkable for me to have a website, which is valuable
in support of my knowledge. thanks admin
Paid Online Advertising
Fine way of describing, and fastidious piece of writing to take data on the topic of my
presentation topic, which i am going to convey in university.
Marketing Agency in Massachusetts
It’s hard to come by knowledgeable people on this subject, but
you sound like you know what you’re talking about! Thanks
SEO services
I am genuinely delighted to read this webpage posts which contains plenty of valuable information,
thanks for providing these kinds of statistics.
Social Robot
It is perfect time to make some plans for the future and it’s time to be happy. I’ve read this post and if I could I desire to suggest you some interesting things or advice. Maybe you could write next articles referring to this article. I want to read even more things about it!
froleprotrem
An impressive share, I just given this onto a colleague who was doing a little analysis on this. And he in fact bought me breakfast because I found it for him.. smile. So let me reword that: Thnx for the treat! But yeah Thnkx for spending the time to discuss this, I feel strongly about it and love reading more on this topic. If possible, as you become expertise, would you mind updating your blog with more details? It is highly helpful for me. Big thumb up for this blog post!
Social Media Marketing
I used to be recommended this website by way of my cousin. I’m no longer sure whether or not this publish is written by
him as nobody else recognise such distinctive about my difficulty.
You are incredible! Thank you!
Social Media Management
Can you tell us more about this? I’d like to find out more details.
Marketing Agency in Massachusetts
I know this site presents quality dependent articles or reviews and other material, is there any other website which
gives these information in quality?
Paid Online Advertising
Howdy! I know this is kind of off topic but I was wondering which blog platform are you using for this site?
I’m getting sick and tired of WordPress because I’ve had problems with
hackers and I’m looking at options for another platform.
I would be awesome if you could point me in the
direction of a good platform.
orange bank
Hey there! I simply wish to give you a big thumbs up for your excellent information you have right here on this post. I will be coming back to your blog for more soon.
3090 Lexington Road Nicholasville KY 40356
Hiya! I know this is kinda off topic however I’d figured I’d
ask. Would you be interested in exchanging links or maybe guest authoring a blog
post or vice-versa? My blog goes over a lot of the same subjects as yours and I feel
we could greatly benefit from each other. If you happen to be interested feel free to shoot me an e-mail.
I look forward to hearing from you! Superb blog by the way!
3090 Lexington Road Nicholasville KY 40356
Wow, wonderful weblog layout! How lengthy have you been blogging for?
you made blogging look easy. The whole glance of your
web site is magnificent, let alone the content material!
Skull Rings
I’m gone to tell my little brother, that he should also go to see this blog on regular basis
to get updated from most recent news update.
Valhalla Darkweb Market
What’s up to all, how is everything, I think every one is getting more
from this site, and your views are good in favor of new visitors.
How to contact best buy geek squad
Howdy very nice blog!! Guy .. Beautiful .. Wonderful .. I will bookmark your web site and take the feeds also…I am happy to search out numerous useful info right here in the submit, we want develop extra strategies on this regard, thanks for sharing. . . . . .
스포츠사이트
I appreciate, result in I found just what I used to be taking a look for.
You’ve ended my four day long hunt! God Bless you man. Have a great day.
Bye
magnet:?xt=urn:btih:
This paragraph will assist the internet viewers for setting
up new website or even a weblog from start to end.
CBD Oil Companies
I read this article fully about the comparison of hottest and
earlier technologies, it’s amazing article.
Best CBD Oil
I used to be able to find good info from your blog articles.
Is CBD Oil Legal in the UK
My partner and I absolutely love your blog and find almost
all of your post’s to be exactly I’m looking for. Would you offer guest writers to write content to suit
your needs? I wouldn’t mind composing a post or elaborating on most of the subjects you write about here.
Again, awesome web log!
CBD Oil Companies
I go to see everyday a few blogs and information sites to read posts,
however this webpage provides quality based content.
WoodHaus Maimi
Right here is the right web site for anybody who really wants to understand this topic. You realize a whole lot its almost tough to argue with you (not that I actually would want to…HaHa). You certainly put a fresh spin on a topic that’s been written about for decades. Wonderful stuff, just excellent.
CBD Oil
Howdy would you mind letting me know which web host you’re using?
I’ve loaded your blog in 3 different browsers and I must say this
blog loads a lot quicker then most. Can you suggest a good web hosting provider at a fair price?
Thanks, I appreciate it!
WoodHaus Maimi Remodel
Spot on with this write-up, I truly think this site needs a great deal more attention. I’ll probably be back again to read more, thanks for the information.
weekend matches
Your style is so unique compared to other folks I have read stuff from.
Thank you for posting when you have the opportunity, Guess I will
just bookmark this blog.
http://unidadyservicio.com/2020/03/04/errors-when-choosing-crane-hire-service-providers/
I am curious to find out what blog system you’re working with?
I’m having some minor security issues with my latest website
and I would like to find something more risk-free.
Do you have any solutions?
Buy Insulation online
At this time I am going away to do my breakfast, once having my breakfast coming over again to read further news.
backlink
It’s the best time to make a few plans for the longer term and it
is time to be happy. I have learn this submit and if I may I desire to counsel you some interesting things or tips.
Perhaps you can write next articles relating to this article.
I wish to read more things about it!
Football predictions and tips
Excellent site you have here.. It’s hard to find good quality writing like yours these days.
I truly appreciate people like you! Take care!!
geek squad chat support
you’ve gotten a terrific blog here! would you like to make some invite posts on my blog?
top class massage
Your style is so unique compared to other folks I have read stuff from. Thanks for posting when you have the opportunity, Guess I’ll just bookmark this web site.
w88
Simply wish to say your article is as amazing.
The clearness in your post is simply great and i could assume you are an expert on this subject.
Fine with your permission let me to grab your RSS feed to keep updated with
forthcoming post. Thanks a million and please carry
on the rewarding work.
massage therapy organizations
It’s nearly impossible to find well-informed people about this topic, but you sound like you know what you’re talking about! Thanks
w88
I’ve been surfing online more than 3 hours today, yet I
never found any interesting article like yours. It’s pretty
worth enough for me. In my opinion, if all website owners and bloggers made good content as you did, the net will be much more useful than ever before.
w88
This is my first time pay a quick visit at here and i
am in fact pleassant to read everthing at alone place.
w88
I really love your blog.. Pleasant colors & theme.
Did you develop this site yourself? Please reply back as I’m looking to create my own site and would
like to find out where you got this from or what the theme is called.
Kudos!
w88
Its such as you learn my thoughts! You seem to grasp
so much approximately this, such as you wrote the e book in it or something.
I feel that you simply could do with a few p.c.
to force the message house a bit, but instead of that, this is excellent blog.
A great read. I will certainly be back.
hot
An outstanding share! I have just forwarded this onto a colleague who has been conducting a little homework on this. And he in fact bought me breakfast because I discovered it for him… lol. So let me reword this…. Thank YOU for the meal!! But yeah, thanks for spending the time to discuss this topic here on your website.
cheap
I was able to find good advice from your blog posts.
instagram child porn
Hello there, I found your site via Google whilst searching for a comparable subject, your site came up, it seems to be good. I’ve bookmarked it in my google bookmarks.
cohiba behike 56
I really appreciate this post. I have been looking all over for this! Thank goodness I found it on Bing. You have made my day! Thx again!
cheap
Very nice blog post. I certainly love this site. Keep writing!
Elektroschrott köln
Way cool! Some extremely valid points! I appreciate you writing this post and also the rest of the site is very good.
CBD Oil UK
Thank you for the auspicious writeup. It in fact was a amusement account it.
Look advanced to far added agreeable from you! By the way, how can we communicate?
Best CBD Oil Companies
Wonderful, what a blog it is! This web site provides
useful data to us, keep it up.
Best CBD Oil Companies
I loved as much as you’ll receive carried out right here. The sketch is attractive, your authored material stylish.
nonetheless, you command get got an impatience over that you wish be delivering the
following. unwell unquestionably come further formerly again since exactly the same nearly a lot often inside
case you shield this increase.
Best CBD Oil Companies
Hello there! This post couldn’t be written much
better! Looking through this post reminds me of my previous roommate!
He always kept talking about this. I’ll send this information to him.
Fairly certain he’s going to have a good read. I appreciate you for sharing!
Landscaping
I was suggested this web site through my cousin. I’m not positive whether
this put up is written via him as no one else know such particular approximately my difficulty.
You are amazing! Thank you!
Is CBD Oil Legal in the UK
It is the best time to make some plans for the future and it is time to
be happy. I’ve read this post and if I could I desire to suggest you few
interesting things or advice. Maybe you could write next
articles referring to this article. I wish to read even more things about it!
bubba kush
It’s really a nice and useful piece of info. I’m glad that you shared this helpful information with us. Please keep us informed like this. Thanks for sharing.
Elektroschrott abholung
Hi, I do believe this is an excellent web site. I stumbledupon it 😉 I’m going to revisit yet again since I book-marked it. Money and freedom is the greatest way to change, may you be rich and continue to help other people.
Best CBD Oil
Hello, I enjoy reading all of your article post. I like to write a little comment to support you.
CBD Oil Companies
Awesome post.
CBD Oil Companies
That is a great tip particularly to those fresh to the blogosphere.
Brief but very precise info… Many thanks for sharing this one.
A must read post!
Buy CBD Oil
We’re a group of volunteers and starting a new scheme
in our community. Your site provided us with valuable information to work on. You have
done an impressive job and our entire community will be grateful to you.
dialogue ringtones
This info is invaluable. How can I find out more?
law writer
I read this paragraph completely regarding the comparison of latest
and previous technologies, it’s awesome article.
school fees
Thank you for the sensible critique. Me and my neighbor were just preparing to do a little research about this. We got a grab a book from our area library but I think I learned more clear from this post. I am very glad to see such magnificent info being shared freely out there.
Visual stories for the web
Thanks , I’ve just been searching for info approximately this subject for a while and yours is the best I have found out so far. However, what about the conclusion? Are you positive about the source?
LED Neon Sign
Good post. I learn something totally new and challenging on sites I stumbleupon every day.
It’s always helpful to read through content from other
writers and use a little something from other web sites.
What is CBD
Hi all, here every one is sharing these kinds of familiarity,
therefore it’s nice to read this weblog, and I used to pay a visit this
weblog every day.
CBD Oil
Great post. I was checking continuously this blog and I am impressed!
Very helpful information particularly the last part :
) I care for such info much. I was seeking this particular info for a long
time. Thank you and best of luck.
Is CBD Oil Legal in the UK
What’s up, this weekend is nice designed for me, as this point
in time i am reading this wonderful educational paragraph here at my house.
achat base de données b2c
bookmarked!!, I really like your web site!
Ici
That’s some inspirational stuff. Never knew that opinions might be this varied. Thanks for all the enthusiasm to supply such helpful information here.
https://www.missionnairessansfrontiere.org/?option=com_k2&view=itemlist&task=user&id=241152
Hello i am kavin, its my first time to commenting anywhere, when i read this
article i thought i could also make comment due to this sensible paragraph.
avocat don manuel
Having read this I thought it was rather enlightening.
I appreciate you spending some time and effort to put
this information together. I once again find myself personally
spending way too much time both reading and posting comments.
But so what, it was still worthwhile!
http://www.digitalengineeringconcepts.com/business/what-you-need-to-know-about-enterprise-ethics/
I don’t even know how I ended up here, but I thought this post was great.
I don’t know who you are but certainly you’re going to a famous blogger
if you aren’t already 😉 Cheers!
maxi dress with sleeves
I’m amazed, I have to admit. Seldom do I encounter a blog that’s both equally educative and engaging, and without a doubt, you’ve hit the nail on the head.
The issue is something not enough people are speaking intelligently
about. Now i’m very happy I stumbled across this
during my hunt for something relating to this.
sequin dress
This is my first time pay a quick visit at here and i am in fact happy to read all at single place.
livescore
I just couldn’t leave your site before suggesting that I extremely loved the
standard information an individual supply on your guests? Is gonna be back frequently to
inspect new posts
btc hyip
This site certainly has all of the information I needed concerning this subject and didn’t know who to ask.
btc investors
An outstanding share! I have just forwarded this onto a co-worker who was doing a little research on this. And he actually ordered me breakfast due to the fact that I found it for him… lol. So allow me to reword this…. Thank YOU for the meal!! But yeah, thanks for spending the time to discuss this topic here on your site.
wisata pangandaran
You made some decent points there. I looked on the internet for more info about the issue and found most individuals will
go along with your views on this website.
sewa bus pariwisata
Greetings I am so glad I found your web site, I really found you by
error, while I was researching on Askjeeve for something else, Regardless I am here now and would
just like to say kudos for a tremendous post and a all round entertaining blog (I also love the theme/design), I don’t have time
to read it all at the moment but I have saved it and also added
your RSS feeds, so when I have time I will be back to read
a great deal more, Please do keep up the fantastic work.
Financial Planner
Hello.This article was extremely motivating, especially since I was browsing for thoughts on this topic last Friday.
The Inspiring Show
I have been surfing online more than 3 hours today, yet I never found any interesting article like yours. It is pretty worth enough for me. In my view, if all site owners and bloggers made good content as you did, the net will be a lot more useful than ever before.
game slot
I really like your writing style, superb information, thankyou for posting : D.
qq online
It’s appropriate time to make some plans for the longer term
and it is time to be happy. I’ve read this post and if I
may just I want to suggest you some attention-grabbing
things or suggestions. Perhaps you can write next
articles relating to this article. I want to read even more issues about it!
ww888
This is very interesting, You’re a very skilled blogger. I have joined
your rss feed and look forward to seeking more of your wonderful post.
Also, I’ve shared your website in my social networks!
sewa bus pariwisata
What’s up, the whole thing is going sound here and ofcourse
every one is sharing facts, that’s truly fine, keep up writing.
sewa bus pariwisata
Appreciation to my father who stated to me about this webpage, this weblog is really awesome.
Is CBD Oil Legal in the UK
Hi there everyone, it’s my first pay a quick visit at this web page, and article
is really fruitful designed for me, keep up posting such articles.
agen bola
Hi there! I just wanted to ask if you ever have any trouble
with hackers? My last blog (wordpress) was hacked and I
ended up losing many months of hard work due to no back up.
Do you have any solutions to prevent hackers?
تماشای آنلاین فیلم
Awesome blog you have here but I was wanting to know if you
knew of any message boards that cover the same topics talked about here?
I’d really love to be a part of online community where I can get suggestions from
other experienced individuals that share the same interest.
If you have any recommendations, please let me know.
Thanks!
Lapeer County
Hello, i believe that i saw you visited my site so i got here to return the desire?.I’m trying to to find
issues to improve my web site!I guess its ok to make use of a few of your ideas!!
Sample Documents
I must thank you for the efforts you’ve put in writing this
website. I am hoping to see the same high-grade blog posts
by you later on as well. In truth, your creative writing abilities has motivated
me to get my very own website now 😉
Leisure
I in addition to my friends have been following the good information from the website while quickly I had a horrible suspicion I had not thanked the site owner for those secrets. The men are already glad to read them and have now sincerely been loving those things. We appreciate you truly being really considerate and then for going for this form of quality areas millions of individuals are really needing to know about. My personal sincere regret for not saying thanks to sooner.
Wiley Reznick
I was able to find good advice from your articles.
ビークレンズ 炭
If you wish for to grow your experience only keep visiting this web page and be
updated with the newest gossip posted here.
sa
Great web site. Lots of useful information here. I’m sending it to a few friends ans also sharing in delicious. And obviously, thanks to your effort!
earn money online quick
you’re actually a just right webmaster. The site loading speed is amazing. It seems that you are doing any distinctive trick. Moreover, The contents are masterpiece. you have done a magnificent job on this subject!
What is CBD
Hi just wanted to give you a brief heads up and let you know a few of the images aren’t loading properly.
I’m not sure why but I think its a linking issue.
I’ve tried it in two different internet browsers and both show the same outcome.
Best CBD Oil
We are a group of volunteers and opening a new scheme in our community.
Your website provided us with valuable information to work
on. You’ve done a formidable job and our whole community will
be grateful to you.
w88
Highly descriptive post, I enjoyed that a lot.
Will there be a part 2?
reverse engineering of pl/sql
Greetings! Very helpful advice within this article! It’s the little changes which will make the biggest changes. Many thanks for sharing!
Best CBD Oil
What i don’t realize is in truth how you’re not actually much more
neatly-favored than you may be now. You’re very intelligent.
You know therefore significantly in the case of this matter, made me personally believe
it from a lot of various angles. Its like men and women are not fascinated until it’s one thing to do with Girl gaga!
Your individual stuffs excellent. At all times care for
it up!
knauf insulation
Hi! I just would like to offer you a huge thumbs up for the great info you have right here on this post. I will be coming back to your site for more soon.
xtratherm insulation
Aw, this was an extremely good post. Spending some time and actual effort to generate a great article… but what can I say… I put things off a lot and never seem to get nearly anything done.
music
Hi, I do think this is a great blog. I stumbledupon it 😉 I may come back yet again since i have bookmarked it. Money and freedom is the best way to change, may you be rich and continue to help other people.
comedy podcast
Excellent article. I am experiencing some of these issues as well..
Osna-Limo ist ein zertifizierter Limousinenservice mit den höchsten Ansprüchen. Professionell geschulte Fahrer sorgen für Wohl und Sicherheit.
I like the helpful info you provide in your articles. I’ll bookmark your blog and check again here frequently. I am quite sure I’ll learn plenty of new stuff right here! Best of luck for the next!
limousinenservice gelsenkirchen
I appreciate, cause I found just what I was looking for. You have ended my 4 day long hunt! God Bless you man. Have a great day. Bye
Kids camps Jacksonville
Do you mind if I quote a few of your posts as long as I provide credit and sources back to your webpage? My blog site is in the very same area of interest as yours and my visitors would genuinely benefit from a lot of the information you present here. Please let me know if this alright with you. Thanks!
Augustinus Judianto
We’re a gaggle of volunteers and starting a new scheme in our community.
Your web site provided us with useful info to work on. You’ve performed an impressive
activity and our entire group can be thankful to you.
Best CBD Oil
Hello there, I discovered your blog by the use of Google at the same time as looking for a comparable matter, your site came up, it seems great. I’ve bookmarked it in my google bookmarks.
Spotify Playlist Slam Entertainment
I like the valuable info you provide in your articles. I will bookmark your weblog and test again right here frequently. I am reasonably certain I’ll be told many new stuff right here! Good luck for the next!
buckboard catering & events
Heya i am for the first time here. I came across this board
and I find It truly useful & it helped me out a lot.
I hope to give something back and aid others like you helped
me.
top restaurant architecture
Great blog right here! Also your site loads up fast!
What host are you the usage of? Can I am getting your affiliate link in your host?
I wish my site loaded up as quickly as yours lol
Marcasite Jewelry
I like the valuable information you provide in your articles. I will bookmark your blog and check again here regularly. I am quite certain I will learn many new stuff right here! Best of luck for the next!
silver jewelry
Useful information. Fortunate me I found your site unintentionally, and I’m stunned why this coincidence did not happened earlier! I bookmarked it.
dachy plaskie
you are truly a excellent webmaster. The site loading speed is incredible. It kind of feels that you’re doing any distinctive trick. In addition, The contents are masterpiece. you have performed a magnificent process in this topic!
gallon water bottle
Sweet blog! I found it while surfing around
on Yahoo News. Do you have any suggestions on how to get listed in Yahoo News?
I’ve been trying for a while but I never seem to get there!
Cheers
xe88 casino
Admiring the dedication you put into your website and in depth information you provide.
It’s awesome to come across a blog every once in a while that isn’t the same
outdated rehashed information. Fantastic read! I’ve bookmarked your site and I’m including your RSS feeds to my Google account.
gallon water bottle
At this time it seems like WordPress is the preferred blogging platform
available right now. (from what I’ve read) Is that what you’re using on your blog?
xe88
My brother suggested I might like this website.
He was entirely right. This post actually made my day. You cann’t imagine simply how
much time I had spent for this information! Thanks!
gate repair toronto
After looking at a number of the blog posts on your web site, I truly appreciate your technique of blogging. I bookmarked it to my bookmark webpage list and will be checking back soon. Take a look at my website too and tell me what you think.
cruise
Right here is the perfect web site for everyone who hopes to understand this topic. You know so much its almost tough to argue with you (not that I personally will need to…HaHa). You certainly put a brand new spin on a topic which has been written about for a long time. Excellent stuff, just wonderful.
flight
Very good post. I am going through many of these issues as well..
travel
I could not resist commenting. Very well written.
toronto decks
Greetings! Very helpful advice in this particular post! It’s the little changes that produce the biggest changes. Thanks for sharing!
toronto fences
Very good write-up. I definitely love this site. Keep it up!
Jupiter Tree Care
I¡¦m not sure the place you are getting your info, however great topic. I needs to spend some time studying much more or working out more. Thanks for great info I used to be in search of this info for my mission.
koozie
Wow, marvelous blog layout! How long have you been blogging for? you make blogging look easy. The overall look of your site is magnificent, let alone the content!
dreams dictionary
Of course, what a magnificent site and revealing posts, I surely will bookmark your website.Best Regards!
Autentificare Procura in Londra
I must thank you for the efforts you have put in penning this website. I really hope to see the same high-grade blog posts by you later on as well. In fact, your creative writing abilities has encouraged me to get my very own blog now 😉
Notar in Londra
Way cool! Some very valid points! I appreciate you penning this post and the rest of the site is very good.
Notary Ealing
Everything is very open with a precise explanation of the challenges. It was truly informative. Your website is very useful. Thanks for sharing.
Notary Hayes
Very good info. Lucky me I recently found your blog by accident (stumbleupon). I have saved as a favorite for later!
Notary Uxbridge
I like it when folks get together and share views. Great blog, stick with it!
betway88
If you would like to obtain a great deal from this paragraph then you have
to apply these methods to your won webpage.
airline crew hotel
Hi mates, pleasant post and fastidious urging commented at this place, I am
in fact enjoying by these.
airline crew accommodations
Touche. Sound arguments. Keep up the good work.
crew logistics management
Greetings from Carolina! I’m bored to tears at work so I decided
to browse your blog on my iphone during lunch break. I enjoy the knowledge you provide here and can’t wait to take a look when I get home.
I’m shocked at how quick your blog loaded on my cell phone ..
I’m not even using WIFI, just 3G .. Anyhow, good blog!
bitcoin mining company in South Africa
That is the fitting blog for anyone who needs to find out about this topic. You notice a lot its virtually onerous to argue with you (not that I actually would want…HaHa). You definitely put a brand new spin on a subject thats been written about for years. Nice stuff, just nice!
Free shipping
Hi there very nice web site!! Man .. Beautiful .. Superb .. I’ll bookmark your site and take the feeds also…I am happy to seek out numerous helpful info here within the put up, we’d like work out more strategies on this regard, thanks for sharing.
yoga training singapore
Good day! I could have sworn I’ve been to this blog before but after checking through some of the post I realized it’s new to me. Anyhow, I’m definitely happy I found it and I’ll be book-marking and checking back frequently!
Suzuk
Your style is very unique in comparison to other folks I have read stuff from. I appreciate you for posting when you’ve got the opportunity, Guess I will just book mark this blog.
need money fast
I saw a similar post on another website but the points were not as well articulated.
Subaru Malaysia
Very nice blog post. I certainly appreciate this website. Thanks!
Leslie Fussell
An outstanding share! I’ve just forwarded this onto a colleague who was conducting a little research on this. And he actually ordered me dinner simply because I discovered it for him… lol. So let me reword this…. Thanks for the meal!! But yeah, thanks for spending some time to discuss this matter here on your blog.
Silbermünze
This is a great tip especially to those new to the blogosphere.
Simple but very precise info… Appreciate your sharing this one.
A must read article!
Echo Kockler
This is the perfect webpage for anyone who would like to understand this topic. You realize so much its almost tough to argue with you (not that I really would want to…HaHa). You definitely put a new spin on a topic which has been discussed for a long time. Wonderful stuff, just wonderful.
best cuban cigars
I’d must test with you here. Which is not one thing I normally do! I enjoy reading a put up that can make individuals think. Also, thanks for permitting me to comment!
Khyber Himalayan Resort Gulmarg
Amazing blog! Do you have any tips for aspiring writers? I’m planning to start my own site soon but I’m a little lost on everything. Would you propose starting with a free platform like WordPress or go for a paid option? There are so many choices out there that I’m totally confused .. Any recommendations? Thank you!
powerball site
Hi there! I just want to offer you a huge thumbs up for the great info you’ve got here on this post. I’ll be coming back to your site for more soon.
korea powerball
I love looking through a post that can make men and women think. Also, many thanks for permitting me to comment.
linksys 2.4 router setup
This site was… how do I say it? Relevant!! Finally I have found something that helped me. Thanks a lot!
belkin asus router dns error
I wanted to thank you for this excellent read!! I absolutely loved every little bit of it. I’ve got you book marked to look at new things you post…
chicken dinner ideas
Hi, I do believe this is a great blog. I stumbledupon it 😉 I am going to come back once again since i have book-marked it. Money and freedom is the best way to change, may you be rich and continue to help others.
guest post tech
You’re so interesting! I don’t suppose I’ve read anything like this before. So great to find someone with a few original thoughts on this issue. Seriously.. thanks for starting this up. This website is one thing that’s needed on the internet, someone with a little originality.
guest post wordpress
Right here is the right blog for anyone who really wants to understand this topic. You know a whole lot its almost hard to argue with you (not that I really will need to…HaHa). You definitely put a brand new spin on a topic that has been written about for many years. Great stuff, just great.
Bandar Poker Resmi
Youre so cool! I dont suppose Ive learn something like this before. So nice to search out someone with some original ideas on this subject. realy thanks for beginning this up. this website is something that’s wanted on the web, someone with a little originality. helpful job for bringing something new to the internet!
Fermina Straube
You have noted very interesting points! ps nice website.
business seo
I could not resist commenting. Very well written!
high search engine ranking optimization
It’s nearly impossible to find knowledgeable people in this particular subject, however, you sound like you know what you’re talking about! Thanks
Attorney Lead Generation
It’s a pity you don’t have a donate button! I’d without a doubt donate to
this fantastic blog! I guess for now i’ll settle for book-marking and adding your RSS feed to
my Google account. I look forward to brand new updates and will share this website with my Facebook group.
Chat soon!
kids play centre sydney
Hey there, I think your site might be having browser compatibility issues.
When I look at your website in Firefox, it looks fine but when opening in Internet Explorer, it
has some overlapping. I just wanted to give you a quick heads up!
Other then that, fantastic blog!
Vanessa
It’s actually a nice and useful piece of
info. I am satisfied that you just shared this useful info with
us. Please stay us up to date like this. Thanks for sharing.
Netflix
The next time I read a blog, Hopefully it doesn’t disappoint me just as much as this particular one. After all, Yes, it was my choice to read, however I actually believed you’d have something helpful to talk about. All I hear is a bunch of moaning about something you can fix if you were not too busy seeking attention.
Netflix
I’m amazed, I have to admit. Rarely do I encounter a blog that’s both equally educative and interesting, and without a doubt, you have hit the nail on the head. The issue is something too few people are speaking intelligently about. I’m very happy that I stumbled across this during my search for something concerning this.
cbg and cbd oil for sale
Currently it looks like Drupal is the best blogging platform available right now.
(from what I’ve read) Is that what you are using on your blog?
bare
I would like to thank you for the efforts you have put in writing this blog. I am hoping to see the same high-grade blog posts by you later on as well. In fact, your creative writing abilities has encouraged me to get my own website now 😉
bare
I seriously love your site.. Very nice colors & theme. Did you create this amazing site yourself? Please reply back as I’m looking to create my very own website and would love to find out where you got this from or what the theme is named. Cheers!
bare
I really like it whenever people come together and share opinions. Great website, keep it up!
bare
I blog often and I truly thank you for your information. This great article has truly peaked my interest. I am going to bookmark your website and keep checking for new information about once a week. I opted in for your RSS feed too.
魔道祖師
Hi everybody, here every person is sharing these familiarity, so it’s
nice to read this website, and I used to visit this blog every day.
bare
This is the perfect web site for everyone who hopes to find out about this topic. You realize so much its almost hard to argue with you (not that I personally will need to…HaHa). You certainly put a brand new spin on a topic that has been written about for a long time. Excellent stuff, just excellent.
bare
Can I just say what a comfort to uncover somebody that really knows what they’re talking about online. You definitely understand how to bring an issue to light and make it important. A lot more people really need to read this and understand this side of the story. I was surprised that you’re not more popular since you surely have the gift.
bare
After looking into a handful of the articles on your web site, I seriously appreciate your technique of blogging. I added it to my bookmark website list and will be checking back in the near future. Please visit my website too and let me know how you feel.
bare
I blog quite often and I genuinely thank you for your information. Your article has truly peaked my interest. I am going to book mark your blog and keep checking for new details about once per week. I subscribed to your RSS feed as well.
bare
I was excited to find this site. I wanted to thank you for ones time for this wonderful read!! I definitely savored every bit of it and I have you bookmarked to look at new stuff in your site.
comprar pulsera de 7 nudos
I simply couldn’t leave your site before suggesting that I actually enjoyed the standard info an individual provide to your guests? Is going to be back often to investigate cross-check new posts
cable charger
Wow! This can be one particular of the most useful blogs We’ve ever arrive across on this subject. Actually Magnificent. I’m also an expert in this topic so I can understand your hard work.
bare
Hi, I do believe this is an excellent site. I stumbledupon it 😉 I’m going to come back yet again since i have saved as a favorite it. Money and freedom is the greatest way to change, may you be rich and continue to help others.
bare
I was extremely pleased to discover this page. I wanted to thank you for ones time due to this wonderful read!! I definitely liked every bit of it and I have you saved to fav to see new information on your web site.
bare
This is a topic which is near to my heart… Thank you! Where can I find the contact details for questions?
The Best Drug Rehab Centers
Hi I am so grateful I found your weblog, I really found you by mistake, while I was looking
on Askjeeve for something else, Nonetheless I am here now and would
just like to say thanks a lot for a remarkable
post and a all round thrilling blog (I also love the theme/design), I don’t have time to look over it all at the moment but
I have book-marked it and also added in your
RSS feeds, so when I have time I will be back to read
much more, Please do keep up the awesome job.
bare
I want to to thank you for this great read!! I certainly enjoyed every bit of it. I’ve got you saved as a favorite to look at new things you post…
mens watches
I couldn’t resist commenting. Well written.
automatic watches
Next time I read a blog, I hope that it does not disappoint me as much as this one. I mean, I know it was my choice to read, however I really thought you’d have something interesting to talk about. All I hear is a bunch of complaining about something you could possibly fix if you weren’t too busy searching for attention.
Automatic watch
Greetings! Very useful advice within this post! It’s the little changes that produce the greatest changes. Thanks for sharing!
123movies
I seriously love your blog.. Great colors & theme. Did you build this amazing site yourself? Please reply back as I’m planning to create my very own site and would like to find out where you got this from or exactly what the theme is named. Thank you!
movies123
I love reading through a post that will make people think. Also, thank you for allowing me to comment.
Auto Financing Approval
I’m impressed, I must say. Rarely do I come across a blog that’s both equally educative and interesting, and without a doubt, you have hit the nail on the head. The problem is something which too few men and women are speaking intelligently about. Now i’m very happy that I stumbled across this during my hunt for something relating to this.
Get Approved Philadelphia
Howdy! This article could not be written much better! Reading through this article reminds me of my previous roommate! He always kept talking about this. I most certainly will send this information to him. Fairly certain he’s going to have a great read. Many thanks for sharing!
weight
Pretty! This was an incredibly wonderful post. Thanks for providing these details.
natural synergy
Hello! I could have sworn I’ve been to this web site before but after browsing through a few of the posts I realized it’s new to me. Nonetheless, I’m definitely pleased I discovered it and I’ll be bookmarking it and checking back frequently.
Básculas Bogotá
Very quickly this web site will be famous amid all blog visitors, due to it’s fastidious content
how to lose weight fast
Hello there, I do believe your site could possibly be having web browser compatibility issues. When I take a look at your blog in Safari, it looks fine however, if opening in IE, it’s got some overlapping issues. I simply wanted to give you a quick heads up! Besides that, great website.
how much should i weigh
This page certainly has all of the info I wanted concerning this subject and didn’t know who to ask.
fortnite accounts for sale cheap
It’s really a great and useful piece of info. I am glad that you shared this helpful information with us. Please keep us informed like this. Thanks for sharing.
Bandar Judi Indonesia
Fastidious answers in return of this question with genuine arguments and describing
the whole thing regarding that.
web site
indexletme işi..
buy magic mushrooms online
Wow, superb blog layout! How long have you been blogging for?
you made blogging look easy. The overall look of your website
is excellent, as well as the content!
dust masks
Hmm it appears like your blog ate my first comment
(it was extremely long) so I guess I’ll just sum it up what I submitted and say, I’m thoroughly enjoying your blog.
I as well am an aspiring blog blogger but I’m still new to
everything. Do you have any tips for newbie blog writers?
I’d genuinely appreciate it.
bullchat.nl
My husband and i have been very ecstatic that John could round up his reports through the entire precious recommendations he grabbed from your site. It is now and again perplexing to just continually be freely giving information and facts some people might have been selling. We keep in mind we now have the blog owner to give thanks to for this. Those explanations you’ve made, the easy web site navigation, the relationships your site help to promote – it’s got all incredible, and it’s helping our son and our family reckon that this theme is excellent, which is pretty essential. Many thanks for everything!
bluetooth microphone
Thank you so much for giving everyone an extraordinarily marvellous chance to read from this web site. It is usually so enjoyable and also stuffed with a good time for me personally and my office co-workers to visit your site at minimum three times in one week to read the fresh guidance you will have. And definitely, I am also certainly impressed for the great suggestions served by you. Some 1 areas on this page are basically the most impressive we have all had.
Robotic Hair Transplant System
Hey there! I understand this is sort of off-topic however I had
to ask. Does operating a well-established blog like yours take
a lot of work? I’m completely new to operating a blog however I do write in my diary everyday.
I’d like to start a blog so I can share my experience and feelings online.
Please let me know if you have any suggestions or tips for
brand new aspiring bloggers. Appreciate it!
CBD Oil UK
I believe that avoiding highly processed foods is a first step in order to lose weight. They could taste great, but packaged foods have got very little vitamins and minerals, making you eat more only to have enough electricity to get with the day. If you are constantly eating these foods, transitioning to grain and other complex carbohydrates will help you to have more energy while ingesting less. Thanks alot : ) for your blog post.
web site
web site indexletme işi.
더킹 카지노
Wow, this paragraph is good, my sister is analyzing such
things, so I am going to let know her.
tekno miles age
I really like your writing style, superb info, appreciate it for posting :D. “Every moment of one’s existence one is growing into more or retreating into less.” by Norman Mailer.
Situs IDN Poker
Would you be thinking about exchanging links?
elite torrent
I think this site holds some real fantastic information for everyone. “The expert at anything was once a beginner.” by Hayes.
Patrick Baah To Gov
I have to express thanks to you for bailing me out of this type of issue. As a result of checking through the internet and coming across things which were not beneficial, I figured my life was over. Existing minus the approaches to the problems you’ve fixed by way of your post is a crucial case, and ones which could have negatively damaged my career if I had not come across the website. The talents and kindness in taking care of every aspect was priceless. I am not sure what I would have done if I hadn’t discovered such a stuff like this. I can at this point relish my future. Thank you very much for your skilled and amazing guide. I will not think twice to recommend the sites to anyone who should get guidelines about this problem.
cuban cigars online
I am really impressed with your writing skills as well as with the layout on your weblog. Is this a paid theme or did you customize it yourself? Anyway keep up the nice quality writing, it’s rare to see a nice blog like this one these days..
bitcoin profit scam
I have learned some new elements from your web site about desktops. Another thing I’ve always thought is that laptop computers have become a specific thing that each family must have for some reasons. They offer convenient ways to organize homes, pay bills, shop, study, listen to music and also watch tv programs. An innovative strategy to complete these tasks is with a computer. These personal computers are mobile, small, powerful and transportable.
Real Estate Leads
I like the valuable information you provide in your articles.
I will bookmark your blog and check again here frequently.
I am quite sure I’ll learn a lot of new stuff right here!
Best of luck for the next!
Pat Mazza
Definitely believe that which you said. Your favorite justification seemed to be on the web the easiest thing to be
aware of. I say to you, I definitely get annoyed while people consider
worries that they plainly do not know about.
You managed to hit the nail upon the top as well as defined
out the whole thing without having side-effects , people can take a signal.
Will probably be back to get more. Thanks
Corona Escape
It is really a great and helpful piece of information. I’m satisfied that you shared this helpful info with us. Please stay us informed like this. Thank you for sharing.
you could try these out
Good write-up, I am regular visitor of one¡¦s site, maintain up the nice operate, and It is going to be a regular visitor for a long time.
Nigerian Universities
Wonderful work! That is the type of info that are meant to be shared across the internet. Shame on Google for now not positioning this publish higher! Come on over and visit my website . Thank you =)
Past Questions
Usually I don’t learn post on blogs, but I wish to say that this write-up very forced me to check out and do it! Your writing style has been surprised me. Thanks, very great post.
Alarmsysteem
Today, I went to the beach front with my kids. I found a sea shell and gave it to my 4 year old daughter and said “You can hear the ocean if you put this to your ear.” She placed the shell to her ear and screamed. There was a hermit crab inside and it pinched her ear. She never wants to go back! LoL I know this is entirely off topic but I had to tell someone!
discover this
Today, I went to the beach front with my children. I found a sea shell and gave it to my 4 year old daughter and said “You can hear the ocean if you put this to your ear.” She placed the shell to her ear and screamed. There was a hermit crab inside and it pinched her ear. She never wants to go back! LoL I know this is completely off topic but I had to tell someone!
blog here
I really appreciate this post. I’ve been looking everywhere for this! Thank goodness I found it on Bing. You’ve made my day! Thank you again!
Teeth Whitening Device
Have you ever considered about adding a little bit more than just your
articles? I mean, what you say is valuable and all. However
think about if you added some great images or video clips to give your posts more, “pop”!
Your content is excellent but with pics and videos, this blog could undeniably
be one of the very best in its niche. Wonderful blog!
web site
web site indexletme.
Hydroponics
When I originally commented I clicked the “Notify me when new comments are added” checkbox
and now each time a comment is added I get several e-mails with the
same comment. Is there any way you can remove me from that service?
Many thanks!
W88
Good post. I learn something new and challenging
on sites I stumbleupon everyday. It will always
be useful to read content from other authors and practice a little something from their websites.
Buy E-Liquid free shipping Melbourne
Good way of telling, and pleasant post to get data regarding my presentation focus, which i am going to
convey in institution of higher education.
roqya
Les pouvoirs publics ne s’intéressent-ils pas au sujet ?
Happy Rap Instrumental
It¡¦s actually a cool and helpful piece of info. I¡¦m satisfied that you shared this useful info with us. Please stay us informed like this. Thank you for sharing.
luxury home
Saved as a favorite, I love your web site!
Buy Sell Upgrade
Thanks for sharing, this is a fantastic blog post. Really Cool.
john barban resurge
Thank you ever so for you blog article.Really looking forward to read more. Great.
poseidon hd
You really make it seem so easy with your presentation but I find this topic to be actually something which I think I would never understand. It seems too complicated and very broad for me. I’m looking forward for your next post, I’ll try to get the hang of it!
silkbedding
With almost everything which appears to be developing inside this particular area, all your opinions are generally somewhat stimulating. Nevertheless, I beg your pardon, but I can not subscribe to your whole suggestion, all be it exhilarating none the less. It appears to everybody that your opinions are not totally justified and in actuality you are generally your self not even totally certain of the assertion. In any event I did appreciate reading it.
lace band frontal
I just could not leave your website prior to suggesting that I really enjoyed the standard info an individual supply on your visitors? Is gonna be again regularly in order to inspect new posts
hotmail sign in
Thanks so much for the blog post.Much thanks again. Fantastic.
make money with blog online
I have been browsing online more than 3 hours today, yet I never found any interesting article like yours. It’s pretty worth enough for me. In my view, if all web owners and bloggers made good content as you did, the internet will be much more useful than ever before.
dbs check
You made some first rate points there. I looked on the internet for the issue and found most individuals will associate with along with your website.
DC fitness equipment assembly
Good post. I learn one thing more difficult on totally different blogs everyday. It’ll always be stimulating to learn content material from other writers and follow a little something from their store. I’d desire to make use of some with the content material on my weblog whether or not you don’t mind. Natually I’ll offer you a hyperlink in your internet blog. Thanks for sharing.
xem them
fantastic publish, very informative. I’m wondering why the opposite specialists of this sector do not understand this. You should proceed your writing. I am confident, you’ve a huge readers’ base already!
Theron Mccraven
It is perfect time to make some plans for the future and it is time to be happy. I have read this post and if I could I wish to suggest you some interesting things or advice. Perhaps you can write next articles referring to this article. I wish to read even more things about it!
web site
web site index.
work from home
Hi there just wanted to give you a quick heads up. The words in your article seem to be running off the screen in Chrome. I’m not sure if this is a format issue or something to do with web browser compatibility but I thought I’d post to let you know. The style and design look great though! Hope you get the problem fixed soon. Cheers
www.certsgrade.com/pdf/2v0-61.19/
I really appreciate this post. I’ve been looking all over for this! Thank goodness I found it on Bing. You have made my day! Thx again
web site
https://www.hercampus.com/author/how-make-money-instagram
a course in miracles lesson 1
Hello very cool site!! Guy .. Beautiful .. Superb .. I’ll bookmark your blog and take the feeds additionally…I’m satisfied to find a lot of useful info right here within the publish, we’d like work out extra strategies on this regard, thank you for sharing. . . . . .
www.certifyschool.com/product/ccsk/
You have observed very interesting details! ps nice site.
youtube to mp3
I like what you guys are up too. Such clever work and reporting! Carry on the superb works guys I have incorporated you guys to my blogroll. I think it’ll improve the value of my site 🙂
auto slim jim
Thanks for giving your ideas listed here. The other matter is that any time a problem arises with a computer motherboard, people should not consider the risk associated with repairing the item themselves for if it is not done right it can lead to permanent damage to all the laptop. It is usually safe to approach your dealer of your laptop for any repair of motherboard. They have technicians who’ve an knowledge in dealing with laptop computer motherboard troubles and can carry out the right analysis and conduct repairs.
best casino bonus 2020
You made some clear points there. I did a search on the subject matter and found most persons will consent with your blog.
MAVIC 2
I keep listening to the newscast lecture about receiving free online grant applications so I have been looking around for the finest site to get one. Could you tell me please, where could i acquire some?
Ginger concentrate
Hi, i feel that i saw you visited my web site thus i got here to “go back the prefer”.I am attempting to find things to enhance my site!I suppose its good enough to use a few of your ideas!!
Swing set assembly
Thank you for the sensible critique. Me & my neighbor were just preparing to do a little research on this. We got a grab a book from our local library but I think I learned more clear from this post. I am very glad to see such wonderful information being shared freely out there.
Marketing Digital
marketing digital para empresas
free bitcoin signals
Thanks for expressing your ideas. I would also like to express that video games have been ever evolving. Better technology and inventions have helped create genuine and interactive games. All these entertainment video games were not really sensible when the real concept was first of all being used. Just like other designs of know-how, video games as well have had to progress through many many years. This itself is testimony on the fast growth and development of video games.
Virginia swing set assembly
whoah this blog is excellent i love studying your articles. Stay up the great paintings! You realize, many people are looking around for this info, you can aid them greatly.
Buy 2AI online overnight without prescription
This is the correct blog for anyone who wants to find out about this topic. You notice so much its nearly laborious to argue with you (not that I really would want…HaHa). You positively put a new spin on a subject thats been written about for years. Nice stuff, just great!
Ginger syrup
It’s a shame you don’t have a donate button! I’d most certainly donate to this outstanding blog! I guess for now i’ll settle for book-marking and adding your RSS feed to my Google account. I look forward to fresh updates and will share this site with my Facebook group. Talk soon!
E
I am now not certain the place you’re getting your info, but good topic. I needs to spend a while studying more or understanding more. Thanks for wonderful info I used to be searching for this info for my mission.
read this post here
Just wanna remark on few general things, The website style and design is perfect, the subject matter is very fantastic. “Drop the question what tomorrow may bring, and count as profit every day that fate allows you.” by Horace.
carte prepagate
Hey, you used to write excellent, but the last few posts have been kinda boring¡K I miss your super writings. Past few posts are just a little out of track! come on!
Euro Cleaner Hire
I simply wanted to appreciate you once more. I’m not certain what I might have implemented in the absence of the entire ideas documented by you regarding such field. This has been a troublesome condition in my view, but discovering the very well-written manner you resolved it forced me to weep over joy. Now i’m thankful for your advice and even sincerely hope you recognize what a powerful job you’re accomplishing teaching others using your web site. More than likely you’ve never come across any of us.
pokerqq online
I believe you have remarked some very interesting details , thankyou for the post.
web site
web site index.
best online bitcoin casino bakara
There are definitely lots of particulars like that to take into consideration. That could be a nice point to deliver up. I provide the ideas above as common inspiration however clearly there are questions just like the one you deliver up where the most important thing will likely be working in trustworthy good faith. I don?t know if best practices have emerged around things like that, but I’m certain that your job is clearly recognized as a good game. Each girls and boys feel the influence of only a second’s pleasure, for the remainder of their lives.
blog
I was recommended this blog via my cousin. I’m no longer certain whether this put up is written by means of him as no one else recognise such targeted about my difficulty. You are wonderful! Thank you!
Encontros de Sexo
You are my breathing in, I own few blogs and infrequently run out from to post .
new bitcoin online casino
I have been exploring for a little for any high-quality articles or blog posts on this sort of area . Exploring in Yahoo I finally stumbled upon this site. Studying this info So i’m happy to express that I’ve a very excellent uncanny feeling I discovered just what I needed. I such a lot surely will make certain to do not overlook this site and give it a look regularly.
smoretraiolit
Hmm it seems like your blog ate my first comment (it was extremely long) so I guess I’ll just sum it up what I submitted and say, I’m thoroughly enjoying your blog. I too am an aspiring blog blogger but I’m still new to the whole thing. Do you have any points for newbie blog writers? I’d definitely appreciate it.
adderall diaries
Thanks for sharing excellent informations. Your website is so cool. I’m impressed by the details that you have on this site. It reveals how nicely you perceive this subject. Bookmarked this website page, will come back for more articles. You, my friend, ROCK! I found simply the information I already searched all over the place and just could not come across. What a great website.
Best motivational speaker in Pakistan
Simply wanna tell that this is handy , Thanks for taking your time to write this.
dankwood meaning
It¡¦s actually a cool and useful piece of information. I am happy that you simply shared this useful info with us. Please keep us informed like this. Thanks for sharing.
dabwoods price
Hello my friend! I wish to say that this post is amazing, nice written and include almost all vital infos. I would like to peer extra posts like this .
Baba Poker Online
My spouse and I stumbled over here from a different page and thought I should check things out. I like what I see so i am just following you. Look forward to exploring your web page for a second time.
her explanation
I simply want to tell you that I am newbie to blogging and site-building and honestly liked your blog site. Almost certainly I’m want to bookmark your site . You certainly come with really good article content. Kudos for sharing your web site.
video downloader safari
You can certainly see your enthusiasm in the paintings you write. The world hopes for even more passionate writers such as you who aren’t afraid to mention how they believe. Always go after your heart. “Every man serves a useful purpose A miser, for example, makes a wonderful ancestor.” by Laurence J. Peter.
winnipeg courier
Pretty nice post. I simply stumbled upon your weblog and wanted to say that I have truly loved browsing your weblog posts. In any case I will be subscribing on your rss feed and I am hoping you write once more soon!
server tanıtım
server tanıtımı,server tanıtım,ko cuce,ko cüce,kocuce,
kocüce
colis poste international
I gotta favorite this site it seems handy extremely helpful
smoretraiolit
Absolutely composed content material, Really enjoyed reading.
Van Bahçesaray Haberleri
Van haberleri en güvenilir şekilde takip edebileceğiniz site.
cohiba esplendido
I think this is one of the most vital information for me. And i am glad reading your article. But wanna remark on few general things, The web site style is ideal, the articles is really excellent : D. Good job, cheers
go to website
I simply want to say I am beginner to weblog and seriously savored this web blog. Probably I’m planning to bookmark your website . You actually come with impressive stories. With thanks for sharing your web site.
best video game podcasts
Howdy, i read your blog occasionally and i own a similar one and i was just curious if you get a lot of spam responses? If so how do you reduce it, any plugin or anything you can advise? I get so much lately it’s driving me insane so any help is very much appreciated.
buy instagram likes
Thank you for some other wonderful post. Where else may anybody get that type of information in such a perfect means of writing? I have a presentation next week, and I am at the search for such information.
vanhaber
web site indexletme
music download
Oh my goodness! an amazing article dude. Thank you Nonetheless I am experiencing subject with ur rss . Don’t know why Unable to subscribe to it. Is there anybody getting similar rss problem? Anybody who is aware of kindly respond. Thnkx
Latest news
Keep functioning ,splendid job!
Overhead garage storage installation
I have been surfing online more than 3 hours today, yet I never found any interesting article like yours. It’s pretty worth enough for me. In my opinion, if all website owners and bloggers made good content as you did, the internet will be a lot more useful than ever before.
catering firmaları
yemek firmaları catering firmaları.
tabldot yemek
yemek firmaları catering firmaları.
elbise modelleri
elbise modelleri,şifon elbise elbise modelleri,şifon elbise
elbise modelleri,şifon elbise elbise modelleri,şifon elbise
https://www.mazibutik.com/
information technology business plan
A lot of thanks for every one of your work on this site. Ellie really loves carrying out investigations and it’s easy to understand why. A number of us hear all concerning the lively tactic you convey good secrets via the blog and in addition foster response from people on this article and our child has been discovering a whole lot. Take pleasure in the rest of the new year. You are carrying out a fabulous job.
iphone usado
I used to be very pleased to seek out this net-site.I needed to thanks for your time for this excellent learn!! I definitely having fun with every little bit of it and I have you bookmarked to take a look at new stuff you blog post.
Best motivational quotes in urdu
Good day! This is my first visit to your blog! We are a collection of volunteers and starting a new project in a community in the same niche. Your blog provided us valuable information to work on. You have done a extraordinary job!
animal fat
naturally like your website but you have to take a look at the spelling on quite a few of your posts. Several of them are rife with spelling issues and I find it very bothersome to inform the truth however I’ll definitely come back again.
sesso gay
Youre so cool! I dont suppose Ive read anything like this before. So good to seek out somebody with some unique thoughts on this subject. realy thank you for starting this up. this website is one thing that’s wanted on the internet, somebody with slightly originality. useful job for bringing one thing new to the internet!
Encontros de Sexo
I have been surfing online more than three hours nowadays, yet I never discovered any attention-grabbing article like yours. It’s pretty worth enough for me. In my opinion, if all webmasters and bloggers made just right content material as you probably did, the net will be a lot more helpful than ever before.
Encontros de Sexo
What i do not understood is actually how you are not really much more smartly-appreciated than you may be right now. You’re so intelligent. You recognize thus significantly in relation to this topic, produced me in my opinion believe it from numerous various angles. Its like women and men don’t seem to be involved until it’s something to accomplish with Lady gaga! Your own stuffs nice. Always handle it up!
Encontros de Sexo
Oh my goodness! an incredible article dude. Thank you Nonetheless I’m experiencing challenge with ur rss . Don’t know why Unable to subscribe to it. Is there anybody getting an identical rss drawback? Anybody who is aware of kindly respond. Thnkx
artist and repertoire
Pretty nice post. I just stumbled upon your blog and wanted to say that I’ve really enjoyed browsing your blog posts. In any case I’ll be subscribing to your rss feed and I hope you write again very soon!
Undifferentiated Connective Tissue Disease
Hello, Neat post. There is an issue with your web site in web explorer, could check this… IE nonetheless is the market leader and a big element of folks will miss your great writing because of this problem.
arthritis
Only wanna tell that this is handy , Thanks for taking your time to write this.
click to read
Real excellent information can be found on blog.
Maryland pool table assembly
Thanks for your article on the travel industry. I might also like contribute that if you are one senior thinking about traveling, it can be absolutely crucial that you buy travel insurance for senior citizens. When traveling, retirees are at greatest risk being in need of a health care emergency. Receiving the right insurance policy package for the age group can safeguard your health and give you peace of mind.
learn this here now
Merely a smiling visitor here to share the love (:, btw great style. “Individuals may form communities, but it is institutions alone that can create a nation.” by Benjamin Disraeli.
Swing set man
I truly appreciate this post. I’ve been looking all over for this! Thank goodness I found it on Bing. You have made my day! Thanks again!
Swing set man
Some genuinely prize content on this internet site , saved to bookmarks .
woodworking
I like what you guys are up too. Such clever work and reporting! Keep up the excellent works guys I have incorporated you guys to my blogroll. I think it will improve the value of my site 🙂
Website Backup
Hello.This article was extremely interesting, particularly because I was searching for thoughts on this topic last Wednesday.
Caribbean Business Magazine
I think I will become a great follower.Just want to say your post is striking. The clarity in your post is simply striking and i can take for granted you are an expert on this subject.
useful link
Good blog! I really love how it is simple on my eyes and the data are well written. I am wondering how I could be notified when a new post has been made. I’ve subscribed to your RSS feed which must do the trick! Have a nice day!
hemp pre rolls
Excellent beat ! I would like to apprentice while you amend your website, how can i subscribe for a blog site? The account helped me a acceptable deal. I had been a little bit acquainted of this your broadcast offered bright clear concept
cbd flower joints
I have recently started a website, the info you provide on this web site has helped me tremendously. Thanks for all of your time & work. “A creative man is motivated by the desire to achieve, not by the desire to beat others.” by Ayn Rand.
CBD gummies
Hello there! This blog post could not be written much better! Reading through this post reminds me of my previous roommate! He always kept preaching about this. I most certainly will send this information to him. Fairly certain he’ll have a great read. Many thanks for sharing!
best CBD oil
Very good information. Lucky me I recently found your website by chance (stumbleupon). I have bookmarked it for later!
One of a kind Art
With havin so much written content do you ever run into any issues of plagorism or copyright infringement? My blog has a lot of completely unique content I’ve either written myself or outsourced but it looks like a lot of it is popping it up all over the web without my authorization. Do you know any solutions to help prevent content from being ripped off? I’d certainly appreciate it.
Wedding Emblem
Great ¡V I should certainly pronounce, impressed with your site. I had no trouble navigating through all the tabs and related information ended up being truly simple to do to access. I recently found what I hoped for before you know it in the least. Reasonably unusual. Is likely to appreciate it for those who add forums or something, web site theme . a tones way for your customer to communicate. Excellent task..
halil
Halil.com.tr ile tüm güncel olayları takip edin.
Coronavirus
Thank you for the auspicious writeup. It in fact was a amusement account it. Look advanced to more added agreeable from you! By the way, how can we communicate?
halil ibrahim er
Halil.com.tr ile tüm güncel olayları takip edin.
Digital Forensics
I’m not positive where you’re getting your information, however good topic. I needs to spend a while finding out more or understanding more. Thank you for wonderful info I was searching for this information for my mission.
model management
Thanks , I’ve recently been looking for info about this topic for ages and yours is the best I’ve found out till now. But, what concerning the bottom line? Are you certain in regards to the supply?
model management
In the great design of things you actually get an A just for effort. Where you confused me was first in the facts. You know, as the maxim goes, details make or break the argument.. And it could not be much more true in this article. Having said that, permit me say to you precisely what did work. Your authoring can be extremely powerful which is most likely the reason why I am making the effort in order to comment. I do not make it a regular habit of doing that. Next, although I can easily notice the leaps in logic you make, I am not confident of how you appear to connect your ideas that produce the actual conclusion. For now I shall subscribe to your position but hope in the near future you link your facts better.
best CBD gummies
This is a topic that’s near to my heart… Thank you! Where can I find the contact details for questions?
covid19
I am now not positive the place you’re getting your info, but great topic. I needs to spend some time learning much more or understanding more. Thank you for excellent info I used to be looking for this information for my mission.
dermatologue lausanne
I genuinely enjoy looking at on this website , it holds great articles . “Sometime they’ll give a war and nobody will come.” by Carl Sandburg.
houston texas digital marketing agency near me
I will immediately take hold of your rss feed as I can’t find your email subscription hyperlink or e-newsletter service. Do you have any? Please permit me realize in order that I may just subscribe. Thanks.
best questions to ask a digital marketing agency
Keep up the great piece of work, I read few blog posts on this internet site and I conceive that your weblog is real interesting and has got bands of superb information.
best CBD gummies
I want to to thank you for this good read!! I definitely enjoyed every little bit of it. I have got you bookmarked to look at new stuff you post…
Bathroom remodel
I genuinely enjoy reading through on this internet site, it has got wonderful blog posts. “One should die proudly when it is no longer possible to live proudly.” by Friedrich Wilhelm Nietzsche.
calcul imc
One other issue is that if you are in a circumstances where you would not have a co-signer then you may want to try to exhaust all of your educational funding options. You could find many grants and other scholarships and grants that will supply you with money that can help with education expenses. Thx for the post.
best CBD gummies
This is a topic which is near to my heart… Many thanks! Where can I find the contact details for questions?
were to buy acid
Useful information. Fortunate me I discovered your website by chance, and I am stunned why this accident didn’t came about in advance! I bookmarked it.
gel lsd
Some genuinely select articles on this web site , bookmarked .
Storm damage
Fascinating blog! Is your theme custom made or did you download it from somewhere? A theme like yours with a few simple adjustements would really make my blog jump out. Please let me know where you got your design. Thank you
Umzüge
One important issue is that if you find yourself searching for a student loan you may find that you will want a co-signer. There are many situations where this is true because you will find that you do not use a past credit score so the loan company will require you have someone cosign the financing for you. Good post.
Umzugsfirma
I do agree with all the ideas you’ve presented in your post. They are very convincing and will definitely work. Still, the posts are very short for novices. Could you please extend them a little from next time? Thanks for the post.
IM MASTERY ACADEMY
This is a topic which is near to my heart… Best wishes! Exactly where are your contact details though?
web site
web site indexletme.
best CBD gummies
You’ve made some good points there. I looked on the net to learn more about the issue and found most individuals will go along with your views on this web site.
pop over to this site
I’m extremely impressed with your writing skills and also with the layout on your weblog. Is this a paid theme or did you modify it yourself? Either way keep up the nice quality writing, it’s rare to see a great blog like this one today..
Going Here
I carry on listening to the news broadcast talk about getting boundless online grant applications so I have been looking around for the best site to get one. Could you advise me please, where could i get some?
best CBD oil
I have to thank you for the efforts you’ve put in penning this website. I am hoping to check out the same high-grade content by you later on as well. In truth, your creative writing abilities has motivated me to get my own, personal blog now 😉
Ireland Web design
Aw, this was a really nice post. In idea I want to put in writing like this additionally – taking time and actual effort to make a very good article… however what can I say… I procrastinate alot and by no means appear to get one thing done.
Web design limerick
I simply could not leave your website before suggesting that I actually loved the standard info an individual provide to your visitors? Is gonna be again frequently to check up on new posts.
Asbestos Garage
Thanks for the sensible critique. Me and my neighbor were just preparing to do some research about this. We got a grab a book from our area library but I think I learned more from this post. I’m very glad to see such magnificent info being shared freely out there.
best CBD gummies
Way cool! Some very valid points! I appreciate you writing this post plus the rest of the site is also very good.
https://mefunnysideup.co
I am really impressed with your writing skills as well as with the layout on your weblog. Is this a paid theme or did you customize it yourself? Either way keep up the excellent quality writing, it is rare to see a nice blog like this one today..
ACM Asbestos
Very nice post. I just stumbled upon your weblog and wanted to say that I’ve really enjoyed browsing your blog posts. In any case I’ll be subscribing to your rss feed and I hope you write again very soon!
best CBD oil
I could not resist commenting. Exceptionally well written.
web site
web site indexletme.
best CBD oil
I used to be able to find good advice from your blog articles.
Mefunnysideup
Valuable information. Lucky me I found your site by accident, and I am shocked why this accident did not happened earlier! I bookmarked it.
Buy Rap Beats Online
Hello! I could have sworn I’ve been to this site before but after checking through some of the post I realized it’s new to me. Anyways, I’m definitely happy I found it and I’ll be book-marking and checking back often!
Buy Affordable Background Music
Simply want to say your article is as surprising. The clarity in your publish is simply cool and i could think you’re knowledgeable on this subject. Well with your permission let me to grab your RSS feed to stay updated with coming near near post. Thank you one million and please keep up the rewarding work.
Buy nembutal pills online
This design is steller! You certainly know how to keep a reader entertained. Between your wit and your videos, I was almost moved to start my own blog (well, almost…HaHa!) Great job. I really enjoyed what you had to say, and more than that, how you presented it. Too cool!
best CBD oil
Way cool! Some extremely valid points! I appreciate you penning this write-up plus the rest of the website is extremely good.
first time fucking
I have seen many useful points on your website about pc’s. However, I’ve the opinion that laptop computers are still not quite powerful more than enough to be a good choice if you generally do projects that require lots of power, just like video editing and enhancing. But for net surfing, microsoft word processing, and most other popular computer work they are fine, provided you do not mind small screen size. Many thanks for sharing your thinking.
best CBD oil
That is a very good tip especially to those new to the blogosphere. Brief but very precise information… Thank you for sharing this one. A must read article!
top world dating now
Together with every little thing which appears to be building within this specific area, many of your opinions tend to be relatively stimulating. Nevertheless, I beg your pardon, because I do not subscribe to your whole idea, all be it exciting none the less. It seems to us that your opinions are actually not completely rationalized and in actuality you are generally yourself not fully convinced of your argument. In any case I did appreciate looking at it.
connectworldatingnow
Incredible! This blog looks exactly like my old one! It’s on a completely different subject but it has pretty much the same layout and design. Superb choice of colors!
browse around here
I loved as much as you will receive carried out right here. The sketch is attractive, your authored subject matter stylish. nonetheless, you command get got an edginess over that you wish be delivering the following. unwell unquestionably come further formerly again since exactly the same nearly a lot often inside case you shield this increase.
great post to read
Simply wanna say that this is extremely helpful, Thanks for taking your time to write this.
quality porn
Hello. excellent job. I did not anticipate this. This is a fantastic story. Thanks!
best CBD oil for sleep
Having read this I believed it was extremely enlightening. I appreciate you spending some time and energy to put this short article together. I once again find myself spending a significant amount of time both reading and posting comments. But so what, it was still worth it.
crystalhorse
This website was… how do I say it? Relevant!! Finally I’ve found something which helped me. Thank you!
Furniture
Right here is the right site for anyone who hopes to find out about this topic. You know a whole lot its almost hard to argue with you (not that I actually would want to…HaHa). You definitely put a new spin on a subject that’s been discussed for ages. Excellent stuff, just great.